Because NASA and NOAA erase the past, all evaluations of historical climate vs temperature are completely meaningless.


| coecharlesdavid on Suggestions-50 | |
| oldbrew on Suggestions-50 | |
| oldbrew on Battle of the skies as airline… | |
| Jaime Jessop on Battle of the skies as airline… | |
| energywise on Battle of the skies as airline… | |
| saighdear on UK wind power constraint payme… | |
| liardetg on UK wind power constraint payme… | |
| saighdear on Battle of the skies as airline… | |
| oldbrew on Is Net Zero a poisoned chalice… | |
| energywise on Historic aurora show | |
| oldbrew on Historic aurora show | |
| Damian on Historic aurora show | |
| saighdear on Suggestions-50 | |
| saighdear on Historic aurora show | |
| oldbrew on Suggestions-50 |

Because NASA and NOAA erase the past, all evaluations of historical climate vs temperature are completely meaningless.

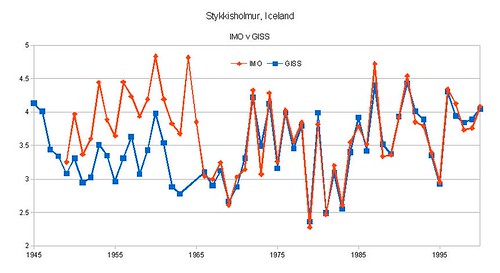
Reykjavik temperatures are particularly important since they give clear interaction between the N. Atlantic (AMO) and the Arctic Oceans natural variability.
Two years ago I did a quick comparison of two, and taking into account the time delay (I attribute to the ocean currents circulatory loop ) I presented in form of Reykjavik temperature forecast:
http://www.vukcevic.talktalk.net/RF.htm
Due to many other data follow-ups, had not gone back to see if the ‘forecast’ trend did materialise, but from the re-bloged graph it appears that Reykjavik temps have gone down a bit; It might take 4-5 years to positively confirm or otherwise the expected trend.
Needless to say the data confirms the pronounced AMO rather than ‘hockey stick’ type Reykjavik temperature variability.
Do NASA and NOAA want to deny a cooling period from 1940 to mid 1970, which was well illustrated in the older Reykjavik NASA-Giss temperature image, to which the following recent publicatiion has been attributed at. http://www.seaclimate.com/g/g1.html:
___”The role of the North Atlantic in the cooling period only recently received attention. D. Thomson et al. (2010) started a “Letter to Nature” with the sentence:
“The twentieth-century trend in global-mean surface temperature was not monotonic: temperatures rose from the start of the century to the 1940s, fell slightly during the middle part of the century, and rose rapidly from the mid-1970s onwards.”
In the same issue of Nature, Quirin Schiermeier (2010) addressed the findings in a comment as follows:
(Title): When the North Atlantic caught a chill. Surface cooling could have pushed down temperatures in the Northern Hemisphere 40 years ago.
(1st sentence): Three-tenths of a degree may seem a small dip — but, for climate researchers, the discovery that a large patch of the ocean cooled by 0.3 °C within a few years around 1970 is a small sensation.
Source: http://www.nature.com/news/2010/100922/full/467381a.html ”
“… then baffle ’em with …”
It was always too much to hope that Big Government would stay away from the Big Lie strategy.
It might be more more difficult for them to ‘adjust’ the satellite records without Roy Spencer noticing.
I have a memory of the Reykjavik record being discussed on another blog.
The reason for the difference was given as being due to the automated processing of the data deciding that the peak in the 1930s was due to a station change, as it was so abrupt.
The first record in the graphic (the one with the bump) is the unadjusted GHCNv2 version of the Reykjavik record. The second (the hockey stick) is the GISS “homogeneity adjusted” version. The GHCNv2 record had to be adjusted twice to achieve this result:
1. NOAA adjusted the GHCNv2 record to obtain the GHCNv3 version of the Reykjavik record.
2. GISS took the adjusted GHCNv3 record and adjusted it some more to obtain the GISS “homogeneity adjusted” version of the Reykjavik record.
Details of these adjustments on the graphic:
Grotesque adjustments of this kind are, however, largely confined to the Southern Hemisphere. NH records outside Iceland are mostly unadjusted, or at least they were the last time I checked.
Analysis and comment on this so-called “adjustments” is here
Click to access 20131107_GISS_Wibjorn_Karlen.pdf
A more extended comment
http://www.kaltesonne.de/?p=4743
[mod: Google translation from German –Tim]
Cosmic rays shows the actual pressure distribution in the polar vortex at an altitude of 15 km.

Repeats the situation as the previous winter. The sharp increase in temperature at a height of 45 km.http://www.cpc.ncep.noaa.gov/products/stratosphere/temperature/01mb9065.gif
I have a few more…
GISS fraud of Holar Hornafirdi, Iceland.

GISS fraud of Teigarhorn, Iceland

GISS fraud of Akureyri, Iceland

GISS fraud of Keflavik, Iceland

GISS fraud of Stykkisholmur, Iceland
GISS fraud of Thorshavn, Faeroe Islands.

Time travel at Grimsey, Iceland.
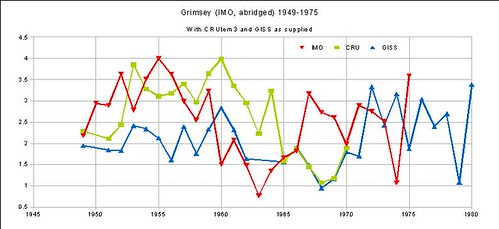

Interestingly, CRUtem3 and GISS show the same 5 year data shift for Grimsey, Iceland.
The apparent blockade zone polar vortex at altitudes above 20 km, the the zone of the ozone.

Sorry.http://oi39.tinypic.com/168tooh.jpg
Cosmic rays accurately shows the pressure and direction of impact of Arctic air on America.

Referring GISS I’ve seen also this recent post on Steven’s site:
http://stevengoddard.wordpress.com/2014/01/06/settled-science-update-8/
“In 1997, GISS showed that the earth was rapidly warming from 1866 to 1900. But by 1999, they showed the exact opposite for the same time period.”
Such a change invalidated completely the previous version and all research that was based on it.
Furthermore if it does not have reference to the raw data before the adjustments to clearly justify the methodology of the revision raises a huge question mark on its validity and not only for the referred period.
GISS looks like climate modell output and not like real data analysis.