


Gavin and Tom delivered their fraud right on schedule ahead of Paris, just as I predicted they would. They claim that October had the highest temperature anomaly ever recorded for any month.
Record-crushing October keeps Earth on track for hottest year in 2015 – The Washington Post

Somehow, they managed to calculate Earth’s temperature within 0.01 degrees – even though they had no temperature data for about half of the land surface, including none in Greenland and very little in Africa or Antarctica.
This kind of mind-blowing malfeasance would get them fired and probably escorted out of the building by security at many engineering companies.
Satellites cover almost the entire planet several times a day, and they showed that October had only the 25th highest monthly anomaly, and that every month in 1998 had a higher anomaly than October 2015.
data.remss.com/msu/graphics/TLT/time_series/RSS_TS_channel_TLT_Global_Land_And_Sea_v03_3.txt
Not only do NASA and NOAA make up…
View original post 92 more words

How much temperature increase is due to taking measurements in urban heat islands, which didn’t exist so much in 1880?
http://en.wikipedia.org/wiki/Urban_heat_island
Roger, I just posted this on Tony’s previous thread. Looks like they sneaked the Climate Pact throught the back door when we were not looking!
Our concern is a treaty that locks us in to the CAGW insanity. While we focused on the Paris-ite Circus in December, I think it just got slipped in the back door.
Thursday they just released the 5,544-page text of the Trans-Pacific Partnership The agreement involving 12 countries comprises nearly 40 percent of global economic output.
I did read ALL of the Obummercare bill and the Food Safety Modernization bill but I just don’t have the will to read this monstrosity. I spent the morning looking at what various articles have to say.
In light of Kent Clizbe’s concern over illegal immigration I was trying to find support for the skuttlebut that, like the EU there is open borders and no limit to movement.
From The Hill by former Bill Clinton advisor Dick Morris
I did finally find a Synopsis FROM THE US GOVERNMENT
It had this nasty surprise:
THE TEETH!
Unlike some other treaties the TPP has enforcement. Worse, as can be seen if you read between the lines it has ENFORCEMENT FOR OTHER TREATIES! The Groniad says this about the Trans-Pacific Partnership trade agreement:
Back to the US Government synopsis we find:
How about Immigration? And the adding of other countries without the approval of Congress?
RAH and Colorado will love this one. Lets let China make our Army equipment and North Korea our government Computers!
And what about our government services like the Post Office, drivers license bureau… Can’t leave those out.
I wouldn’t worry to much about it, these buggers are going down.
https://www.washingtonpost.com/news/federal-eye/wp/2015/11/18/congressional-climate-change-skeptic-threatens-to-subpoena-commerce-secretary-to-get-noaa-documents/
In addition we can now confirm that Arctic ice continues to exceed 2007.
https://rclutz.wordpress.com/2015/11/19/arctic-ice-recovery-confirmed/
Ron C: funny how data manglers somehow find new warming when multi-year observation shows sea ice in general increasing, and no recent Arctic decline.
http://realclimatescience.com/2015/11/another-milestone-of-failure-by-climate-experts/
Something doesn’t compute and my money’s not on the observations.
You guys ought to be careful about trusting S. Goddard.
The map he shows is dated 17 November. If you look at
you will see today’s (complete) version, which is what NOAA have actually released.
Still Goddard has said it’s fraud, so I guess we’re therefore all agreed it is fraud.
El Nino leads to temporary warming of seas in certain areas. This is well-known and nothing to do with man-made gases in the atmosphere.
http://oceanservice.noaa.gov/facts/ninonina.html
Actually, what Goddard does is worse than that. He reports on the NASA data release: a 1.04 degree anomaly but shows the NOAA (!!!) anomaly map as of 17 Nov. as evidence of fraud by NASA. I hadn’t realised becuase of the way he is yelling “fraud” at both simultaneously
Bill H says: “You guys ought to be careful about trusting S. Goddard.
The map he shows is dated 17 November. If you look at
you will see today’s (complete) version, which is what NOAA have actually released.
Actually, what Goddard does is worse than that. He reports on the NASA data release: a 1.04 degree anomaly but shows the NOAA (!!!) anomaly map as of 17 Nov. as evidence of fraud by NASA. I hadn’t realised becuase of the way he is yelling “fraud” at both simultaneously”
>>>>>>>>>>>>>>>
What in heck are you nattering on about?
The map Goddard shows is clearly marked as NOAA and GHCNM v3.3.0
GHCNM = Global Historic Climate Network Monthly and the URL is
(wwwDOT)ncdc.noaa.gov/sotc/service/global/map-land-sfc-mntp/201510.g i f
It is the ACTUAL MAP showing how limited the coverage actually is. Actually it is the map after the temperatures have been smeared over 250 km square. So Goddard is being nice when he says half. You show a map with the temperatures smeared and infilled to Hades and gone. It is a fantasy map not a ‘completed’ map.
The map Goddard shows is an illustration of what he says.
If you think Goddard is bad, you should see what E.M Smith has to say about those ClimAstrology maps.
GHCN – GIStemp Interactions – The Bolivia Effect
And if you look that nice red hot spot over Bolivia is STILL THERE FIVE YEARS LATER!
or see what Verity Jones has to say about the Death of the Thermometers.
Canada – Top of the Hockey League (Part 1)
So how did they get your ‘Completed’ map? via KRIGING!
The Kriging Game
Did my comment get kicked into moderation?
Since Word Unimpressed practices censorship, I will assume my comment went into a black hole and will recreate it
What in Hades are you nattering on about Bill H?
The map Goddard shows is a NOAA map. The URL is
(wwwDOT)ncdc.noaa.gov/sotc/service/global/map-land-sfc-mntp/201510.g i f
It says on the map GHCNM v3.3.0
GHCNM = Global Historic Climate Network Monthly.
It also says: “Please Note: Grey areas represent missing data”
Goddard’s statement is
The Map you post and call ‘complete’ is not ‘complete’ it is a fantasy map with smearing and infilling instead of actual data.
Actually Goddard is being nice since one thermometer reading is smeared over a minimum of a 250 km area. E. M. Smith is even more scathing and points out that some of those 250 km squares don’t even represent actual data!
GHCN – GIStemp Interactions – The Bolivia Effect
That was five years ago and that nice rosy spot is still there.
And Verity Jones points out that the Climastrologists DROPPED many many stations so they could use made-up data instead!
Canada – Top of the Hockey League (Part 1) (One of many posts on the subject)
So yeah, this type of ‘work’ would get you fired in a mining company. (See my last comment if it posts.)
The point of course is that NOAA is claiming to be able to calculate Earth’s temperature within 0.01 degrees C. Based on this claimed accuracy and precision NOAA then proclaims ‘Warmest Month Evah!’ and allows the prophets of Doom to proclaim ” The Earth is burning up!” or similar claptrap.
So lets look at that claimed 0.01 degrees C:
A peer-reviewed study Sensor and Electronic Biases/Errors in Air Temperature Measurements in Common Weather Station Networks by Lin et. al. concluded:
try, try again:
The point of course is that NOAA is claiming to be able to calculate Earth’s temperature within 0.01 degrees C. Based on this claimed accuracy and precision NOAA then proclaims ‘Warmest Month Evah!’ and allows the prophets of Doom to proclaim ” The Earth is burning up!” or similar claptrap.
So lets look at that claimed 0.01 degrees C:
A peer-reviewed study Sensor and Electronic Biases/Errors in Air Temperature Measurements in Common Weather Station Networks by Lin et. al. concluded:
Lock over Canada causes an inflow of air from the north over Europe.
(Sorry I blew the use of block quotes above)
Last is the whole subject of smearing data from one tiny point over large areas of a non-uniform surface and expecting it to tell you something useful. It is called kriging.
The Kriging Game
For temperature data the same type of problem occurs as in mining. The area under investigation is not uniform and therefore kriging can lead you astray.
Frank Lansner has done a lot of work with the original temperature records and has shown the temperatures of ocean influenced areas differ from the temperatures of ocean sheltered areas. He wrote up a clear article on the subject but it was posted at ‘He who Shall not be Named’
Luckily he has now posted it at his own site along with a lot of other good information:
http://hidethedecline.eu/pages/posts/original-temperatures-summary-279.php
I am happy he is finally at the writing up the information stage instead of the gathering info stage.
That to me is reliable.

Do not forget that this is El Niño.

Global monthly average lower troposphere temperature since 1979 according to Remote Sensing Systems (RSS). This graph uses data obtained by the National Oceanographic and Atmospheric Administration (NOAA) TIROS-N satellite, and interpreted by Dr. Carl Mears (RSS). The thick line is the simple running 37 month average, nearly corresponding to a running 3 yr average. The cooling and warming periods directly influenced by the 1991 Mt. Pinatubo volcanic eruption and the 1998 El Niño, respectively, are clearly visible.

Gail Combs thanks.
In the next year or two it may become clear whether El Nino is pushing out excess ocean heat due to lower solar input.
Oldbrew, in 2014 and 2015 was the highest in the cycle of geomagnetic activity.

At this point I really hope the temperature especially in Europe and the east coast of North America crashes with many many blizzards and record snow falls. I do not think It will take much more before the people rear up and tell the Progressives where to shove their World Totalitarian Government.
I have just about had enough of the Useful Idiots of the Elite coming on boards or commenting on news articles in support of policies that will get us all killed. Most of them are slippery slimy little worms with no real data to back them up.
I truly do not understand why people would rather be the boot lickers in a medieval type dark ages with a life that is nasty, brutish and short. I prefer a life in an enlightened age where there is REAL science and technology that benefits us all.
Gail Combs says:
November 20, 2015 at 12:03 pm
“At this point I really hope the temperature especially in Europe and the east coast of North America crashes with many many blizzards and record snow falls.”
It will be as you wish.
NCDC’s high anomalies comes from the fact that they DONT interpolate over large enough distances.
http://berkeleyearth.org/berkeley-earth-temperature-update/
Thanks Ren, I have no doubt the temperature has peaked and we will see a drop into 1960/70s type weather at the minimum.
Look closely at the bottom of this chart (decade by decade) to see what that means for the food supply.
The graph shows the movement of the Köppen Climate Boundary.
The 1974 CIA Report adds the other point.
…………..
I sometimes think that CAGW was a diversionary tactic to keep the masses from realizing the Elite were busy moving money and resources out of the northern areas like Europe, Canada and the USA into more equatorial areas in prep for a colder climate.
A month ago I laid out the whole thing at Stevengoddard : Knowledge of Gleissberg and the 88 year cycle; Hays & Shackleton and the Milancovitch cycles; Paul Erhlich and “Eco Science” and “The Population Bomb”; The sudden switch from supporting manufacturing to bashing manufacturing (EPA, OSHA, Affirmative Action in the USA) –All in the beginning of the 1970s. Tony H. took major exception to the idea the elite believed we were headed into major glaciation and were prepping for it since the 1970s. (He is a geologist who thinks the Holocene will go long.)
The critical point for me was Maurice Strong and the First Earth Summit in 1972.
Elaine Dewar wrote in Toronto’s Saturday Night magazine:
Wait a second! In the 1974 CIA report the critical problem was not global warming, it was global cooling and crop failure and the UN darn well knew it!
Remember even if the Holocene follows MIS11 and goes long, the climate WILL be cooler and it WILL be more erratic. Therefore a move towards the equator and a major curb on population (read wiping out) makes sense to the Elite. (Along with nuclear power and desalinization)
So what do we see? The middle East exploding and a ISIS map showing the exact area that would be coveted by the Elite if the climate cools.
Sort of explains why the MSM, EU, Canada, Aussie and USA leaders are blithely ignoring** what the man on the street can see as glaringly obvious threat. Wars and a bit of genocide are always good for population reduction. You just have to make sure you get the targeted populations riled up enough. So we have another “Lets you and he fight’ in the making.
Another major crisis is always good for diverting the publics attention away from the failed CAGW narrative as the people involved slink away to set-up the next crisis.
**The USA more than doubled muslim immigration since 9/11 adding 1.6 million muslims. Half are from areas filled with militant muslims.
Just an aside. Our local mountain got its first load of snow for the year this morning and I mean load, not the usual light dusting on the top that it usually gets around this time of the year. It is half way down and the mountains behind are covered as well. It looks as if it will a good ski season in the Pyrenees this year. (mountain – Canigou 2786m, approx 47km from the med)
Hi, Gail,
The problem with your argument is that Goddard’s article came out on 17th October in response to NASA’s release of the GISS values on that day. NOAA didn’t release its data for September 2015 until the 19th,
You and Goddard have no evidence to suppose that the data NOAA released on 19th October, as opposed to a map posted on their website sometime on or prior to the 17th, was based on only half the global land surface.
FInally Goddard is claiming NASA has committed fraud and yet has provided no evidence of the NASA dataset for September at all. There’s a word for defaming an organisation’s reputation with no evidence whatsoever: libel.
And you call me clueless….?!
That said, some countries can be late providing data. In thie case of Sept 2015 that included Brazil. NOAA and NASA are required to release their data so they will infill accordingly. That’s not fraudulent, since it’s made quite clear
Bill H

October 2015 surface air temperature compared to the average of the last 10 years. Green-yellow-red colours indicate areas with higher
temperature than the 10 year average, while blue colours indicate lower than average temperatures. Data source: Goddard Institute for
Space Studies (GISS).
October 2015 global surface air temperatures
General: The average global air temperature was
above the average for the last ten years. The main
reason for this is the present El Niño episode in the
Pacific Ocean (see p.12), which affects the global
air temperature in warm direction.
The Northern Hemisphere was generally relatively
cold, with the exception of western North America.
Especially central Russia was cold. The Arctic was
generally cold in the Russian-Siberian sector, while
the Greenland and Alaska sector was warm.
Near the Equator temperatures were above
average in most of the central and eastern Pacific
Ocean, reflecting the ongoing El Niño episode.
Otherwise, temperatures were near the average
for the last 10 years.
The Southern Hemisphere temperatures were
below average in South America and above in
Southern Africa and Australia. Otherwise,
temperatures were near or below the 2005-2014
average. The Antarctic continent had mainly above
average temperatures, although the coastal regions
of much of East Antarctic had below average
temperatures.
Click to access Climate4you_October_2015.pdf
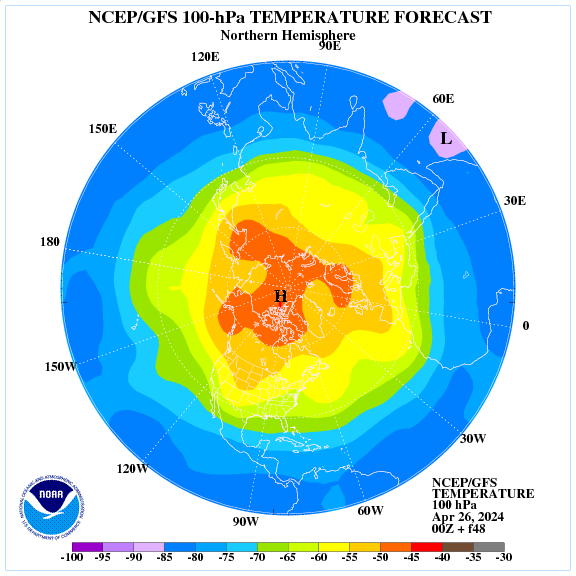
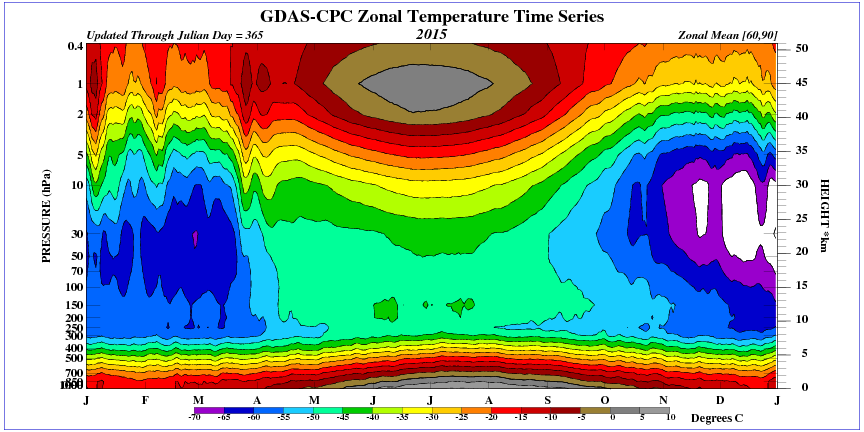
The polar vortex is now strong, as indicated by the drop in temperature in the stratosphere.
As a result of low temperatures in the stratosphere in the north appeared to already the ozone hole.
More problems with NOAA sea surface data.
‘THE DATASET USED BY NOAA FOR SHIP-BASED BIAS ADJUSTMENTS DOES NOT SUPPORT THE LOWER WARMING RATE IN THE FIRST HALF OF THE 20TH CENTURY’