


Reblogged from NoTricksZone By on 10. April 2017
Modern Solar Grand Maximum Ends: ‘Little Ice Age’ Cooling On The Way

During the 20th and early 21st centuries, Earth’s inhabitants have enjoyed an epoch of very high solar activity that is rare or unique in the context of the last several thousand years. The higher solar activity and warmer temperatures have allowed the planet to briefly emerge from the depths of the successive solar minima periods and “Little Ice Age” cooling that lasted from the 1300s to the early 1900s. Unfortunately, solar scientists have increasingly been forecasting a return to a solar minimum period in the coming decades, as well as the concomitant cooler temperatures.
In several newly published (2017) papers, scientists have suggested that a substantial deterioration into solar minimum conditions and global cooling may be imminent (see, for example, here and here and here). What follows is a collection of dozens of other papers that have also projected a solar minimum-induced “Little Ice Age” climate for the foreseeable future.
The analysis concludes with references to recently published papers that indicate the North Atlantic region has already begun cooling rapidly within the last decade. Scientists have long suggested that what happens in the North Atlantic may have global-scale implications, and thus the observed North Atlantic cooling trend may be a harbinger of the climate that is to come.
The Modern Grand Maximum Of Solar Activity A ‘Rare’ Or ‘Unique’ Event
Usoskin et al., 2014 “[T]he modern Grand maximum (which occurred during solar cycles 19–23, i.e., 1950–2009) was a rare or even unique event, in both magnitude and duration, in the past three millennia. Except for these extreme cases, our reconstruction otherwise reveals that solar activity is well confined within a relatively narrow range.”
Lockwood et al., 2009 “[T]he Sun has been unusually active over recent decades (Solanki et al. 2004; Vonmoos et al. 2006; Muscheler et al. 2007; Steinhilber et al. 2008). Solanki et al. (2004) used the 14C isotope abundance found in tree trunks and concluded that the Sun has been more active recently than at any time in the previous 8000 years and that it was as active as in recent decades for only 10% of the past 11000 years.”
Chen et al., 2015 “We explored the sources and characteristics of each pigment, reconstructed an 800-year record of ultraviolet radiation (UVR) and total incoming light intensity, and identified the possible factors that may have influenced historical UVR changes in this region. The results indicated at least four UVR [ultraviolet radiation] peaks during the past 800 years, corresponding to c. AD 1950–2000, 1720–1790, 1560–1630 and 1350–1480, with the intensity from the most recent [1950-2000] sediments being the highest.”


The Modern Grand Maximum Of Solar Activity Has Recently Drawn To A Close
Wang et al., 2010 “It is seen that a very active period that began in 1920, the so-called ‘current grand solar maximum’, will probably end during 2011-2027, since a variety of indices related to solar activity have significantly shifted since 1987. … [T]he current grand solar maximum has already lasted for eight 11-year solar cycles and might end in the coming one/two 11-year cycles; a grand solar minimum might prevail in the next 100–200 years.”
Zharkova et al., 2015 “The longest direct ervation of solar activity is the 400-year sunspot-number series, which depicts a dramatic contrast between the almost spotless Maunder and Dalton minima, and the period of very high activity in the most recent 5 cycles [1950s – 2000s], prior to cycle 24. … The records show that solar activity in the current cycle 24 is much lower than in the previous three cycles 21–23 revealing more than a two-year minimum period between cycles 23 and 24. This reduced activity in cycle 24 was very surprising because the previous five cycles were extremely active and sunspot productive forming the Modern Maximum.”
“We predict correctly many features from the past, such as: 1) an increase in solar activity during the Medieval Warm period; 2) a clear decrease in the activity during the Little Ice Age, the Maunder Minimum and the Dalton Minimum; 3) an increase in solar activity during a modern maximum in 20th century. .. We note, in particular, a decreasing activity for solar cycles 25 and 26 coinciding with the end of the previous 350–400-year grand cycle and then increase of the solar activity again from cycle 27 onwards as the start of a new grand cycle with an unusually weak cycle 30. Hence, cycles 25–27 marks a clear end of the modern grand period that can have significant implications for many aspects of solar activity in human lives including the current debate on climate change.”

press release A new model of the Sun’s solar cycle is producing unprecedentedly accurate predictions of irregularities within the Sun’s 11-year heartbeat. The model draws on dynamo effects in two layers of the Sun, one close to the surface and one deep within its convection zone. Predictions from the model suggest that solar activity will fall by 60 per cent during the 2030s to conditions last seen during the ‘mini ice age’ that began in 1645. … Results will be presented today by Prof Valentina Zharkova at the National Astronomy Meeting in Llandudno. … Zharkova and her colleagues derived their model using a technique called ‘principal component analysis’ of the magnetic field observations from the Wilcox Solar Observatory in California. They examined three solar cycles-worth of magnetic field activity, covering the period from 1976-2008. In addition, they compared their predictions to average sunspot numbers, another strong marker of solar activity. All the predictions and observations were closely matched. “Combining both waves together and comparing to real data for the current solar cycle, we found that our predictions showed an accuracy of 97%,” said Zharkova. “Effectively, when the waves are approximately in phase, they can show strong interaction, or resonance, and we have strong solar activity. When they are out of phase, we have solar minimums. When there is full phase separation, we have the conditions last seen during the Maunder minimum, 370 years ago.”
‘All Proponents Of Planetary Forcing Have Forecasted A Solar Grand Minimum For The Upcoming Decades’
Sánchez-Sesma, 2015 “Solar activity (SA) has non-linear characteristics that influence multiple scales in solar processes (Vlahos and Georgoulis, 2004). For instance, millennia-scale solar oscillations have been recently detected, like those of about 6000 and 2400 years, by Xapsos and Burke (2009) and Charvátová (2000), respectively, with important and interesting influences in the near past and future climate. These millennial-scale patterns of reconstructed solar activity variability could justify epochs of low activity, such as the Maunder Minimum, as well as epochs of enhanced activity, such as the current Modern Maximum, and the Medieval Maximum in the 12th century. Although the reason for these solar activity oscillations is unclear, it has been proposed that they are due to chaotic behavior of non-linear dynamo equations (Ruzmaikin, 1983), or stochastic instabilities forcing the solar dynamo, leading to on-off intermittency (Schmittet al., 1996), or planetary gravitational forcing with recurrent multi-decadal, multi-centennial and longer patterns (Fairbridge and Sanders, 1987; Fairbridge and Shirley,1987; Charvátová, 2000; Duhau and Jager, 2010; Perry and Hsu, 2000). It should be noted that all proponents of planetary forcing have forecasted a solar Grand Minimum for the upcoming decades, but one of them has also forecasted a Super Minimum for the next centuries (Perry and Hsu, 2000). In addition, during recent decades, statistical forecasts (with physically-based spectral information of reconstructed records) of solar magnetic activity predict a clear decrease in solar activity, reaching a minimum around AD 2100 (Steinhilber et al., 2013; S13, hereafter, Velasco et al., 2015)”
Liu et al., 2011 “Climate events worldwide, such as the MWP and LIA, were seen in a 2485-year temperature series. The largest amplitude and rate of temperature both occurred during the EJE [Eastern Jin Event (343–425 AD)], but not in the late 20th century. The millennium-scale cycle of solar activity determined the long-term temperature variation trends, while century-scale cycles controlled the amplitudes of temperature. Sunspot minimum events were associated with cold periods. The prediction results obtained using caterpillar-SSA showed that the temperature would increase until 2006 AD on the central-eastern Plateau, and then decrease until 2068 AD, and then increase again.”

Steinhilber and Beer, 2013 “Our methods are able to predict periods of high and low solar activities for a few centuries in the past. However, they are less successful in predicting the correct amplitude. Then, the methods were used to predict the period 2000–2500. Both methods predict a period of low activity around 2100 A.D. Between 2100 and 2350 A.D., the results are inconsistent regarding the duration of the low-activity state in 2100 A.D. and the level of activity until 2250 A.D.”

Lüdecke et al., 2015 “The Earth’s climate shows a rather regular oscillation of ∼ 200 year period during the last millennia. However, frequency, phase, and strength of the oscillation are found to vary in different time series of temperatures and for different times (see Figs. 4–6, and 5 8). Nonetheless, the relative historic stability of the cycle suggests that the periodic nature of the climate will persist also for the foreseeable future. Disregarding other conceivable forcings e.g. anthropogenic influences, an approximate prediction of the climate for the next 100 years suggests itself. Figure 9 shows the Tsine representation from AD 1800 to AD 2100 derived from the ∆Tsine representation by a π/2 phase shift. It gives correctly the 1850–1900 temperature minimum and shows a temperature drop from present to ∼ AD 2080, the latter comparable with the minimum of 1870, as already predicted in the studies (Steinhilber and Beer, 2013; Liu et al., 2011) on the grounds of solar activity data alone.”
Evans, 2016 “Four manifestations of unconventional climate influences are identified, each with at least as much effect on surface temperature as the direct heating effect of changes in total solar irradiance (TSI): external-driven albedo; countervailing cooling during TSI peaks, implied by the absence of corresponding peaks in the surface temperature record (the “notch”); the long-term sensitivity of surface warming to TSI increases; and the delay of ∼11 years between changes in underlying or smoothed TSI and the corresponding changes in surface temperature. We hypothesize these are all manifestations of a single force whose exact mechanism is unknown but whose crucial properties can be deduced: “Force X” modulates the Earth’s albedo, and lags TSI by one sunspot cycle or half the ∼22-year cycle of the Sun’s hydromagnetic dynamo. A second, alternative hypothesis is of “force N” for the notch and “force D” for the delayed force causing the other three manifestations. The notch-delay solar model can explain the global warming of the last few decades and centuries in terms of force X/D. Several solar indicators including TSI peaked ∼1986, but surface warming continued until ∼1998, which is explained by the delay. The notch-delay hypothesis predicts sustained and significant global cooling starting sometime in the period 2017 to 2022, of ∼0.3°C but perhaps milder (TSI estimates vary), as force X/D falls off in response to the marked decline in underlying TSI from around 2004—one of the three biggest and fastest falls in TSI since sunspot records began in 1610.”
Abdussamatov, 2015 “A long-term negative deviation of the Earth’s average annual energy balance from the equilibrium state is dictating corresponding variations in it’s the energy state. As a result, the Earth will have a negative average annual energy balance also in the future. This will lead to the beginning of the decreasing in the Earth’s temperature and of the epoch of the Little Ice Age after the maximum phase of the 24-th solar cycle approximately since the end of 2014. The influence of the consecutive chain of the secondary feedback effects (the increase in the Bond albedo and the decrease in the concentration of greenhouse gases in the atmosphere due to cooling) will lead to an additional reduction of the absorbed solar energy and reduce the greenhouse effect. The start of the TSI’s Grand Minimum is anticipated in the solar cycle 27±1 in 2043±11 and the beginning of the phase of deep cooling of the 19th Little Ice Age for the past 7,500 years around 2060±11. … Thus, the long term variations of the solar constant (allowing for their direct and secondary impacts, with the latter being due to feedback effects) are the major and essential cause of climate changes because the Earth’s climate variation is a function of longterm imbalance between the solar radiation energy incoming into the upper layers of the Earth’s atmosphere and Earth’s total energy outgoing back to space.”

Yndestad and Solheim, 2016 “In 1890´s G. Spörer and E. W. Maunder (1890) reported that the solar activity stopped in a period of 70 years from 1645 to 1715. Later a reconstruction of the solar activity confirms the grand minima Maunder (1640-1720), Spörer (1390-1550), Wolf (1270-1340), and the minima Oort (1010-1070) and Dalton (1785-1810) since the year 1000 A.D. (Usoskin et al. 2007). These minimum periods have been associated with less irradiation from the Sun and cold climate periods on Earth. An identification of a three grand Maunder type periods and two Dalton type periods in a period thousand years, indicates that sooner or later there will be a colder climate on Earth from a new Maunder- or Dalton- type period. …. The result shows that the TSI variability and the sunspots variability have deterministic oscillations, controlled by the large planets Jupiter, Uranus and Neptune, as the first cause. A deterministic model of TSI [total solar irradiance] variability and sunspot variability confirms the known minimum and grand minimum periods since 1000. From this deterministic model we may expect a new Maunder type sunspot minimum period from about 2018 to 2055. The deterministic model of a TSI ACRIM data series from 1700 computes a new Maunder type grand minimum period from 2015 to 2071. A model of the longer TSI ACRIM data series from 1000 computes a new Dalton to Maunder type minimum irradiation period from 2047 to 2068.”
Torres and Guzmán, 2016 “Conclusions Based on our results, we propose the use of the Wolf’s Number Oscillation Index (WNOI) – as a more uniform alternative to the ONI – in the range over 30 and below -30. The analysis of the material presented and the arguments discussed allows us to define a possible relationship between phenomena related to Solar Cycle, the ENSO, climatic conditions, as well as some criteria for the establishment of public policies for preservation and remediation of the environment in the long run. We can conclude that solar activity oscillations impact the earth climatic conditions to such a extent that they become measurable only in the long run. The magnitude of the Solar Cycle – from 7 to 17 and a mean of 11.2 years – seems to support this statement. Based on the similarities of the Solar Cycles 5 and 24 we can expect a longer period of cold weather for the years 2022 y/o 2034, corresponding to the Solar Cycles 24 and 25.”
Sanchez-Sesma, 2016 “This empirical modeling of solar recurrent patterns has also provided a consequent multi-millennial-scale experimental forecast, suggesting a solar decreasing trend toward grand (super) minimum conditions for the upcoming period, AD 2050–2250 (AD 3750–4450). … Solar activity (SA) has non-linear characteristics that influence multiple scales in solar processes (Vlahos and Georgoulis, 2004). For instance, millennia-scale solar oscillations have been recently detected, like those of about 6000 and 2400 years, by Xapsos and Burke (2009) and Charvátová (2000), respectively, with important and interesting influences in the near, past and future climate. These millennialscale patterns of reconstructed SA variability could justify epochs of low activity, such as the Maunder minimum, as well as epochs of enhanced activity, such as the current Modern Maximum, and the Medieval maximum in the 12th century. … We can conclude that the evidence provided is sufficient to justify a complete updating and reviewing of present climate models to better consider these detected natural recurrences and lags in solar processes.”
Riley et al., 2015 “[W]e suggest that the Sun evolved from a 2008/2009-like configuration at the start of the Maunder Minimum toward an ephemeral-only configuration by the end of it, supporting a prediction that we may be on the cusp of a new grand solar minimum.”
Abdusamatov, 2012 “The Earth as a planet will have a negative balance in the energy budget in the future as well, because the Sun is entering the decline phase of the bicentennial luminosity changes. … A deep bicentennial minimum in solar constant is to be anticipated in 2042 ± 11 and the 19th Little Ice Age (for the last 7500 years) may occur in 2055 ± 11.”
Solheim et al., 2012 “No significant trend is found between the length of a cycle and the average temperature in the same cycle, but a significant negative trend is found between the length of a cycle and the temperature in the next cycle. This provides a tool to predict an average temperature decrease of at least 1°C from solar cycle 23 to solar cycle 24 for the stations and areas analyzed. We find for the Norwegian local stations investigated that 25–56% of the temperature increase the last 150 years may be attributed to the Sun. For 3 North Atlantic stations we get 63–72% solar contribution. This points to the Atlantic currents as reinforcing a solar signal.”
Roth and Joos, 2013 “In contrast to earlier studies, periods of high solar activity were quite common not only in recent millennia, but throughout the Holocene. Notable deviations compared to earlier reconstructions are also found on decadal to centennial timescales. We show that earlier Holocene reconstructions, not accounting for the interhemispheric gradients in radiocarbon, are biased low. Solar activity is during 28% of the time higher than the modern average (650 MeV), but the absolute values remain weakly constrained due to uncertainties in the normalisation of the solar modulation to instrumental data. A recently published solar activity–TSI relationship yields small changes in Holocene TSI of the order of 1 W m−2 with a Maunder Minimum irradiance reduction of 0.85 ± 0.16 W m−2. Related solar-induced variations in global mean surface air temperature are simulated to be within 0.1 K. Autoregressive modelling suggests a declining trend of solar activity in the 21st century towards average Holocene conditions.”
Ahluwalia, 2014 “The Sun has emerged from a grand maximum for SSN cycles; it includes cycle 19, the most active cycle ever observed in 400 y. The grand minima are associated with cooler Earth temperatures (Eddy, 1976, 1981). The trend line indicates that we have entered a period of low solar activity; Ahluwalia and Jackiewicz (2012) suggest that we are at the advent of a Dalton-like minimum. The Earth was cooler then, made worse by Mt Tambora volcanic eruption on 5 April 1815.”
Salvador, 2013 “Using many features of Ian Wilson’s Tidal Torque theory, a mathematical model of the sunspot cycle has been created that reproduces changing sunspot cycle lengths and has an 85% correlation with the sunspot numbers from 1749 to 2013. The model makes a reasonable representation of the sunspot cycle for the past 1000 yr, placing all the solar minimums in their right time periods. The forecast is for a solar minimum and quiet Sun for the next 30 to 100 yr.”
Mörner, 2015 “By about 2030-2040, the Sun will experience a new grand solar minimum. This is evident from multiple studies of quite different characteristics: the phasing of sunspot cycles, the cyclic observations of North Atlantic behaviour over the past millennium, the cyclic pattern of cosmogenic radionuclides in natural terrestrial archives, the motions of the Sun with respect to the centre of mass, the planetary spin-orbit coupling, the planetary conjunction history and the general planetary-solar-terrestrial interaction. During the previous grand solar minima—i.e. the Spörer Minimum (ca 1440-1460), the Maunder Minimum (ca 1687-1703) and the Dalton Minimum (ca 1809- 1821)—the climatic conditions deteriorated into Little Ice Age periods.”
Duhau and de Jager, 2010 “[S]olar variability is presently entering into a long Grand Minimum, this being an episode of very low solar activity, not shorter than a century. A consequence is an improvement of our earlier forecast of the strength at maximum of the present Schwabe cycle (#24). The maximum will be late (2013.5), with a sunspot number as low as 55. … Solar activity is believed to be associated with climate change (De Jager and Duhau, 2009; De Jager et al., 2010; Miyahara et al., 2010). Sunspot activity can be concentrated in the two solar hemispheres and they appear to fluctuate for 11 year cycles. However, prolonged episodes of reduced sunspot activity, such as the Maunder Minimum, were clearly linked with an episode of extreme cooling and bitingly cold winters in Europe and North America, known as the ‘little ice age‘.”
Russell et al., 2010 “If we were to guess what the next solar cycle was going to be like from the behavior of the declining phase of solar cycle 23 to date, we would select solar cycle 4 beginning in 1785 as the analog of solar cycle 23 and solar cycles 5 and 6 as the analogs of the upcoming cycles 24 and 25. At this writing, the similarity of the inability of the new cycle to take hold with significant new cycle activity at high latitudes is striking. The epoch of cycles 5 and 6 has also been called the Dalton minimum, during which the sunspot number maximized at close to 50. It was also a period of global cooling.”

Miyahara et al., 2010 “Specifically, the “Little Ice Age” covers a cyclic period of cooling and glaciation which began in the 13th century and which continued into the 16th to 19th centuries, when glaciers began advancing southwards in Greenland and the North Atlantic, and perhaps worldwide. These episodes of global cooling appear to be linked to reduced solar activity. By contrast, the Medieval Warm Period occurred during a period of heightened solar activity. If these associations are valid, then future cyclic alterations would be expected to impact global temperatures including perhaps triggering another period of global cooling if sunspot activity is again reduced to a minimum. … The Sun is currently showing slightly different behavior compared with recent decades (Livingston & Penn, 2009). Consequently, concern has emerged regarding whether the Sun is approaching the next Maunder Minimum of reduced activity. Given this scenario, it has been suggested that global temperatures may decrease by about 0.3 °C as a result of a reduction in total solar irradiance (Feulner & Rahmstorf, 2010).”
Scafetta, 2012 “The model forecasts a new prolonged solar grand minimum during 2020-2045, which would be produced by the minima of both the 61 and 115-year reconstructed cycles. Finally, the model predicts that during low solar activity periods, the solar cycle length tends to be longer, as some researchers have claimed. These results clearly indicate that solar and climate oscillations are linked to planetary motion and, furthermore, their timing can be reasonably hindcast and forecast for decades, centuries and millennia.”
Archibald, 2007 “Our forecast for global average temperature to 2030 has been updated for the progression of Solar Cycle 23 and the contribution that will be made by increased carbon dioxide in the atmosphere. The increased length of Solar Cycle 23 supports the view that Solar Cycle 24 will be weak, with the consequence of increased certainty that that there will be a global average temperature decline in the range of 1° to 2° C for the forecast period [by 2030]. The projected increase of 40 ppm in atmospheric carbon dioxide to 2030 is calculated to contribute a global atmospheric temperature increase of 0.04°C. The anthropogenic contribution to climate change over the forecast period will be insignificant relative to natural cyclic variation.”
Landschiedt, 2003 “Analysis of the sun’s varying activity in the last two millennia indicates that contrary to the IPCC’s speculation about man-made global warming as high as 5.8° C within the next hundred years, a long period of cool climate with its coldest phase around 2030 is to be expected. It is shown that minima in the 80 to 90-year Gleissberg cycle of solar activity, coinciding with periods of cool climate on Earth, are consistently linked to an 83-year cycle in the change of the rotary force driving the sun’s oscillatory motion about the centre of mass of the solar system. As the future course of this cycle and its amplitudes can be computed, it can be seen that the Gleissberg minimum around 2030 and another one around 2200 will be of the Maunder minimum type accompanied by severe cooling on Earth. This forecast should prove skillful as other long-range forecasts of climate phenomena, based on cycles in the sun’s orbital motion, have turned out correct as for instance the prediction of the last three El Niños years before the respective event.”
The North Atlantic Region – Linked To Global Climate – Has Already Been Cooling Rapidly
Chafik et al., 2016 “The multidecadal variability of the North Atlantic Ocean has a strong signal in the sea surface temperature with many global climate linkages [Enfield et al., 2001; Knight et al., 2006]. An even stronger multidecadal signal can be found in the subpolar temperatures and salinities, where the Atlantic Water inflow variations constitute an essential part in the variability [Hátún et al., 2005; Häkkinen et al., 2011a; Reverdin, 2010]. The atmospheric forcing in the subpolar North Atlantic Ocean is dominated by the variability of the North Atlantic Oscillation (NAO), i.e., the leading mode of atmospheric variability in the North Atlantic sector, which modulates the atmosphere-ocean momentum and heat exchanges on a range of temporal scales. The subpolar ocean variability thus appears to be tightly connected to atmospheric forcing and associated basin-scale circulation changes, which together force the subpolar ocean properties toward extremes [Lozier et al., 2008, 2010], either to warm-saline or cold-fresh conditions on multidecadal scales. These regime changes [in the North Atlantic] have recently been argued to be important for global mean surface temperature warming acceleration and hiatus [Chen and Tung, 2014; Drijfhout et al., 2014].”

Duchez et al., 2016 “[C]old ocean temperatures were the most extreme in the modern record [since 1948] over much of the mid-high latitude North-East Atlantic. … we consider the exceptionally cold ocean surface anomaly that was already in place prior to the onset of the 2015 heat wave. The SST anomaly field for June 2015 shows temperatures up to 2 °C colder than normal over much of the sub-polar gyre with values that are the coldest observed for this month of the year in the period 1948–2015 indicated by stippling. The cause of this cold anomaly has been the subject of widespread interest in the media, we now show for the first time that it can be attributed to a combination of air–sea heat loss from late 2014 through to spring 2015 and a re-emergent sub-surface ocean heat content [cold] anomaly that developed in preceding years.”

Robson et al., 2016 “In the mid-1990s the North Atlantic subpolar gyre warmed rapidly, which had important climate impacts such as increased hurricane numbers and changes to rainfall over Africa, Europe and North America. Evidence suggests that the warming was largely due to a strengthening of the ocean circulation, particularly the Atlantic Meridional Overturning Circulation. Since the mid-1990s direct and indirect measurements have suggested a decline in the strength of the ocean circulation, which is expected to lead to a reduction in northward heat transport. Here we show that since 2005 a large volume of the upper North Atlantic Ocean has cooled significantly by approximately 0.45 °C or 1.5 × 10²² J, reversing the previous warming trend.”


On the one hand, it’d end the debate on AGW, on the other, the outcome of a cooler world has never been good. Several billion people could die, then all the decaying bodies would release all that co2 and Viola! Warming !
Of course, I think it’s the solar activity. If there is information that holds back from declaring a cooler world, it would be from the recent discussion on here about the planetary positions and the cycles.
Then there is Isvalgaard, who says the sun has absolutely nothing to do with it.
And then there is other evidence that at least one cool period looks like a close encounter with a comet.
So, what do I Know? I’m fairly certain co2 is not the control knob.
It’ll be interesting .
Reblogged this on Wolsten and commented:
It looks like we may need as much man-made warming as we can get our hands on. Who would have thunk it?
From 1913-1996 we had a long spell of solar cycles mostly shorter than the 11.07 year theoretical average.
http://en.wikipedia.org/wiki/List_of_solar_cycles
It had to end sometime and this century is the time. Longer cycles generally mean lower intensity of solar activity than shorter cycles, with consequences for Earth’s climate.
Full set of zeros north and south for sunspots from 6-20 March 2017.
Click to access monthlybull201703.pdf
Steinhilber and Beer, 2013 is the nearest to what I am looking at, which is long solar minima 2095-2145, and 2200-2250.
Reblogged this on Climatism and commented:
Not the best news, knowing that cold kills far more than warmth does – contrary to the global warming alarmists’ belief system.
However, an interesting scientific analysis of natural climate change variables…
Now here is the true meat of the argument about climate change.
Solar events ARE the driver of climate change.
Atmospheric humidity and CO2 level change are just symptomatic adjustments nature makes after the solar effects have penetrated through all the various natural processes. If the solar effect lasts long enough then oceanic temperature change establishes a new ‘normal’ to global cyclic temperatures within a new pattern of climate variations. Man’s influence on CO2 level and its alleged effects on atmospheric temperatures pale into insignificance in the face of nature’s far-reaching response to medium term (100 to 1000s of years) solar variations.
Reblogged this on Climate Collections.
Reblogged this on WeatherAction News.
Kenneth,

Just wondering if you’ve had time to check any of the references in Gosselin’s post about “papers predicting cooling”. I’ve had a look at some of them.
For instance the papers of Lockwood et al. and Steinhillber and Beer make no reference to any change in global temperatures, either cooling, or for that matter warming.
The Swiss National Science Foundation paper also fails to predict cooling, merely a small reduction in the rate of warming: “We could win valuable time if solar activity declines and slows the pace of global warming a little. That might help us to deal with the consequences of climate change.”
Another problem with Gosselin’s list is that some of the references can hardly be described as “recent”. For instance that of Solheim et al was published in 2012, but is making predictions for the 2009-2020 period, indicating that their work was carried out before 2009:
“ A 1 °C or more temperature drop is predicted 2009–2020 for “certain locations”.
Since we are getting to the end of this 11 year period. Maybe it’s time to check those predictions.” Since global temperatures have actually increased by several tenths of a degree since 2009, so a cooling of more like 1.5 degrees in the next 2-3 years is now required to confirm Solheim et al.’s predictions. Do you seriously think this is a reasonable supposition?
This is the problem for the “revolutionaries” seeking to overturn AGW theory. The revolution has been going on so long that a very sizeable corpus of discredited work is now building up.
Another example in Gosselin’s list is the unpublished work by Archibald (2007), again, hardly “recent”: : 1-2 degrees cooling by 2030. This came hot the on heels of his 2006 study predicting, guess what, 1 degree cooling by 2020: http://www.davidarchibald.info/papers/Solar%20Cycles%2024%20and%2025%20and%20Predicted%20Climate%20Response.pdf)
Once again a prediction that, with just 3 years to go is looking way, way off the mark.
I would suggest that climate sceptics carry out a major weeding out job on the “sceptical literature”, when they make their case.
Note that I’m not claiming that IPCC is all that great at prediction. Look for instance at their dismal failure in predicting Arctic Sea Ice Melt:
Bill H – your graph is 5 years out of date. Also the recent El Nino is over and the effects will wear off in the next year or two.
‘Experts said Arctic sea ice would melt entirely by September 2016 – they were wrong’
http://www.telegraph.co.uk/science/2016/10/07/experts-said-arctic-sea-ice-would-melt-entirely-by-september-201/
NATURE GEOSCIENCE | ARTICLE
Increased Arctic sea ice volume after anomalously low melting in 2013
The sharp increase in sea ice volume after just one cool summer suggests that Arctic sea ice may be more resilient than has been previously considered.
http://www.nature.com/ngeo/journal/v8/n8/full/ngeo2489.html
Here’s a five years out of date plot of Alaskan statewide temperatures to go with bill h’s five years out of date arctic ice plot
Gents, Well, if you want to defend the IPCC’s predictions from my criticism….
Actually it’s four years out of date, since the 2017 minimum is yet to be reached, but feel free to add the data for 2013-2016. You’ll see that the IPCC’s prediction as to the decline of sea ice is still way out compared with the data.
As for sea ice volume, oldbrew, any reason why you focus on the 2013 ice volume recovery, rather than up to date figures? Here is a graph to bring you up to date.
https://14adebb0-a-62cb3a1a-s-sites.googlegroups.com/site/arctischepinguin/home/piomas/grf/piomas-trnd4.png?attachauth=ANoY7cp1UtbkU2-z7MjYxbfwT5p8L5b3R3I8DywneBXpbaS50PleZLDQ28nMjAKpwfs-N0OpMZAK1yD47uJanukgQq_Andf-ze5yNjOgiWLS0uLHjEDtrN69e00aXBonSew7rOQjEFDV-ZVcIwMcOXjuA6kEUA6uiaLqMQsNWRHLNAIrev6siccM1WXHBgWS_0dK8giGOMkN76agW8NQoJWnOjm9xlmFU48P-bRDR4UlIgW4bD3Ig6x-H8OEKXTsXSIYxmZTjEFl&attredirects=0
Here’s a more up to date view of Arctic ice, which is following a sixty year cycle, as you’d expect, given the AMO, which it lags by around 7-9 years.
bill h: Well, if you want to defend the IPCC’s predictions
Just for the sake of clarity, the IPCC’s predictions (and hindcast) are junk science which ignore historical data and utilises a falsified model.
For bill h’s information, wordpress automatically displays images so long as the link to them specifies an image type with the url suffix (e.g. .jpg). Google user content fails this requirement.
Bill H says: ‘As for sea ice volume, oldbrew, any reason why you focus on the 2013 ice volume recovery, rather than up to date figures?’
Any reason why Bill H’s original graph stops at 2012 prior to the admitted ‘recovery’? IPCC theory expects the continuous rise of CO2 to be matched by Arctic ice behaviour, but sea temperatures don’t work like that.
Something in all this seems not at all right. I’ll explain with an example as in this link:
http://www.terradaily.com/reports/Tropical_Ice_Cores_Shows_Two_Abrupt_Global_Climate_Shifts_999.html
Nothing in the above explains these sudden long term changes. Quelccaya summit was warm, then frozen for ~ 5000 years, and is now warming again. Suddenly frozen plants do not point to the sun (but to a gremlin basking in it :)).
Oldbrew, I have already given you an answer to your question in my post of 11th April.
I decided that the chances of my having a constructive conversation on this site about the validity of the various references on “global cooling” were not terribly high and so limited the amount of effort I put in. The fact that you are not reading some of my posts and also you still seem to think that I’m trying to defend the IPCC’s predictions on climate change suggests that I might be justified in that decision. Fair enough: you, likewise, probably didn’t think the investment of your time warranted having such a conversation,.
So, that’s my explanation. And your explanation, oldbrew, for only going to 2013 would be….? In connection with that, thanks, Roger, for information about JPEG files. In case you both had problems opening my previous attachment, here is the same graphic from a different source:
http://neven1.typepad.com/.a/6a0133f03a1e37970b01bb098cffa0970d-pi
As you can both see the bounceback was very short lived, with 2017 data close to 2000 cubic km below any previous year in the satellite record, so I think you would agree in this particular case up to date data are relevant to the “bounceback issue”
Some cooling perhaps, but this grand minimum will be weak. A lot of the papers listed are junk and should be abandoned.
Some moderation delays today due to long-distance road travel, sorry about that.
– – –
Bill H – I quoted a 2015 paper and a late 2016 news story, so what’s the beef about 2013?
In any case a loss of sea ice would be expected in the wake of a major El Niño, which very recently happened.
But that in itself doesn’t indicate a long term trend, more like a blip.
El Niños recur, but only one every ‘several’ years on average. In the meantime La Niña is quite possible, delivering a broadly opposite effect.
In 2011, on a global scale, La Niña events helped keep the average global temperature below recent trends.
http://en.wikipedia.org/wiki/La_Ni%C3%B1a
I wouldn’t say these papers are junk. No matter how I look at it, the year that the sun went quiet, temperatures fell. You can argue otherwise. What’s junk is the IPCC reconstructing the temperature records.
Just because we haven’t experienced a cool period doesn’t mean it doesn’t exist with respect to solar activity. While there is some evidence based on different planetary positions that we may not be in for a deep cold spell. I am going to say I don’t know. However, if it does become omg is it cold, what do you think we should do ?
There has been no planning for colder temperatures. And just as ironically, outside of limiting co2 emmisions, which by CAGW’S own faulty math, will limit temperature rise by 0.1 C … nothing has been done either in respect to the worst case scenarios they predict.
TRUMP and PRUITT get the SCIENCE RIGHT – NATURAL CYCLES DRIVE CLIMATE CHANGE.
Climate is controlled by natural cycles. Earth is just past the 2004+/- peak of a millennial cycle and the current cooling trend will likely continue until the next Little Ice Age minimum at about 2650.See the Energy and Environment paper at http://journals.sagepub.com/doi/full/10.1177/0958305X16686488
and an earlier accessible blog version at http://climatesense-norpag.blogspot.com/2017/02/the-coming-cooling-usefully-accurate_17.html
Here is the abstract for convenience :
“ABSTRACT
This paper argues that the methods used by the establishment climate science community are not fit for purpose and that a new forecasting paradigm should be adopted. Earth’s climate is the result of resonances and beats between various quasi-cyclic processes of varying wavelengths. It is not possible to forecast the future unless we have a good understanding of where the earth is in time in relation to the current phases of those different interacting natural quasi periodicities. Evidence is presented specifying the timing and amplitude of the natural 60+/- year and, more importantly, 1,000 year periodicities (observed emergent behaviors) that are so obvious in the temperature record. Data related to the solar climate driver is discussed and the solar cycle 22 low in the neutron count (high solar activity) in 1991 is identified as a solar activity millennial peak and correlated with the millennial peak -inversion point – in the RSS temperature trend in about 2004. The cyclic trends are projected forward and predict a probable general temperature decline in the coming decades and centuries. Estimates of the timing and amplitude of the coming cooling are made. If the real climate outcomes follow a trend which approaches the near term forecasts of this working hypothesis, the divergence between the IPCC forecasts and those projected by this paper will be so large by 2021 as to make the current, supposedly actionable, level of confidence in the IPCC forecasts untenable.””
At present the sun is quite active magnetically.


The speed of sunshine is very jumping.
By 2020, Jupiter and Saturn are approaching each other.
http://www.fourmilab.ch/cgi-bin/Solar
2020-09-13 5:32:12
http://www.fourmilab.ch/cgi-bin/Solar?di=6C1C5C0654CD45C8BC5E8AD389736B96547A132C3C562DC628B82248779F9C9FE6FFE895F997982EFBFC299CBE9CA8B02C6BB0008FDDE833435E17DDFC8B559425B65DD16A7A9DF8046A75022D0094D1E8
Is the post-2020 magnetic activity falls again?
Low activity of sunspots causes the decrease of ultraviolet radiation.
http://www.iup.uni-bremen.de/gome/gomemgii.html
The neutron chart in Oulu can be used to compare solar activity in several cycles.


The 10.7cm Solar Flux is currently one of the best indices of solar activity we have. It now forms a consistent, uninterrupted database covering more than 50 years. Only sunspot number counts cover a longer period, going back to at least the 17th Century. However, these data are subject to subjective effects in observation and evaluation, and are affected by the weather.
There is a drop in temperature in the ozone layer above the equator. This may be related to the decrease in solar UV.
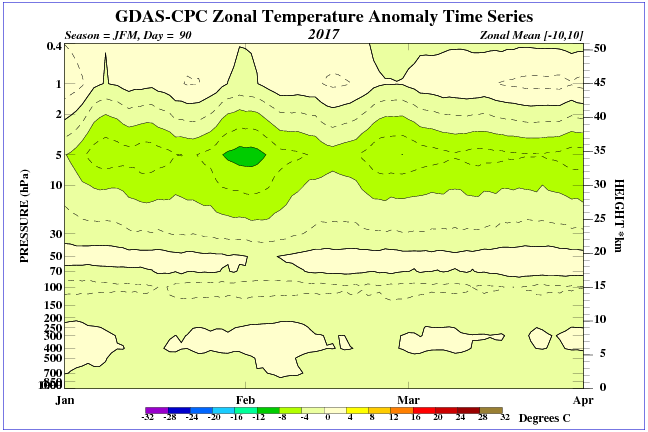
Upper air temperature products are based on measurements made by microwave sounders. Microwave sounders are capable of retrieving vertical temperature profiles of the atmosphere by measuring the thermal emission from oxygen molecules at different frequencies.
Compare ren’s 10.7cm flux graph [comment – April 13, 2017 at 7:11 am] with this:
Satellite Data: Post El Niño Global Surface Cooling Continues… Pause Extends To 20 Years
By P Gosselin on 12. April 2017
http://notrickszone.com/2017/04/12/satellite-data-post-el-nino-global-surface-cooling-continues-pause-extends-to-20-years/
Oldbrew new, very detailed description Usoskin.
“– Solar activity is dominated by the 11-year Schwabe cycle on an interannual
timescale. Some additional longer characteristic times can be found, including
the Gleissberg secular cycle, de Vries/Suess cycle, and a quasi-cycle of 2000–
2400 years (Hallstatt cycle). However, all these longer cycles are intermittent and
cannot be regarded as strict phase-locked periodicities.
– One of the main features of long-term solar activity is that it contains an essential
chaotic/ stochastic component, which leads to irregular variations and makes solaractivity
predictions impossible for a scale exceeding one solar cycle.
– The sun spends about 70% of its time at moderate magnetic activity levels, about
15–20% of its time in a grand minimum and about 10–15% in a grand maximum.
– Grand minima are a typical but rare phenomena in solar behavior. They form a
distinct mode of solar dynamo. Their occurrence appears not periodically, but
rather as the result of a chaotic process within clusters separated by the 2000–
2500 years (around the lows of the Hallstatt cycle). Grand minima tend to be of
two distinct types: short (Maunder-like) and longer (Spörer-like).
– The recent level of solar activity (after the 1940s) was very high, corresponding
to a prolonged grand maximum, but it has ceased to the normal moderate level.
Grand maxima are also rare and irregularly occurring events, though the exact rate
of their occurrence is still a subject of debates.”
Click to access nbnfi-fe201703061963.pdf
Thanks Ren – 97 pages of analysis there.
Usoskin: ‘The recent level of solar activity (after the 1940s) was very high, corresponding
to a prolonged grand maximum, but it has ceased to the normal moderate level.’
Some might say below the norm, e.g. see the NTZ post above.
tallbloke says:
“Here’s a more up to date view of Arctic ice, which is following a sixty year cycle, as you’d expect, given the AMO, which it lags by around 7-9 years.”
I don’t about lag, hysteresis for sure, but when there is a warm pulse to the AMO there is always a concurrent acceleration of sea ice loss.
Observationally the onset of the last two cold and warm phases of the AMO has a period of close to 65 years, while the astronomical mean of the Jupiter-Saturn-Uranus quadrature series driving it is 69.05 years.
oldbrew says:
“From 1913-1996 we had a long spell of solar cycles mostly shorter than the 11.07 year theoretical average.”
That is due to the Jupiter-Earth-Venus triplet return period to Uranus. And in fact during Maunder there were even shorter ones because the Jupiter-Earth-Venus triplet return faster to Neptune than they do with Uranus. The longer than average cycles generally occur on the transition into and out of each solar minimum.
oldbrew,
If you read the paper published in 2015 that you reference you will find that the data therein is only for 2013, hence “the beef”. As for the Telegraph article, I didn’t spend very long over an article that gives “sea ice volume” in “square metres”.
As for the idea that the large loss of ice in 2016 can be attributed to el Nino, there is actually very poor correlation between major ice losses and el Nino years, as you will see if you peruse the graphic in my original post. The big drop in 2012 actually followed a 2010-2011 la Nina, followed by a “neutral” year. Following your rather naive theory there should have been an “opposite effect” round about this time, to use your expression: there wasn’t. Also, note the absence of a big drop in sea ice in 1998 after the 1997/98 mega el Nino.
Heh ho: bang goes the theory.
bill h says:
“As for the idea that the large loss of ice in 2016 can be attributed to el Nino, there is actually very poor correlation between major ice losses and el Nino years..”
The three warmest AMO periods since 1995 were in 1998, 2010, and 2016, immediately following major El Nino episodes:
https://www.esrl.noaa.gov/psd/data/correlation/amon.us.data
Summer 2012 low sea ice anomaly was like 2007, increased negative North Atlantic Oscillation driven at the time, and both during strongly easterly QBO:
https://www.esrl.noaa.gov/psd/data/correlation/qbo.data
I am still seeing ice ?.? Wasn’t the Arctic suppose to be ice free in 2013. Al Gore, noble prize winner, said so.
We’re supposed to believe disaster is just around the corner. Not seeing it on the NSIDC chart here.

– – –
Bill H: ‘As for the Telegraph article, I didn’t spend very long over an article that gives “sea ice volume” in “square metres”.’
You may have missed the great doomster Wadhams in that case.
Prof Wadhams, described as ‘a leading expert on Arctic sea ice loss’, is quoted by the Telegraph:
“My view is that the trend of summer sea ice volume is relentlessly downward, such that the volume (and thus area) will come to a low value very soon – in a very small number of years,” he said. [bold added]
He says that nearly every year but we’re still waiting. We seem to be about 12-15% below the 30-year average this season, but the start of that period was quite a high point for Arctic sea ice.
Re ‘the paper was only for 2013’
No, it says ‘However, we observe 33% and 25% more ice in autumn 2013 and 2014, respectively, relative to the 2010–2012 seasonal mean, which offset earlier losses.’
It was written and peer reviewed in 2015. The point obviously is that sea ice levels in the Arctic are not always a ‘one-way street’ as some would like us to believe.
Historical interest – news report from Jan.13, 1939: Riddle of the glaciers
‘Ice Retreating – Geologists Still Puzzled – Worldwide Phenomenon’
That was nearly 80 years ago.
– – –
Evidence of historical glacier retreat in Switzerland (8/4/17)
This nomadic pasture farming was only possible as the glaciers drastically retreated during the so-called Holocene Climatic Optimum period.
http://www.swissinfo.ch/eng/prehistoric-farming-7000-years-ago–on-a-swiss-alp/43094518
MASIE Time Series Plots.
ftp://sidads.colorado.edu/DATASETS/NOAA/G02186/plots/4km/r11_Central_Arctic_ts_4km.png
ftp://sidads.colorado.edu/DATASETS/NOAA/G02186/plots/4km/r09_Canadian_Archipelago_ts_4km.png
https://nsidc.org/data/masie/masie_plots
Operational SST Anomaly Charts for 2017.
“While you sidestep the puddles and wrestle with your umbrella, be comforted by this: Northern California is going through the wettest rainy season on record.
The region broke the 34-year-old record for precipitation in one year, the Department of Water Resources reported early Thursday.
The eight-station index for the northern Sierra Nevada, a series of rain gauges positioned from Pacific House to the city of Mount Shasta, showed that 89.7 inches of inches have fallen since the water year began last fall.
The old record was 88.5 inches, in 1982-83.”
http://www.sacbee.com/news/weather/article144379334.html
http://www.intellicast.com/Global/Satellite/Infrared.aspx?region=hipacsat&animate=true
Satellite Products

The ice surface temperature strongly affects heat exchange between the surface and the atmosphere and the rate of ice growth. In order to perform proper forecasting of weather and sea-ice conditions, it is essential to obtain accurate surface temperatures.
California Data Exchange Center – Precipitation
https://cdec.water.ca.gov/cdecapp/precipapp/get8SIGraph.action?b=-1747636747
oldbrew’s link in his earlier post (see also SIS http://www.sis-group.org.uk/news/swiss-shepherds.htm) appears to support what I said earlier above. It would be interesting to know if any abruptly frozen material is also evident. The timing is right.
Thanks ren. I’ll just add this one:

@bill h says: April 13, 2017 at 9:53 pm : Most of us here know that 1912’s ice loss went nowhere, it was just broken up by the great storm. Thus evading satellite measurement, but aiding the 2013 ‘comeback’. We are not holding our breath for One Wadham, but snowflakes are welcome to. Less ice means more cooling to space, sorta thermostatic, like…….
Mea culpa, Oldbrew, I was wrong in thinking your reference only referred to 2013 data: it’s less out of date than I thought. I fell into the trap of being more interested on my own reply than the post to which I was I was a replying.
That said, despite a great deal of posts from you, tallbloke and others I’m still at a loss as to see why my original point about IPCC predictions was significantly undermined by a graph of data going up to 2012. It would have been nice if I had received a direct answer to this rather than an assortment of, apparently, tangential posts about temperature in Alaska, Peter Wadhams, Al Gore, a graph where multi-annual trends in sea ice are masked by the much larger intra-annual seasonal variation, etc.
It would appear that the implicit message behind all these posts is that Arctic Sea Ice is now on an upward trend, in accord with a 60 year oscillation, and the graphic I posted is highly remiss for not showing this. I am I correct in this surmise? A secondary message is that the loss of sea ice between 2015 and the present, for which, among other things, PIOMAS indicates sea ice volume trajectory running at about 2000 cubic km lower than in any previous year of satellite observations, is merely the result of the recent el Nino, and the upward “recovery” trend will resume in a matter of months .
I’ve already drawn attention to the lack of evidence for your “secondary message”. In addition, I also note that it would appear that you and tallbloke are making contradictory claims. On the one hand you are saying that arctic sea ice responds to el Nino events with a time lag of about one year, whereas tallbloke is saying that the ice responds to the AMO with a time delay of 7-9 years. Since the AMO takes place in the north Atlantic, a region closely connected to the Arctic, while el Ninos occur in the equatorial Pacific, where connections with the Arctic are weaker, surely the time lag should, if anything, be longer for el Nino events?
@Brett,
the reality is rather more complex. Liquid water has a much lower albedo than ice, especially ice in the form of snow,so the Earth absorbs more of the Sun’s radiation. I’m sure Rog would agree with me on that one.
Arctic chill will flow to Southern Europe. This will be a shock.
https://earth.nullschool.net/#2017/04/20/0000Z/wind/isobaric/500hPa/overlay=temp/orthographic=-347.58,48.00,1806
AO index is about to go negative.
http://www.cpc.ncep.noaa.gov/products/precip/CWlink/daily_ao_index/ao_index.html
Snow forecast in the Swiss Alps.
http://www.bergfex.ch/schweiz/wetter/schneevorhersage/?t=0_144
Temperatures dipped sharply after the 1998 and 2016 El Ninos, roughly back to their earlier levels, so far at least in the recent data.

oldbrew, this looks like a blatant diversionary strategy. We were, on and off, discussing the effect of el Ninos on arctic sea ice. Now you veer off onto the correlation between el Ninos and global temperature: a different issue. Further debate with you is clearly pointless.
@bill h says: April 15, 2017 at 9:24 pm: Troll all you like, we have discussed this before. It is strange to see people presenting unphysical contentions such as albedo where there is no light or none worth mentioning. In fact water’s real physical properties are not understood by the warmistas, that is proven. Debate requires knowledge and understanding, and/or a certain willingness to learn not possessed by CO2 magickers.
http://notrickszone.com/2017/04/12/satellite-data-post-el-nino-global-surface-cooling-continues-pause-extends-to-20-years/#sthash.2XPmxaYl.3AAlQrcn.dpbs
http://www.thegwpf.com/antarctic-peninsula-cooled-nearly-1c-during-1999-2014/
New Paper: N. Hemisphere Temps Rose 4–5°C Within ‘A Few Decades’ 14,700 Years Ago – 40 Times Faster Than Today’s Rates
This post plus the previous two show that AGW is false and before this decade ends will be obsolete.
The climate what will determine it from this point in time going forward is a very low solar/increased albedo /decrease overall sea surface temperature combination.
These in response to very low solar conditions which will promote less UV light cooling overall sea surface temperatures while an increase in major volcanic activity ,global cloud coverage/snow coverage will result in an increase in albedo. Even .5% increase in albedo would wipe out the natural warming that occurred from1840-2005 which was due to very active solar conditions throughout that time frame.
Already cooling is present and the sun has just started to approach my low average value solar criteria in order to accomplish this, despite some of the solar parameters remaining above my criteria that being the ap index/solar wind speed but those will be coming in line as sunspot activity diminishes which in turn will dry up coronal hole activity.
Cooling is imminent and the weakening geo magnetic field should compound things.
This grand minimum weakness is yet to be determined but looking good as of today..
Forecasts of the monthly mean sunspot number using the McNish and Lincoln method. The base principle was described in McNish A.G. & Lincoln J.V. 1949, (Trans. Am. Geophys. Union 30, 673-685). The method was further refined in the mid-1970’s by J.V. Lincoln (no published documentation), to include the latest solar cycles and to use monthly means instead of yearly means. These were the standard solar cycle predictions provided until recently by the SWPC-NOAA. Based on the original Fortran code kindly provided by the NCEI (NOAA, Boulder, USA), we reprogrammed the calculation in a modern form, while documenting this implementation. This method consists in least-square fitting a single mean cycle profile to the last 13-month smoothed sunspot number. This mean cycle is obtained by a simple averaging of all cycles between 1849 and 1975 (cycles 9 to 20), aligned on the time of their preceding minimum. This method can provide a reasonable prediction in the course of a cycle and a fair estimate of the upcoming maximum in the rising phase of the cycle. On the other hand, it is unusable around the times of cycle minima (+/- 1.5 year) and cannot provide any prediction of the expected length of a cycle (cf. Hildner, E. and Greer M.S, 1990, in R. I. Thompson, D. Cole, P. J. Wilkinson, M. A. Shea, and G. Heckman (eds.), Proceedings of Solar-Terrestrial Prediction Workshop III , NOAA and AFGL, USA. )
http://www.sidc.be/silso/prediml
bill h:
“Since the AMO takes place in the north Atlantic, a region closely connected to the Arctic, while el Ninos occur in the equatorial Pacific, where connections with the Arctic are weaker, surely the time lag should, if anything, be longer for el Nino events?”
Maybe, maybe not, best look at the AMO monthly anomaly data like I did and then decide. I gave the link up-thread.
California ski resort may stay open all summer – and fall – and into next season
APRIL 18, 2017
Squaw Valley CEO Andy Wirth told Truckee Tahoe Radio: “It’s been an incredible winter. Unprecedented.”
“I’m actually considering staying open through the summer and fall so it becomes the 16/17/18 season. We’re taking a hard look at that. Maybe we spin Shirley through the summer. There’s so much snow up there.”
http://www.iceagenow.info/california-ski-resort-may-stay-open-summer-fall-next-season/
Quebec ship gives up after 6-day battle with ice, passengers fly home
A ship that transports people and supplies to Quebec’s Lower North Shore was forced to abandon its efforts to get to the isolated community of Blanc Sablon, near the border with Labrador, after extraordinarily thick ice made the journey impossible.
Three Canadian Coast Guard icebreakers tried to clear a path through the ice for the Bella Desgagnés to the community beginning last Friday, but all efforts failed.
…
Blanc Sablon Mayor Armand Joncas said he has not seen ice like it in 25 years.
http://www.cbc.ca/news/canada/montreal/quebec-ship-gives-up-after-6-day-battle-with-ice-passengers-fly-home-1.4077691
Quote from link “Chunks of glaciers from Greenland are crowding the narrow Strait of Belle Isle”.
Is this ‘increase in ice’ or ‘increase breakup of old Greenland ice’ ??
oldmanK – could be both e.g. if it’s wind-related.
Earth Day CO2 Bubble
Posted on April 22, 2017 by tonyheller
A giant CO2 bubble has descended over Canada, and put the entire country in the deep freeze.
https://realclimatescience.com/2017/04/earth-day-co2-bubble/