


Reposted from the Cycles Research Institute’s Blog
A guest post from Ray Tomes
Over very long periods of time as ice ages come and go, it has been found that temperature leads atmospheric CO2 content by about 800 years. This seems to contradict the IPCC and other views that CO2 causes change in temperature. But we are looking at very different time scales with present changes, so perhaps things happen differently. I decided to examine this question.
The temperature data used is monthly global land-ocean temperature or GHCN, which is available from NOAA. The atmospheric CO2 data used is from Mauna Loa in Hawaii, the longest continuous record of CO2 also available monthly.
When wanting to find the causation when two series are both increasing over time, it is best to look at the rate of change of the variables as this will show clearly which one precedes the other. This first graph shows the rate of change of these two variables monthly over the period 1958 to 2009.

Rate of change of atmospheric CO2 content and land-ocean temperature
Both monthly series were processed in the same way. The change over a 12 month was calculated, and a 12 month simple moving average of these values was used to avoid all seasonal effects. That data was plotted at the centre of the 23 months values used in the calculation. Because the treatment was the same for both variables, they are directly comparable.
It can be seen that there is generally a good correlation, with nearly all peaks in one variable having similar peaks in the other. When one has a smaller peak such as around 1975, then so does the other. When one has a larger peak around 1973 or 1998, then so does the other. there are one or two minor variations from this.
It is also evident that the red temperature graph generally precedes the black CO2 graph on turning points. This suggests that temperature drives CO2 and not the other way around. A comparison of the two series at different lags gives this second graph.

Correlation between rate of change of global temperature and rate of change of atmospheric CO2 content
When the two series are coincident the correlation is quite small, r=0.13, whereas when temperature change 6 months earlier is compared to to CO2 change there is a maximum correlation of r=0.42 which is a high correlation for short period changes which have a high noise content. There is no high correlation for any lag when CO2 precedes temperature, the best being r=0.15 at 42 months.
It seems that, contrary to popular wisdom, temperature changes are driving atmospheric CO2 content changes, with a lag time of 6 months.

CO2 measure obtained next to an active volcano is as good guide as a humidity reading next to a spout of a boiling kettle.
http://www.soest.hawaii.edu/GG/HCV/maunaloa.html
It’s OBVIOUS that atmospheric CO2 cannot cause any significant warming (cooling is not to be dismissed). If temperature “wants” to go down, it goes down (or up) dispite CO2. It always happens at maximum CO2 concentrations that climate shifts from warming to cooling and vice versa.
I have been predicting for years that when the temperature shifts, we would see dropping CO2 concentration, despite anthropogenic input. The time has come.
Ray Tomes:
Fascinating post.
So fascinating that I just spent a couple of hours downloading the data and re-doing the exercise from scratch. Not because I had any reason to believe your results were wrong (in fact I replicated them very closely) but because you compared CO2 with the NOAA land-ocean temperature index, which is an apples-and-oranges average of sea surface and surface air temperatures that show different trends and which therefore shouldn’t be averaged together even though everyone does it. (Someone needs to write a post about this, but it’s O/T here)
Anyway, what I did was compare the CO2 record separately with surface air temperatures (GISS met. station only) and SSTs (ICOADS). I found that the rate of change in temperature does indeed lead the rate of change in CO2, but that SST leads CO2 by seven months while SAT leads it by only five. So a two-month lag between the rate of change in SST and SAT needs to be figured into the equation.
Thanks, Ray, for demonstrating the real cause and effect of temperature and CO2. This is the elephant in the room of the IPCC cabal of CAGW cargo cult scientists and your finding deserves widespread publicity.
I think there are a variety of lags depending on the length and intensity of cycles. Everyone knows about the 800+-400 year lag found in the Vostock ice cores. E-G Beck found a five year lag in his analyses of CO2 measurements by chemical means (180yrs) see here http://www.biomind.de/realCO2/statements.htm and look at his papers and the data he used. Amongst the literature he referenced there is a paper by W Kreutz 1941 which I think one can still download from Beck’s website -(down load the historic literature and I think the link is there in the spreadsheet). Kreutz made measurements of CO2 at 4 heights, temperature, radiation, pressure, wind speed, humidity, and precipitation 3 times a day for 1.5 years. He also measured the data over a week period every twenty minutes. In a graph set for the latter it can be seen that radiation leads temperature (about 1hr) which in turn leads CO2. The lag between temperature and CO2 is 1 to 2 hrs. A longer lag (2 to 3 month) is shown in the graph set for seasons over the total experimental period. Note the major lag is in the CO2 ground level measurement. The measurement at 14m is damped due to being the more constant background CO2 (which was in early 1941 about 380ppm -average considering wind velocity & direction- Massen&Beck,2009, similar to the present)
Regarding ice core records, my suggestion is to take it with a grain of salt (especially gases and timing). The ~800 years lag could easily be some kind of an artifact and not have any physical meaning.
@Tenuc: UN´s IPCC says temperatures follow CO2; UN´s FAO says temperatures follow LOD (Length of the Day). Which one of them does the UN consider valid?
ftp://ftp.fao.org/docrep/fao/005/y2787e/
ftp://ftp.fao.org/docrep/fao/005/y2787e/y2787e08.pdf
(See graph in page 50)
The thing that struck me was the variation in amplitudes. It suggest, but doen’t confirm, that most of the outgassing of CO² may be driven by ENSO.
@Stephen Richards…..trouble is we are in times of in…gassing 🙂
BTW (following Socrates´mayeutics): And what does it cause ENSO?. In this blog it has already found the answer….
CO2 measurements might have been better taken at a place other than Muana Loa as noted by Vucevic, but in fact other CO2 measurements correlate well with these ones but do not have such a long period of measurement. Therefore it is a good choice.
Roger Andrews, wonderful idea to look at the land and sea separately. This is an important part of the picture. The sea leads. It is not a surprise.
Thank you Tenuc.
Cementafriend, thanks for this interesting info. I should mention that having several different time intervals for lags is not a contradiction, it depends on the timescales that we are looking at. For others trying to find Kreutz refernces on the site, use http://www.google.com/search?q=W+Kreutz+site%3Abiomind.de
Stephen Richards, one other person commented on the cycle in my first graph by saying “congratulations, you have (re)discovered ENSO”.
Thanks everyone for comments. Most useful.
Re Meuna Loa data, I understand that there is a program that omits CO2 data when the reading is outside certain limits. I also understand that there is some correction but, as with GISS and CRU temperature adjustments, that there is no release of raw data, no computer code and no advice on manual adjustments. I also understand that the measuring instruments were not initial calibrated to other measurements around the world and so may have a bias.
CO2 is also measured at Cape Grim in Tasmania since 1977 see here http://www.csiro.au/greenhouse-gases/. Various CO2 and temperature data can be downloaded from KNMI climate explorer see for example here http://climexp.knmi.nl/getindices.cgi?CDIACData/co2+CO2+i+someone@somewhere
Ray: thanks for stopping by. The ENSO observation is very interesting. I wonder how much more outgassing occurs at times of El Nino than the average oceanic outgassing as SST rises. As we move into the cooler PDO regime, we might see a drop in the rate of increase. If the residence time for co2 in the atmosphere is around 7-10 years we might even see a fall in a decade or so if SST’s drop due to increased cloud.
Cementafriend, thanks for that info on CO2. I will have a look at repeating the graphs using alternative data. Another person has also told me of their results through CRI blog, and I will report on that eventually also.
Brazil snowfall surprises everyone:

http://www.rpp.com.pe/2011-06-27-brasilenos-son-sorprendidos-por-caida-de-nieve-noticia_379488.html
It looks like Dr Roy Spencer got there a couple of years ago:
http://www.drroyspencer.com/2009/05/global-warming-causing-carbon-dioxide-increases-a-simple-model/
His model says 90% of the signal is natural co2 increase due to SST , 10% anthropogenic.
Since temperature increase precedes co2 increase.It must be something else which causes temperature to rise.
I think I nailed that one a couple of years ago too.
For anyone looking into CO2 and associated matters, I suggest a look at:
Historic variations in CO2 measurements.
Posted by Jeff Id on March 6, 2010
Guest post by Tony Brown
Yes, Tallbloke, it is kind of widely known. There are also many papers about it (no links). It’s a travesty that it’s basically ignored.
IMO, that’s evidence against CO2-GW. Only very strong negative feedbacks (limiting factors) would stop CO2 and temperature from amplifying eachother and making the climate system very unstable.
Edim, I take it you mean only strong negative feedbacks would stop co2 and temp amplifying each other, if co2 is as strong a forcing as the IPCC claim?
Roy put s it at around 1.3C/doubling, unless something else warmed the ocean, which of course, it did. Reduced cloud cover allowed more sunlight in.
You say there are many papers, dig out the links. So far as I’m aware, the IPCC still clings to the d13C isotope ratio as proof that more than half the airbourne increase is human emissions.
I’m off to read through Harry Dale Huffman’s Venus paper again.
One of the things that can easily cause confusion is the correlation between solar activity and human activity. It has long been known that battles/wars show 11 and 22 year solar cycles http://cyclesresearchinstitute.org/cycles-history/dewey-cycleswar.pdf and http://cyclesresearchinstitute.org/cycles-research/general-chizhevsky.shtml
When we have human activity gone crazy in the last century or so, we don’t stop to think that it might have a solar cause. We assume that CO2 is dues to us. It may well be that both are caused by external factors, mainly the Sun.
IMO, the mechanism for solar affects on humanity is that the solar wind particles activate the Earth’s Schumann resonance at ~8 Hz, right in the middle of human brain wave activity. That causes us to get “uppity” at times of solar maxima and flares etc. Every part of this connection is well documented, but because of the lack of interdisciplinary research in modern times, the whole picture is seldom seen.
If I am right about this, and the Sun quietens down in coming decades, then we can expect humans to become less active also. Again, we will probably assume that any easing of CO2 is due to us. 🙂
Tallbloke, as you say IPCC assumes positive feedbacks that typically amplify effects of CO2 by 3 times or so. Have you seen the articles on satellite data analysis that show the feedback is actually negative? In other words they assume something like 5 times to much effect. Anyone who has read Lovelock’s book “Gaia” should understand that Earth’s climate is governed largely by negative feedbacks.
Hi Ray. I think wars arise both when the sun is active and inactive. In ancient times this was mostly tied to food supply. The timing of individual battles isn’t something I’d ever considered, but there must be a lot of undocumented ones.
Are you talking about negative cloud feedback? IPCC assumes a positive water vapour feedback. It’s the only way they can get co2 to do enough to worry anybody. Spencer and Lindzen/Braswell have independently shown negative cloud feedbacks from satellite data. I found an interesting correlation between upper troposphere specific humidity and solar activity which must affect cloud cover too. High cloud is a positive feedback to solar warming I think, as it forms later in the day and keeps warmth in at night. Maybe we don’t need the Svensmark effect to produce a terrestrial amplification of solar activity levels. Perhaps it is a second order effect which takes the cloud feedback in the same direction.
Wars arise at many times. Akexander Chizhevsky and Raymond Wheeler both studied wars (actually battles) and made indices over the last two thousand years or more. There are a number of cycles present, including 142 years, 53 years (matches economic depressions and climate perhaps) as well as the solar 22 and 11 year cycles and 6 years.
All feedback rather than just clouds I think. What you quote sounds like what I saw.
I’m posting this comment on this moribund thread partly because it’s on topic and partly in the hope that no one will read it, which means that I won’t catch any flak.
Over the last few weeks I’ve been digging into the data to see if I could come up with a relationship between emitted carbon, absorbed carbon and SST, and I think I now have it figured out. I can’t go into specifics, but here are the basic conclusions:
1. SST has an impact on atmospheric CO2, but only a very small one. Only about 0.5 ppm of the 54 ppm increase in atmospheric CO2 between 1958 and 2000 can in fact be attributed to the +/- 0.3C increase in global SST over this period.
2. The remaining 53.5 ppm is unquestionably anthropogenic (sorry about that).
3. However, the oceans continue to absorb a fairly constant 60% of the carbon we humans emit each year despite the large increase in emissions over the last few decades.
1) Disagree. Averaged figures are not the whole story. How much co2 is released in the major SST short term excursions such as big El Nino events?
2) Disagree. See 1)
3) Doesn’t that strike you as odd? It’s a red flag on the whole misconception of the human emission and the natural carbon cycle as far as I can see.
With these kind of numbers the real long term problem for life on Earth is that the amount of available surface Calcium is too high by percent of earths composition. And is tying up carbon and oxygen that could be invested in life forms rather than carbonate rocks.
It would seem that to prevent long term (500ky+) slow carbon dioxide starvation of the ecosystem we will need to find a way to slow down the entrapment and sequestration of CO2 via shell generating snails, and corals.
Richard, you are suggesting geo-engineering. It’s a slippery slope.
Curses! Someone read it. Knew that would happen.
TB: The only way I can respond is by writing my results up and sending them to you – although this would take some time because there would be a lot of pages and figures – and let you have at it. However, I wouldn’t be too upset if you could poke some holes in my logic because this is one of those cases where I set out to prove that SSTs had dunnit and finished up reaching totally the opposite conclusion.
Roger:
Transferring pdf to wordpress is a pain. Please, pretty please, sort out your wordpress account so you can become an editor on the blog and author articles directly.
I was just thinking out loud, if releasing CO2 from FFs is exothermic and releasing CO2 from Limestone is endothermic, and as proven from the Biosphere 2 experiment the cement reabsorbs the same amount of CO2 back as it ages.
What is the biosphere going to do to get more CO2 when the stores of fossil fuels are all burned way in the future? If the natural chemical balance of the earth will not allow free CO2 at some point?
I am just looking at both sides of the coin and wondering about sequestering CO2 under ground, will we just be forcing the whole world onto a diet? Not intending on giving Roger flack, just I was reminded that there is this underlying question of why the global CO2 level has been falling for all of recent 100My+ history.
And yes i think Roger should join the team of editors on here, the smoother the flow of ideas the better. Although I don’t feel I contribute as much as I should, due to waiting for results to post rather than just putting up ideas and goals I am shooting for. I will try to get a sample of the new higher density maps posted on the aerology page as soon as I get them processed, new CSV files for four cycles in hand today.
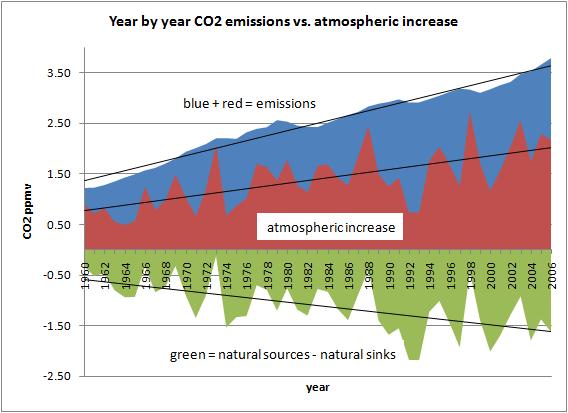
With regard to human emissions and CO2 levels in the atmosphere I did a comparison of long term data.
The emissions is based on “Fossil Fuel Global Carbon Emissions,metric tons” Refered to by GapMinder as cumulative but seems to be annual values to me. The stored link: http://cdiac.ornl.gov/ftp/ndp030/CSV-FILES/global.1751_2006.csv but that does not work now – ah, works if 2006 changed to 2008.
The CO2, again Hawaii starting 1959.
The correlation of the total emissions (accumulated from the above figures) and the CO2 figures is a staggering 0.9995 which is so close to 1 as to make one wonder how the figures were calculated in the first place.
Regression gives the pre-industrial (1750) base figure for CO2 as 294 ppm as best fit.
Richard, somewhat O/T but this may be of interest:
Click to access Sanders_lunar_ms.pdf
Ray, Tim Channon has also found some strangely perfect correlations in the co2 data. We will hopefully be putting up a post about this soon.
Thanks I have a copy of this paper printed from records at Linda Hall Library in KC Mo. filed in a drawer with a couple hundred others by Fairbridge, Robert Currie, and many others, from back before I got a computer.
Most of those researchers I printed out copies of their papers @ 10 cents a page from the mid 1980’s through 1998. And then I was able to find stuff directly on line. Had a couple phone conversations with Herd Willet just before he passed, visited UNCAR to try to talk to the modelers ther a couple of time they just sent me to the library and would not let me access anybody, “so as to not waste their time”.
Richard:
Good stuff. I need to read more Fairbridge and Currie, I’m getting more interested in the marine shoreline stuff and the Lunar-solar connection. Do you have any of Pettersson’s papers? Or a link?
I know Ian WIlson has been looking at lunar-solar timing too.
It seems these shoreline studies on eustatic sea level and periodicities in storminess have been brushed under the climate carpet by the modeleros. Time to dust off some older research I think as well as pushing forward with your new work.
TB
Relative to our 9.45 and 10.00 pm posts of yesterday and to the email I just sent you, I wasn’t suggesting that you posted my stuff. All I wanted was your valued opinion. 🙂
[…] and this was circulated to other blogs and much interesting discussion ensued, particularly on TallBloke’s Talkshop. This discussion raised the Cycles in Sunspot Number Reconstruction for 11,000 Years article […]
I did an analysis of the Be10 data as suggested. Many of the cycles found have similar periods (and phases) to the C14 proxy data. Please see http://cyclesresearchinstitute.wordpress.com/2011/07/13/analysis-of-be10-records-as-a-solar-irradiance-proxy/ for the article. Cycles found in Be10 (C14) – 351 years (352), 207 years (208), 104.7 years (104.3), 86.1 years (87.6 and 84.7). I show the 207 cycle filtered over 3 cycles. This clearly shows (again) that the 20th century was a solar increase phase for the entire century.
TB, I don’t agree with your final conclusion:
“It seems that, contrary to popular wisdom, temperature changes are driving atmospheric CO2 content changes, with a lag time of 6 months.”
In fact, what you have done is comparing the CO2 rate of change to temperature changes. Which is highly correlated, with a lag of CO2. That says something about the variability of the increase rate of CO2 around the trend, but next to nothing about the cause of the trend itself, because by looking at the rate of change, you have removed the trend!
That temperature is the main cause of the variability in CO2 increase is recognised by everybody: warmers as well as sceptics, see e.g. the calculations by Pieter Tans, NOAA, halfway his speech at the 50 years Mauna Loa festivities:
Click to access tans.pdf
But the trend itself is near fully caused by the human emissions: nature was a continuous sink for CO2 over the past 50+ years, see:


and compare the accumulation of CO2 in the atmosphere with temperature:
and with the accumulated human emissions:
The partitioning of the CO2 sequestering in oceans and vegetation is roughly known, see:
Click to access BenderGBC2005.pdf
The oceans sink about 2/3rd and vegetation about 1/3rd of the difference between the CO2 emissions and what is measured as increase in the atmosphere.
Ray Tomes says:
July 11, 2011 at 1:28 am
“The correlation of the total emissions (accumulated from the above figures) and the CO2 figures is a staggering 0.9995 which is so close to 1 as to make one wonder how the figures were calculated in the first place.”
Indeed, that is an extremely good correlation. On cause and effect: I don’t think that increasing CO2 levels in the atmosphere cause human emissions, thus in this case it is the other way out. Emission calculations are based on national inventories of fossil fuel use and burning efficiency, which are quite accurate (thanks to fuel taxes, maybe a little underestimated for under the counter sales and leakages…) and completely independent of the Mauna Loa (or other) CO2 measurements…
cementafriend says:
June 28, 2011 at 5:36 am
“Re Meuna Loa data, I understand that there is a program that omits CO2 data when the reading is outside certain limits. I also understand that there is some correction but, as with GISS and CRU temperature adjustments, that there is no release of raw data, no computer code and no advice on manual adjustments. I also understand that the measuring instruments were not initial calibrated to other measurements around the world and so may have a bias.”
The rules for calibration of the equipment, calculation and inclusion or exclusion of data at Mauna Loa can be found here:
http://www.esrl.noaa.gov/gmd/ccgg/about/co2_measurements.html
Raw (hourly averaged data + stdv, directly calculated from 10-second sample voltage readings of the instruments) can be found for four stations, including MLO, up to 2009 at:
ftp://ftp.cmdl.noaa.gov/ccg/co2/in-situ/mlo/
On simple request, I received a few MB of raw 10-second voltage reading data from the instruments from Pieter Tans of NOAA, where I used my own calculations to compare the result with the hourly averages: a near perfect match (as I used a linear interpolation of the data, while NOAA uses a slightly non-linear curve for interpolation).
The calculation is quite simple, one can do that in any computer language or, as I did, on an Excel sheet. Here the calculation for one hour of raw voltages, including how the calculation was implemented and compared with the data as stored. can be downloaded from:
http://www.ferdinand-engelbeen.be/klimaat/mlo_raw_v_2006_11_17_00h.xls
For two days of measurements (2 MB):
http://www.ferdinand-engelbeen.be/klimaat/mlo_raw_v_2006_11_17_18.xls
The brand new measuring instrument was not calibrated with the old chemical methods, simply because the latter had an accuracy of +/- 10 ppmv, the new one was accurate to about +/- 0.1 ppmv. It was simply impossible to use the old methods for comparison. But the new instrument was calibrated with a self made (by C.D. Keeling) manometric measurement method, accurate to about 1:40,000. That instrument was still in use until a few years ago, to calibrate the calibration gases in use everywhere…
Hi Ferdinand and welcome to the talkshop. I’m pretty familiar with your mostly very consistent pattern of arguments so I’ll wait to see what others want to add here. I’m just going to challenge you on this for now:
You said:
“On cause and effect: I don’t think that increasing CO2 levels in the atmosphere cause human emissions, thus in this case it is the other way out.”
You are not accounting for possible changes in ocean surface biology which might make a big difference here. The warm phase of the PDO from 1976 was accompanied by falling fishstocks, indicating scarcity at the base of their foodchain, as well as overfishing in some species. I anticipate plankton will make a big recovery in the coming decade, and co2 levels will start to stabilise.
.
tallbloke says:
July 13, 2011 at 3:07 pm
Hi Talbloke, thanks for the welcome!
Any change in any part of the natural cycle results in changes of the sink capacity of the oceans and/or vegetation growth. The net result of all these changes is the difference between what is measured as increase in the atmosphere and what is emitted. That was negative over the past 50+ years. Thus despite any change in one or more natural sources and sinks, nature as a whole was a sink all the time and not responsible for the increase…
Ray Tomes:
I haven’t looked at the data, but your R=0.9995 makes me think that the emissions were backed out of the CO2 data.
Ferdinand Engelbeen:
“TB, I don’t agree with your final conclusion:
“It seems that, contrary to popular wisdom, temperature changes are driving atmospheric CO2 content changes, with a lag time of 6 months.”
In this case popular wisdom is correct. SST changes do modulate atmospheric CO2 content over the short-term, but the magnitude of the effect is negligible (a 1C change in SST causes a change of only 2 ppm in CO2). Ascribing all of the increase in CO2 over the last few decades to increases in SST also gets us into serious difficulties with the carbon balance. More about this at http://wattsupwiththat.com/2009/05/22/a-look-at-human-co2-emissions-vs-ocean-absorption/
TB:
“You are not accounting for possible changes in ocean surface biology which might make a big difference here.” Over the last few decades the oceans have fairly consistently absorbed about 60% of the carbon we humans have emitted despite the large increase in emissions. Maybe there’s some kind of biological balance operating here (more carbon = more carbon-chomping plankton = more carbon chomped)?
General:
I can find nothing seriously wrong with the Mauna Loa atmospheric CO2 record (it matches other CO2 records from places as far away as the South Pole), the carbon emissions data or the SST record. In fact, when you look at the short-term trends they fit together like a jigsaw puzzle.
It was Ray’s conclusion.
I think we are bamboozled by the “popular wisdom”. I didn’t say increasing sst’s were responsible for the increase in co2. The data says the changes in sst precede the changes in co2, but clearly, the co2 increases by more than the sst does. What might the amplification mechanism be? I propose reduction in the plankton population, and I have some corroborating phenomena for that. It’s also clear that increasing human emissions are a part of the picture. BUT. The volume of human emissions is a small fraction of the carbon cycle, and I don’t think we can say with much certainty that we are responsible for x% of the increased atmospheric fraction. I want to see a better range of error proposed.
tallbloke says:
July 13, 2011 at 8:52 pm
“The volume of human emissions is a small fraction of the carbon cycle”
That is the common mistake of many in this discussion. Most of the carbon cycle is an in/out cycle caused by seasonal (temperature) changes within a year, which largely levels out over a year. It doesn’t matter at all how much CO2 cycles in and out the atmosphere, it only matters how much at the end of the cycle the real gain or loss in CO2 mass is. Thus it is completely irrelevant what the fraction of human CO2 in the carbon cycle is. Only the difference between natural sources and sinks matters for comparison with the human emissions.
The amounts of CO2 going in and out within a year are near equal and the difference between ins and outs is well known from the mass balance: change in the atmosphere minus the human contribution, a net loss of about 4 +/- 2 GtC/year nowadays, while the human emissions are around 8 GtC. The variability in CO2 sequestering (and seasonal variation) is surprisingly small, probably because the two largest natural sources and sinks (oceans and vegetation) counteract each other when exposed to temperature variations.
Of the figures, the error range of the emissions may be -0.5 to +1 GtC/year, because of uncertainties in fuel use, especially in some countries (China), but with a higher chance of underestimating than overestimating real emissions. The accuracy of the measurements of atmospheric CO2 levels is within +/- 0.4 GtC.
Based on the past 160 years, temperature may have given a small contribution of about 5 ppmv, the rest of the about 100+ ppmv increase is from human emissions…
Ferdinand, you point about differences is important I think. Also, I looked again at that correlation and it “only” gave 0.9990 now. Weird, I must have done something different. Part of the trouble is that both are rising trends – the old teachers salaries and beer consumption correlation effect.
Ray Tomes,
I have had this discussion already several times, with several sceptics. Sometimes I think that the wish to prove that AGW is wrong makes it difficult to make a differentiation between what is (more or less) scientifically proven and/or plausible and what isn’t (the real influence of the increase). Indeed if the increase of CO2 in the atmosphere is not man-made, then humans can’t be the cause of the recent warming.
But it is pretty sure that humans are the cause of the increase. I have made a comprehensive page where all arguments are combined:
http://www.ferdinand-engelbeen.be/klimaat/co2_measurements.html
Human emissions as cause of the increase fits with all observations. Every alternative explanation I have heard of, fails one or more observations…
This was frimly discussed on WUWT some time ago, with hundreds of responses in four contributions:
and
Was contacted by Ken Stewart who has also done a similar analysis to mine:
Ferdinand, you state that “Human emissions as cause of the increase fits with all observations.”. And yet it does not fit with the observation that temperature increase pretty consistently precedes CO2 increase by 6 months, does it? I am not a skeptic. I am an investigator. I let the facts sit as they may. I suggest a way to test this properly. You provide a set of equations that calculate temperature fluctuations based on CO2 changes, and I will do the opposite. Let us see who can get equations that will predict the entire other sequence from the historical one (i.e. only using the past) that is chosen. What do you think?
Ray Tomes says:
July 20, 2011 at 7:57 am
Ray, sorry for the late reply…
If you look at the total increase, d13C, d14C, O2 use,… the emissions fit all observations. If you look at the variability around the increase (as you do by looking at the derivative of the increase), then you see the short term influence of temperature. If you integrate the temperature fluctuations over the past 60 years and the CO2 increase fluctuations, that gives only about 6 ppmv increase for a few tenths of a degree C. Further, add a plot of the year by year emissions and compare the increase in the atmosphere: only 55% show up in the atmosphere…
Nevertheless, here is my formula:
dCO2(atm) = 0.55*dCO2(emissions) + 4*dT
where dCO2 is in ppmv and dT is ppmv/degr.C over any period
For very long period (ice ages, MWP-LIA), the factor 4 increases to 8