


Our Polish friend ‘ren’ is getting frustratd with the language barrier and the fact that I’ve been way too busy on other stuff (PRP and UKIP) to get to grips with what he is trying to tell us about his ideas concerning the effect of cosmic rays on ozone. So far as I can tell he thinks the polar vortex is also influenced by the position of Earth’s magnetic north pole. Please could the readership help untangle his recent comments and contribute to s discussion so he doesn’t feel ignored. A lot of his linked plots are interesting, so please take the time to have a look. I have asked ren to write an article in Polish we can have translated, but I do not know if he has understood the request. Any Polish speakers out there who can help as intermediary? Thanks.
Tallbloke please explain to me why you not interested in serious of meteorologists that the polar vortex is blocked us from Siberia from autumn! After all, in the eyes of is beating. It is the cause severe of winter in the USA from October (snowstorm in South Dakota). I show at a glance:
1 Now the polar vortex a height of 30 km.
2.Now polar vortex height of 17 km.
3 Circulation at 850 hPa.
On the final graphic can be seen as a weak polar vortex “lets” the warm air above the polar circle.
1.http://oi60.tinypic.com/vmsjyw.jpg
2.http://oi60.tinypic.com/jsfrbl.jpg
3.http://oi60.tinypic.com/so4n7d.jpg
A beautifully shows a cosmic rays. 100 hPa.

Do you really can not see what is happening with the polar vortex? After all, it takes all winter.
Submitted on 2014/02/15 at 7:24 am
The current position the polar vortex. 17 km.

Submitted on 2014/02/14 at 1:41 pm
This winter may be more of surprises.
Submitted on 2014/02/14 at 10:59 am
I have difficulties with the translation of scientific works. Maybe, like Bob Weber will find new information. Regards Bob.
Submitted on 2014/02/14 at 10:50 am
Tallbloke seems to me that in the event of changes in solar activity seemingly small changes in parameters can lead to large changes in stratospherze.
Ozone is an unstable gas that can easily be smashed by ionizing radiation. Then you heat energy. This is just an example.
Look at this:
Submitted on 2014/02/14 at 7:45 am
The situation may improve for four days, the vortex will change position.
Submitted on 2014/02/14 at 7:19 am
I do not understand why you do not appreciate the strength of the winter vortex and its effect on the jet stream. After all the jet stream is at the edge of the polar vortex. Not really understand scientists. Changes have always been, but now because of the sun are stronger. Is there really no one sees?
Submitted on 2014/02/14 at 7:11 am
suricat says:
“Tallbloke position of the polar vortex is threatening the UK.”
I don’t believe it. Please supply corroborative evidence ren.
http://earth.nullschool.net/#current/wind/isobaric/70hPa/orthographic=-4.57,72.23,635
You do not have to believe, see and pull out the requests.
Submitted on 2014/02/13 at 7:08 pm
Tallbloke position of the polar vortex is threatening the UK.

Submitted on 2014/02/13 at 9:33 am
Tallbloke in the southern hemisphere is a drop in temperature in the stratosphere and troposphere.
Submitted on 2014/02/12 at 2:11 pm
You can see how big the anomaly polar vortex.
Submitted on 2014/02/12 at 1:59 pm
Tallbloke Jetstreamu forecasts are not favorable.
http://www.netweather.tv/index.cgi?action=jetstream;sess=
Submitted on 2014/02/12 at 1:12 pm
Current weather in North America.

Submitted on 2014/02/12 at 1:03 pm
Anomaly polar vortex began in October, as evidenced by the weather in the U.S.. Jumping solar activity only increased it.
Submitted on 2014/02/12 at 12:50 pm
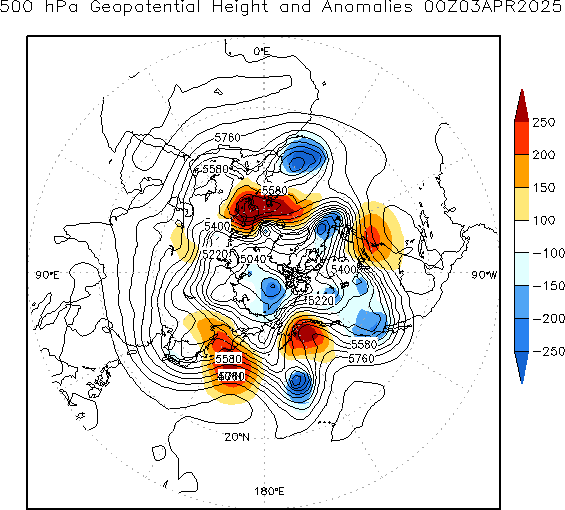
Here you can see the situation at 500 hPa.
Submitted on 2014/02/12 at 12:40 pm
Jetstream depends on the polar vortex.
http://earth.nullschool.net/#current/wind/isobaric/70hPa/orthographic=21.14,73.99,365
http://earth.nullschool.net/#current/wind/isobaric/250hPa/orthographic=21.14,73.99,365
Submitted on 2014/02/12 at 12:33 pm
tallbloke says:
Earth directed Solar flare unleashed last night by the Sun will hit on Valentines day.
http://earth.nullschool.net/#current/wind/isobaric/10hPa/orthographic=21.14,73.99,365
Submitted on 2014/02/12 at 7:39 am
Location lowlands on Feb. 13.
http://earth.nullschool.net/#2014/02/13/0600Z/wind/isobaric/1000hPa/orthographic=2.08,61.23,963

Such was the distribution of cosmic rays during solar minimum in 1996. The largest was over the northern Siberia. You can see that the galactic radiation depends on the Earth’s magnetic field and atmospheric pressure.

The strong decrease in the galactic radiation as a result of a magnetic storm.


Solar magnetic field wears off from 23 cycle.
http://www.solen.info/solar/polarfields/polar.html
Look like this blockade of December 7, 2013.

Polar vortex December 7, 2013. Height of 23 km.

Current distribution of ozone over the Arctic Circle.

So it looks effect of GCR in the atmosphere.

The English language of the article makes reading difficult but there are some very interesting ideas, graphs, diagrams and relationships covered by the article I am sure that Ren is correct in saying that: “This winter may be more of surprises.”
Ren, can you show a comparison of the “distribution of cosmic rays during solar minimum in 1996”
and the distribution of cosmic rays during 2013/2014 on the same link?
The changes shown in the Nullschool earth wind maps really are pretty dramatic.
Poor ren. I speak and write 2 languages which are fairly well correlated but Polish, well that’s another problem all together.
I do find his post, where ever they appear, to be a difficult and confusing read.
With all due respect, Ren’s posts are frequently too far off topic, and too frequent. I do not see it as a translation barrier between English and Polish. Simply posting multiple links to technical information will not engage the attention of readers, especially those with little technical background in the subject matter.
The posts need some comment attached as to why they are important and relevant. I can’t read Polish, but I know Google-translate usually seems to do a reasonable job translating articles from German. I accept translation may become worse as the number of technical terms increases.
A C Osborn says;
Ren, can you show a comparison of the “distribution of cosmic rays during solar minimum in 1996″
and the distribution of cosmic rays during 2013/2014 on the same link?
http://cosmicrays.oulu.fi/webform/query.cgi?startday=01&startmonth=01&startyear=1996&starttime=00%3A00&endday=01&endmonth=01&endyear=1997&endtime=00%3A00&resolution=Automatic+choice&picture=on
http://cosmicrays.oulu.fi/webform/query.cgi?startday=01&startmonth=09&startyear=2013&starttime=00%3A00&endday=17&endmonth=01&endyear=2014&endtime=00%3A00&resolution=Automatic+choice&picture=on
It is in English.
Click to access 1310.7076.pdf
Here too is in English.
Click to access Veretenenko_%20et_all_Geocosmos2012proceedings.pdf
Observations show that large variations in the strength of the stratospheric circulation, appearing first above ∼50 kilometers, descend to the lowermost stratosphere and are followed by anomalous tropospheric weather regimes. During the 60 days after the onset of these events, average surface pressure maps resemble closely the Arctic Oscillation pattern. These stratospheric events also precede shifts in the probability distributions of extreme values of the Arctic and North Atlantic Oscillations, the location of storm tracks, and the local likelihood of mid-latitude storms. Our observations suggest that these stratospheric harbingers may be used as a predictor of tropospheric weather regimes.
Click to access strat_harbingers.pdf
Forecast polar vortex on February 27. 15 km.

ren says: February 17, 2014 at 12:47 pm
Thanks, there appears to be much more variation now than in 1996.
That forecast for the 27th does look a bit ominous for the UK.
A C Osborn says:
That forecast for the 27th does look a bit ominous for the UK.
For Central and Eastern Europe too.
ren’s post is not an article but simply his last 20 comments collated. I simply do not have the time at present to make an article about his ideas. Interpretation will have to be crowdsourced.
Ren calls attention to an interesting connection between the stratosphere and troposphere for forecasting in the Caltech paper.
Tied into this is the following:
There is a 400000 volt differential between the ionosphere and the earth’s surface. This potential is maintained by the ongoing mid tropic thunderstorms but modulated by changes in their number, the tides, changes in the geomagnetic field, changes in the solar magnetic field, the solar wind and cosmic rays.
Is any of this captured in any climate model?
Gaetan Chavalier has written a relatively short compendium on the topic of the earth’s electrical circuit.
Click to access gaetan_electrical_surface.pdf
There is a a lot we don’t know and don’t even measure.
RJ
R J Salvador says: February 17, 2014 at 5:00 pm
And a lot that WAS known and has either been forgotten or deliberately ignored by the mainstream.
A thread of thought that has been teased at on this blog is that gravity and magnetic fields are not as stable as most think and cause changes in air, water and ground movements as well as energy manifestations. Those pictures of the north polar vortex demonstrate pressure gradients caused by the earths’ North magnetic field anomalies. Magnetic lines of flux have flow, down and in at the north and up and out in the south. This causes flow in all matter that they pass through. Remember! EMF causes matter to move. Matter in movement causes EMF. If you have one then you have the other. The air above us as well as the ground below our feet and the waters of the oceans all are effected by changes in the planets’ and Suns’ magnetic fields. Ren is attempting to point out that the polar vortex excursions have magnetic causes. This is a bit of phenomena that I have puzzled over since I first examined Isobaric weather maps 50 years ago. Off of the California coast there is a pressure ridge that behaves most strange to me. High pressure turns to low pressure. Low pressure turns to high as if acted on by a billows pump. Meteorologist claim that the water temperature of the ocean currents below is the cause. I’m not so sure. pg
Ren,
If you know of any Polish web-sites that readers here may be interested in, I’m sure people will be grateful.
Ren highlighted this article a few weeks back. Dated 30/12/14 author, bronek
It can be seen that the temperature distribution on the polar circle is not symmetrical, and since the air swirls in a vortex along the edge of different temperatures, arctic air is directed over North America. This lock is permanent and lasts from October. The area of higher temperature over the North Atlantic while blocking cold air to Europe. I call it a blockade of the stratosphere, which generates extreme weather in the winter in the form of an atypical course and slow down circulation. So over Europe so long maintained air to enter from the south, while, for example, in North America the arctic air flows.
(sorry for long link)
http://translate.googleusercontent.com/translate_c?depth=3&nv=1&rurl=translate.google.com&sl=auto&tl=en&u=http://losyziemi.pl/przyczyny-nietypowego-przebiegu-zimy&usg=ALkJrhgpvJqUmKym9mmvBDY9eemxQ7dPEg
Look at the temperature anomalies in the stratosphere.

Or do you be related to variations solar activity?
My paper “Climate Change and the Earth’s Magnetic Poles, A Possible Connection” is available from my website. It suggests Cosmic rays may play a part
Ren,
Sir, I have not been following your posts until today and I am glad Mr. Tallbloke has been kind enough to sponsor a place for such discussions!
From my studies of solar events, I noticed a pattern that seemed to affect the weather. Your observations are much more distinct than mine but may still be of use in your work.
From the last 3 periods of X-Class solar flares there has been a possible cause and effect relationship with the onset of drought, early season change, and extreme temperature at least as seen here in the midwest of the USA, Cedar Rapids, Iowa vicinity. There seems to be a time lag of 2.5 to 3 months from the flare period to the onset of the weather disturbance. The weather disturbance will last as long as the flare period but does not have to end immediately though it does seem to “right itself” shortly in a linear fashion.
The X-Class flare periods I am defining as a series of back to back flares usually lasting for several hours or a couple of days; not just a fast spike then returning to normal. Preceding the drought of 2012 was an extended period of flares which appeared to play a part in the early season change from Winter to Spring followed by the start of a drought and high temperatures in May. In 2013 there was a shorter period of flares followed by a mid-Summer drought which by itself would not seem like a weather disturbance though it played Hell with the crops. This past Fall a period of flares appeared and offered the possibility of an extremely cold and dry Winter. So far that observation has proven to be on the mark as we are in an “exceptional drought” here and it has been one of the coldest winters on record.
My studies are of data surrounding earthquakes and the rise and fall in quantity and magnitude as the solar cycle went into the minimum and came up to the maximum, solar cycle 23. I presented a paper at the AGU Chapman Conference on the Causes and Consequences of the Extended Solar Minimum Between Solar Cycles 23 and 24 (4CESM).
There were some folks there, especially the Russian and Polish folks, who would be a good resource for you!
Click to access AGU-CC13SM-22.pdf
Feel free to contact me if you would like more information.
Bruce Binion
I see you included one of my queries here Rog:
“suricat says:
“Tallbloke position of the polar vortex is threatening the UK.”
I don’t believe it. Please supply corroborative evidence ren.
http://earth.nullschool.net/#current/wind/isobaric/70hPa/orthographic=-4.57,72.23,635
You do not have to believe, see and pull out the requests.
Submitted on 2014/02/13 at 7:08 pm”.
Sorry if the graphic didn’t make it past Notepad, but thanks for the opportunity of discourse. 😉
ren.
The ‘Polar Vortex’ is but a small region of activity that forms the ‘make up’ of a ‘Polar Climate Cell’. Whilst this region may be an ‘indicator’ to the permitted activity for ‘near surface regions’ within the Cell, ‘The Cell’ (Polar Climate Cell), per se, receives most of its circulatory configuration energy from the force of inertia imparted by ‘regions in close contact with Earth’s surface’ (the Boundary Region), where an ‘accelerative force’ is absorbed ‘by the atmosphere’ ‘from Earth’s rotation’. It’s quite obvious that the rate of insolation modifies this configuration from ‘the top down’, but it’s ‘late’ (~04:00 Zulu local). I need my zeds and I’ll get back soon with a better discourse.
Best regards, Ray.
Bruce Binion thank you for your interest. I’m not a scientist, so I move my subjects, which, perhaps, scientists can not see. For example, this year was a harsh winter in South America and North America. Blockade polar vortex occurred in the south and the north. I see no interest in academics.

You are right that both low and high solar activity affects the weather, and even on human health. See how strong the radiation occurred at the height of air travel immediately after the last outbreak of the X in the sun. This shows that both the stratosphere and the troposphere directly responsive to solar activity.
Operation after a strong explosion of X can be seen fairly short, but the peak is strong can cause permanent effects. Galactic radiation during low cycle runs continuously in the atmosphere. Sincerely ren (Ireneusz).
Clearly visible current distribution of pressure over the Arctic Circle. A strong radiation spike after the outbreak of the X on the Sun (height 15 km).
AC Osborn changing the position of the polar vortex will appear after the February 21.
Changing the position of the polar vortex will appear after the February 21.
Alan Cummings/California Institute of Technology
The Extreme Solar Minimum of Cycle 24: Consequences for Energetic Particle
Populations
We propose a comprehensive study of energetic particle phenomena, taking advantage of
new opportunities enabled by the extended cycle 24 solar minimum, during which the
Sun continues to be at its quietest state in almost a century. This is providing a unique
possibility to probe solar-heliospheric connections in an unexplored ‘ground-state’ of the
Sun. Fortunately, very capable spacecraft, including ACE, Wind, STEREO and Voyager,
are in place to provide comprehensive measurements of H to Fe ions from ~50 keV/nuc
to >500 MeV/nuc.
At high energies (>100 MeV/nuc) the quiet Sun and weakened solar wind have recently
resulted in ‘super-fluxes’ of galactic cosmic rays (GCRs) from H to Fe, with the highest 1-
AU intensities of the space age. These GCR intensities continue to increase, providing a
unique opportunity to explore cosmic-ray access to the inner heliosphere and characterize
a ‘worst-case’ GCR radiation environment that could be experienced by future explorers.
The weakened wind may also lead to record intensities at ~100 AU.
Lower energy (~0.5 to 50 MeV/nuc) anomalous cosmic rays (ACRs) are accelerated at
the boundaries of the heliosphere. Interstellar pickup ions are the main seed population, but others may contribute. A prolonged solar minimum enables ACR abundance studies
at 1 and 100 AU with unprecedented accuracy, providing key tests of their origin.
During the last decade ubiquitous suprathermal tails (10 keV/nuc to MeV/nuc energies)
have been discovered from sources that evolve over the solar cycle. These tails are the
seed particles for solar particle events. During solar minimum, possible origins, including
CIRs, can be tested with minimal confusion from solar events. One species, 3He, is a
signature of small solar flares. Surprisingly, 3He tails continue even with no identifiable
solar energetic particle events. Cycle-24 minimum conditions are ideal for investigating
3He origins.
Finally, the prolonged solar minimum provides new opportunities to investigate the 27-
day intensity modulation of all energetic species that propagate in the solar wind.
We propose a 3-year study to carry out the following tasks:
– Measure the composition, spectra, and dynamical evolution of the ‘super-fluxes’ of
galactic cosmic rays – produce a model ‘worst-case’ GCR radiation environment.
– Compare ACR spectral peaks of species with differing charge-to-mass ratios. Determine
a rigidity-dependent mean-free-pathlength under new conditions.
– Model ACR and GCR transport from >100 AU to 1AU, to understand when and how
particles have greatly increased access to the inner heliosphere.
– Search for ACR enhancements in C, Mg, Si, S and Fe at 1 AU and Voyager. Identify
seed-populations including CIRs, and near-Sun and Kuiper-belt dust interactions.
– Survey the composition and spectra of suprathermal tails during the quietest periods to
identify their sources, including the possible role of remnant CIR-accelerated particles.
– Search for small quiet-time enhancements of 3He to isolate the roles of very small flares
and interplanetary reacceleration.
– Investigate the large 27-day intensity variations observed during the cycle 24 minimum.
These studies will be carried out by a very experienced team of investigators using more
than a dozen state-of-the-art sensors on ACE, Wind, STEREO, and the Voyagers.
To thank Bruce Binion .
This article explains what happens in the stratosphere.
http://theweathercentre.blogspot.com/2014/02/sudden-stratospheric-warming-commences.html
Through the end of September 2008, the sun was “spotless” on 200 days of the year. Not a single sunspot flared up on those days. The Earth’s reaction to this period has been dramatic and directly observed for the first time. In addition to observing the nearly clockwork response to coronal holes opening up on the sun’s surface, SABER has also observed the Earth’s upper atmosphere’s muted response to the sun’s lull – one of its quietest periods in half a century.
SABER, operating since 2002, has been approved for four more years of operation, which should allow for a critical 11-year data set. That would cover the radiative activity of Earth’s upper atmosphere for the entirety of an 11-year solar cycle.
In addition to the “breathing,” the atmosphere’s response to the sun’s sometimes furious, sometimes-quiet activity has surprised Mlynczak in a number of ways.
In the quiet solar year of 2008, for instance, the upper atmosphere’s ultraviolet radiation emissions have dipped to levels 10 times lower than when SABER’s observations began in 2002. At the same time, SABER detects far more short-term changes in solar activity than previously thought.
“It looks noisy,” Mlynczak said. “But it’s not statistical noise, it’s not instrument noise. It’s geophysical noise.”
SABER also spots massive spikes in energy flow that rise and then dissipate quickly. The atmosphere, it turns out, can dump radiation into space extremely efficiently to respond to a burst of solar activity and maintain Earth’s radiation budget.
Kozyra has been fascinated by the role the sun continues to play in Earth’s upper atmosphere even during one of the quietest solar periods in centuries. She expected that this solar minimum would allow for study of how the troposphere influences the rest of the upper atmosphere without solar interference.
“What we actually found was that it didn’t happen. We were seeing the atmosphere was being very strongly driven by the sun,” Kozyra said. “That’s very surprising. We’re learning more about what space weather looks like, and it wasn’t what we thought.”
http://www.nasa.gov/topics/earth/features/AGU-SABER.html
Thanks Ren for these posts! I have much to study on! Some of this fits within what I have seen and the rest requires further inquiry. For instance, the energy that is geophysical is the area that I see in the data of 2008 due to the solar quiet time. It was interesting too because the seismic activity lagged more so than I expected. I am also interested in the dumping of energy due to the exchanges from the ionosphere to Earth’s crust.
Also, Ken McCracken, as mentioned in a post by Gerry Pease, discussed at the AGU Extended Solar Minimum Conference about cosmic rays from outside the heliosphere and their effect over time on the Sun and Earth. He was quite fascinated by residual particles in all sorts of organic material especially that which is known to be before and during the last ice age. He was interested in the tree parts that we typically bring up from the boundary layer of the land before glaciers overran central Illinois here in the USA (find this during well digging). From materials such as these he was able to get a record of past cosmic ray activity.
If you would like a trend of seismic activity through the last solar cycle I would be glad to mail it or post it somewhere.
Hi ren, let me add to my post of “suricat says: February 18, 2014 at 3:51 am”.
“The ‘Polar Vortex’ is but a small region of activity that forms the ‘make up’ of a ‘Polar Climate Cell’. Whilst this region may be an ‘indicator’ to the permitted activity for ‘near surface regions’ within the Cell, ‘The Cell’ (Polar Climate Cell), per se, receives most of its circulatory configuration energy from the force of inertia imparted by ‘regions in close contact with Earth’s surface’ (the Boundary Region), where an ‘accelerative force’ is absorbed ‘by the atmosphere’ ‘from Earth’s rotation’. It’s quite obvious that the rate of insolation modifies this configuration from ‘the top down’,”
For the benefit of readers that are unfamiliar with the concept of ‘Climate Cells’, here’s a link that may seem ‘odd’, but illustrates well the ‘definition’ of Climate Cells:
http://destinationofmarvel.blogspot.co.uk/2011/01/climate-atmospheric-circulation.html
The “Rising warm, moist air” is described in both the NH & SH in the first graphic of my link, but is also ‘named’ and described as the “Ferrel cell” in the SH. Both these regions should be consigned with the basic appellation of ‘Ferrel cell’ by default of the basic configuration applied to Earth’s ‘atmospheric circulation’.
Earth’s ‘rotational momentum’ generates a ‘Planar Centrifuge’ (Polar Cell) at Earth’s Poles, and a ‘Radial Centrifuge’ (Hadley Cell) at Earth’s equator. The ‘dead space’ that exists between the Polar and Equatorial regions of the globe belong to the “Ferrel cell”!
The ‘Ferrel cell’ is ~where a ‘Jet Stream’ exhibits!
Surely this is a ‘density’ (inclusion/exclusion) scenario for ‘mixing factors’?
Best regards, Ray.
Suricat should understand that the activity of the sun is more important for the climate, which has already can be seen officially at least 15 years. If the activity will be low for the next 50 or 60 years! Have you thought about that? Meanwhile, the forecast Vukcevic verified even beyond measure.

ren: Solar activity is likely to be low for the next 50-60 years. See our forecast in Rick Salvador’s paper here: https://tallbloke.wordpress.com/prp-special-issue/
Tallbloke will see the behavior of the polar vortex after long magnetic storm.


So now looks like a vortex at the height of 30 km (10 hPa).
ren says: February 19, 2014 at 6:00 am
“Suricat should understand that the activity of the sun is more important for the climate, which has already can be seen officially at least 15 years.”
ren, if ‘the Sun’ wasn’t there Earth wouldn’t have any ‘climate’, or indeed, ‘atmosphere’ per se. I well understand that Sol’s influence is ‘paramount’ when assessing Earth’s climate, but you didn’t even attempt to answer the question I left you with “Surely this is a ‘density’ (inclusion/exclusion) scenario for ‘mixing factors’?” as to why the ‘jet streams’ actually exist.
Nevertheless, it’s more important to understand the ‘Polar Climate Cell’ as a ‘basic scenario’ before ‘anyone’ can begin to get to grips with the ‘advanced scenarios’ that you offer ‘ad lib’ ren.
A ‘Polar Vortex’ is constrained by ‘planetary rotation’ and ‘modified’ by ‘insolation variance’, but the ‘general public’ (readers of this blog) may not know, or understand, these factors. More ‘explication’ is needed. I don’t ‘necessarily’ disagree with your comments, but, IMHO, they do tend to lack ‘definition’.
BTW. The ‘height’ of the ‘vortex’ alters in accordance with the season. In Summer, it’s high, but in Winter, it’s low. In fact, because of the altitude of landmass at the SH Pole, it’s difficult to separate the strat from the tropo in the Antarctic during the ‘Winter’ period.
Best regards, Ray.
suricat wrote: … but the ‘general public’ (readers of this blog) may not know, or understand, these factors …
And therefore, you do that for me (member of general public), you know that for me, you understand that for me? Would you please refrain from making claims in the name of others.
If you don’t understand, feel free to ask and reveal your own ignorance or sloth, but Not in my name.
Suricat let me I will use my own observations and conclusions.

Meanwhile, the magnetic storm is still ongoing, after the recent CME.
Please remember the actual temperature at 10 hPa. Now you will see growth.
Please see jumps of cosmic radiation.

Please see the circulation of the vortex is “weak”.

Big increase in radiation as a result of solar plasma. The dark area shows the current position of the polar vortex 100 hPa.

ren: Plenty of solar eruptions lately , lots of nice aurora pictures on twitter. 🙂
Quoting NASA (whom else 😉 “For reasons not fully understood by scientists, the weeks around the vernal equinox are prone to Northern Lights.”
It seems that this will be one of the biggest magnetic storms in this cycle.
Chaeremon says: February 20, 2014 at 4:53 am
“suricat wrote: … but the ‘general public’ (readers of this blog) may not know, or understand, these factors …”
OK, I apologise. I should have written “(some readers of this blog)”
“And therefore, you do that for me (member of general public), you know that for me, you understand that for me? Would you please refrain from making claims in the name of others.”
I didn’t. Re-read “may not know, or understand, these factors”. I make no claim for anyone other than myself here and a lot of detail is missing from the claim ren makes for ‘Cosmic Ray’ particle interaction with a Polar Vortex.
TB’s compilation is a bit unfair in that it duplicates the graphic “GDAS-CPC Zonal Temperature Anomaly Time Series 2014”. We can understand the ‘anomaly’ during 2014, but we can’t make any comparison with other years that would/could give weight to a ‘changing’ Cosmic Ray particle interaction influence (I’ve not got to ‘particle influence’ in my dialogue yet). This detail looks to support an expected temp anomaly for ‘a’ Polar Sunrise following the Polar Winter. However, This detail follows the SH, whereas ALL other detail follows the NH. Intriguing. 😉
“If you don’t understand, feel free to ask and reveal your own ignorance or sloth, but Not in my name.”
That’s a bit harsh. 😦
Ray.
ren says: February 20, 2014 at 7:03 am
“Suricat let me I will use my own observations and conclusions.”
Fine. Show me.
“Meanwhile, the magnetic storm is still ongoing, after the recent CME.”
A “CME” (‘Coronal Mass Ejection’ from, in this instance, Sol) is where a ‘Star’ ejects ‘mass’ in an ‘ionic medium’ of ‘matter’ (plasma). The ‘CME’ interferes with the normal/expected EM field by way of its kinetic velocity within the EM field and the ‘charge’ that it represents (this IS ‘particle physics’).
“Please remember the actual temperature at 10 hPa. Now you will see growth.
http://oi62.tinypic.com/2wox8gz.jpg”
ren. This shows ‘diddly squat’. What am I expected to make of this? 🙂
I’ll get to later posts later. For now, I need zeds.
Best regards Ray.
suricat, you demand to ‘Re-read’ is as harsh as my intentionally friendly slap, Okay?
As expected, an increase in solar activity has caused drop in temperature in the stratosphere and the troposphere above the Arctic Circle. Does polar vortex also will accelerate?

Tallbloke this is my complemented article. You can use the the LANGUAGE.
http://losyziemi.pl/jak-doszlo-do-blokady-wiru-polarnego-2
You can already see the temperature drop at a height of 30 km.

ren says: February 22, 2014 at 3:01 pm
Thanks ren. At last something that I can understand. I’ll digest this article (How did the polar vortex lock) and get back to you. 🙂
Best regards, Ray.
ren. Thanks for this conundrum, it’s really got me thinking and now I realise that Sol ejects ‘neutrons’, as well as protons and electrons during a ‘Solar flare event’.
http://iopscience.iop.org/0004-637X/592/1/590/fulltext/56207.text.html
Please see that link for a paper on “Solar Neutron Event in Association with a Large Solar Flare”.
‘IMHO’ (In My Honest/Humble Opinion), the “Oulu Neutron Monitor” graphic is too ‘peaky’ to represent Cosmic Ray Particles (CRPs are more attenuated by Sol’s ‘wind’ and rise and fall ‘slowly’ in ‘amplitude’), it looks more like a product of multiple ‘CME’ (Coronal Mass Ejection) events (neutrons emitted during Solar Flare events). Corroborative data is needed on the ‘temporal’ subject of ‘Solar Flares’ to validate this observation IMHO, though it does seem valid.
The coincidence of the events recorded in the data from that monitor coincides with the “GDAS-CPC Zonal Temperature Anomaly Time Series”, thus, shows ‘correlation’.
However, This ‘correlation’ seems to relate more to Sol’s ‘particle emission/absorption’ and NOT ‘Cosmic Ray Particle’ absorption. Nevertheless, there is always a ‘background’ of ‘seasonally changing’ EM radiation which can only serve to confuse the data. This needs to be addressed.
Don’t forget that the ‘effective’ height of the Polar Vortex alters with season and reconfigures itself with percentage of local insolation during a 24hr period. More to this, the inclusion of ‘WV’ (Water Vapour) alters local density and renders this system ‘chaotic’.
I think that any realistic ‘forecast’ must come from the ‘Strat’ where systems are less chaotic and your observations, though IMHO are misplaced, seem more valid.
These are my primary conclusions following a ‘first reading’ of your article.
I await your response. 🙂
Best regards, Ray.