


An often appearing name in the BBC news as the hottest place in the country is Gravesend but the true location of the Met Office thermometer is a mystery. By chance I followed up today and discovered a new snippet of information.

Figure 1
Note: this is not a formal international climatic station but the data is distributed around the world, such as station 8 hour data.
Above is from Google Earth, reader DP looked via MS Bing and a web browser, good view here. (opens in new window)
“2003: Britain swelters in record heat
Britain has recorded its hottest day ever as the temperature soared to 38.1C (100.6F) in Gravesend, Kent.
The record has actually been broken twice today. The first place to beat the previous record of 37.1C (98.8F), set in Cheltenham in 1990, was Heathrow Airport where the temperature earlier today registered 37.9C (100.2F).
Then an even higher temperature was recorded in Kent, making today the hottest day since records began about 130 years ago in 1875.”
[NOTE: THIS SITE HAS EXISTED SINCE 1995 AND IS ONLY JUST IN KENT]
http://news.bbc.co.uk/onthisday/hi/dates/stories/august/10/newsid_3910000/3910801.stm
A few years ago I spent some time with others finding stations. Gravesend was one of those mystery stations, couldn’t find it.
Some time ago during very detailed web search I came across a reference to this station on a UK weather discussion group. Someone had asked if anyone knew the station location? The few replies mostly said we don’t know but one said he thought it was co-located at a a Port of London transmitter site some distance from Gravesend.
I eventually via Google/MS imaging found a white box but no sign of other instruments, no standard issue Met Office site. Met Office have lots of odd minor sites, mostly rain gauges. (suspect it is thousands all told)
I marked it as unconfirmed but it worried me.
Few days ago a brief search produced an incidental reference to this station from a Met Office help file to do with their paid for access to data. The Met Office (to be fair same elsewhere in the world) are rarely capable of getting lat/long accurate, checked many where I know the answer, none are accurate.
Location id=”3784″ latitude=”51.464″ longitude=”0.314″ name=”Gravesend-Broadness”
This is 187 metres from my best guess. Doesn’t prove it, still looks a strange place to put a Stevenson screen but is logical, government land, power and comms present. I doubt the transmitter generates much heat, is marine comms.
Is there UHI?
This is a superficially rural area, a very strange location so lets start looking at how strange.
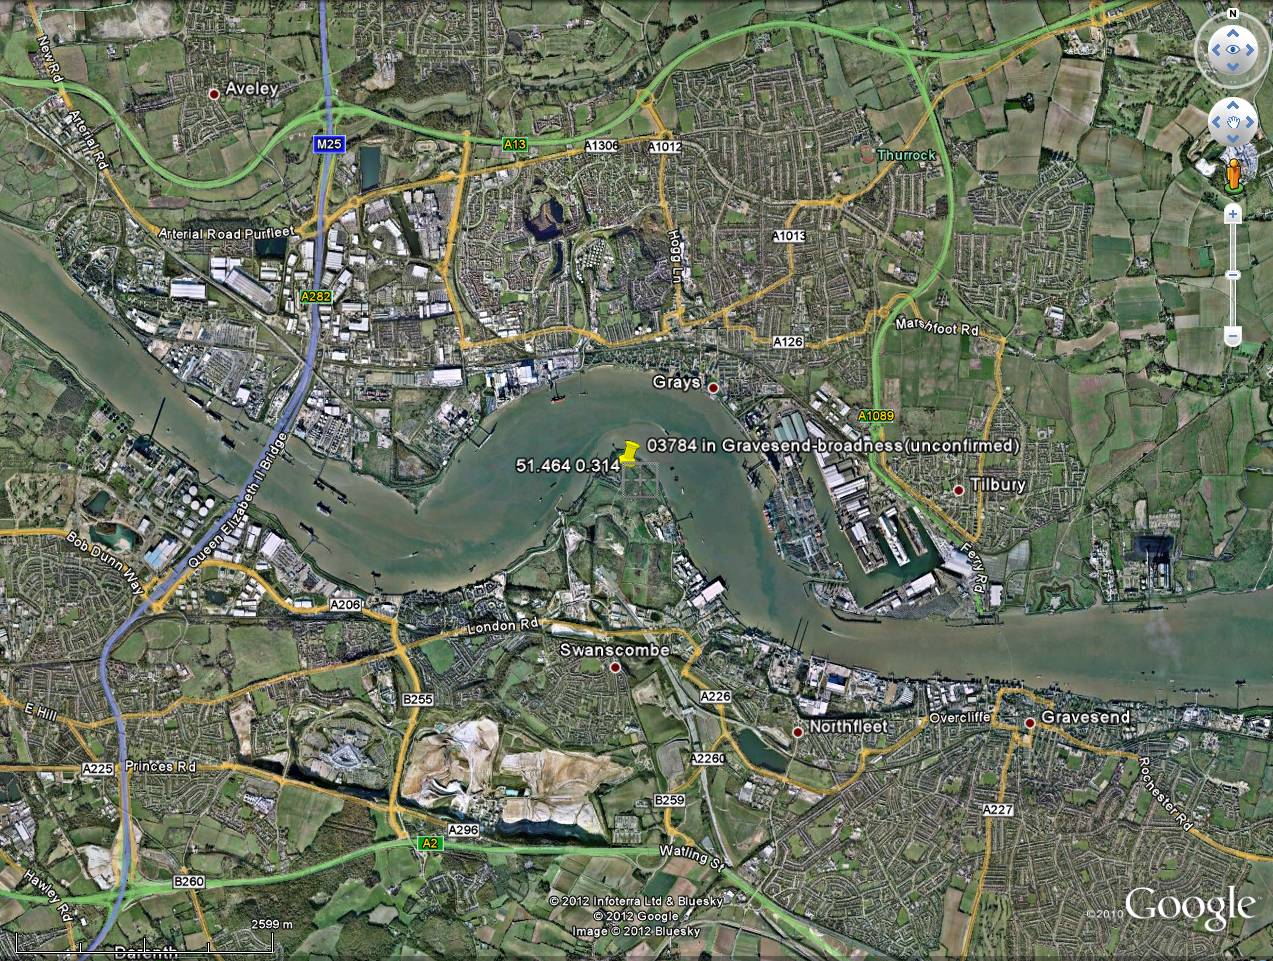
Figure 2
The yellow pin is my guess of the screen location and the target is the Met Office location. If this is correct it is unusually accurate suggesting they are updating the information.
This is east of London, is the tidal lower Thames close to the estuary. It is going to be permanently humid, including any effect from the elevation of the temperature of the Thames, heat from London.
Industrial activity is obvious as is close dense residential.
Go towards London (left) and within 5 km is the non-motorway section of the M25 London orbital “motorway”, blue on the map. This is 8 lanes all told with queues a lot of the time, is a toll road. Queen Elizabeth bridge southbound and the Dartford tunnel northbound. Both expel heat into the air, a bridge and ventilated tunnel. South side to the left of that see the bright circles? Heavy oil storage tanks, river pontoon for fuel delivery tankers. Next across is the RWE Littlebrook power station. Being oil is probably not run continuously, about 1.4GW output and has additional gas turbine generator sets. This will eject circa 2GW of waste heat, up prevailing wind. RWE web page on station, head photo is looking east toward bridge and weather station.
Next to the left is a wee and poo plant, also tends to be warm stuff. I expect the sludge is tankered into the outer estuary for disposal. (used to be the case)
Little Reach Sewage Treatment plant, run by Thames Water. Photo looking west, can see the edge of the power station.
Is that all?
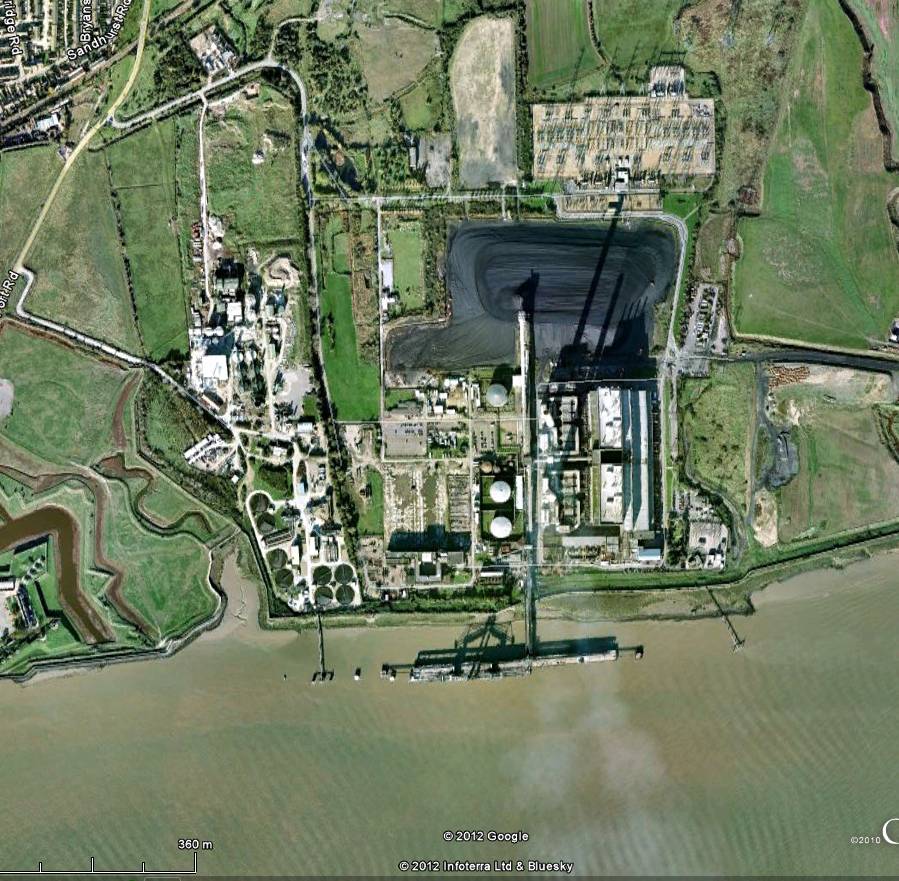
Figure 3
Just off the right of the previous image, north side of the river is… another power station. Top of image here is the electricity output site.
RWE Tilbury Power station, coal fired, hence the pontoon for delivery and black stuff but the RWE web page says the site is being converted. Looks like another 2 to 3GW of waste heat, east winter winds or blocking highs have this one upwind. I notice the RWE photo doesn’t want to show much.
Converting to biomass? I bet the conversion efficiency is lower than conventional fuels, therefore even more waste heat.
There are other power stations a little further away, at least two major ones to the east. (there because of the river, coal delivery)
All this sparkery, I’ve not reached the end yet.
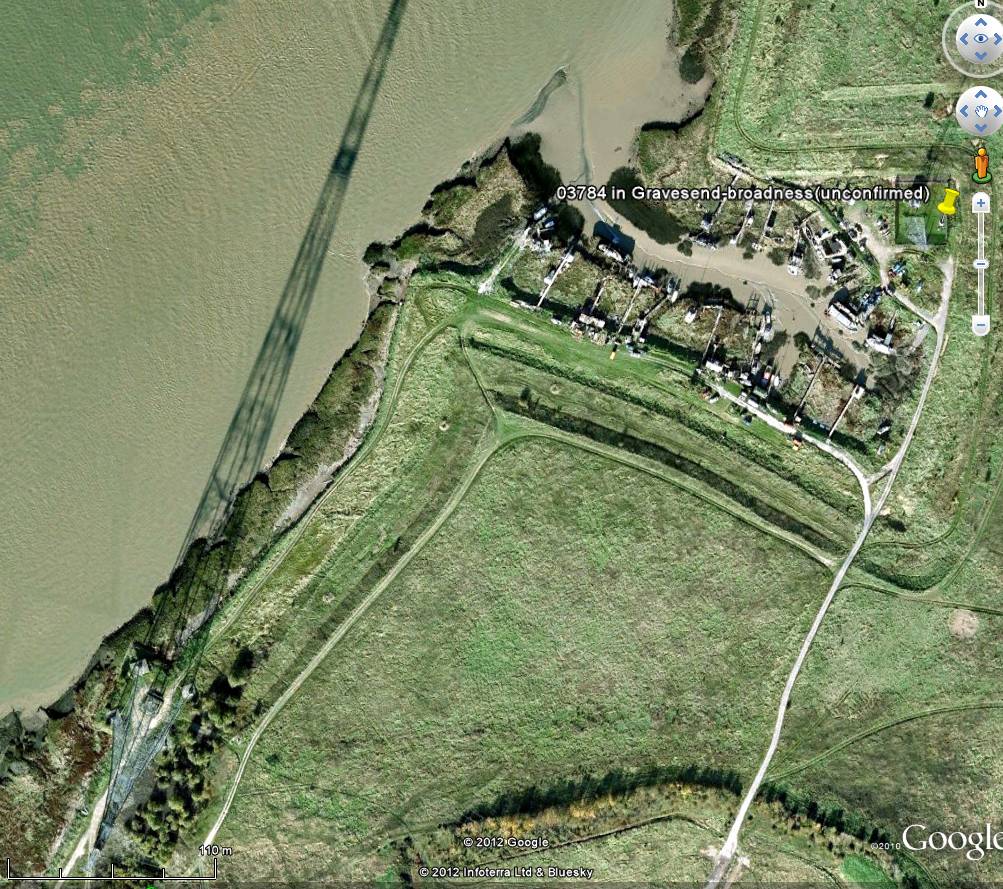
Figure 4
So what is that? Met site is top right. Four piles at the base, is a large power grid pylon, can look bizarre from an aircraft (these are aerial photos, not satellite).
Electricity transmission is not 100% efficient, the lines get hot, are a compromise. Actual lines are aluminium with a steel core. The alignment, this is a river crossing.
Other side are several sites

Figure 5
One of the “farms”. There are underground high voltage cables and river crossings as well.
Street view on that road
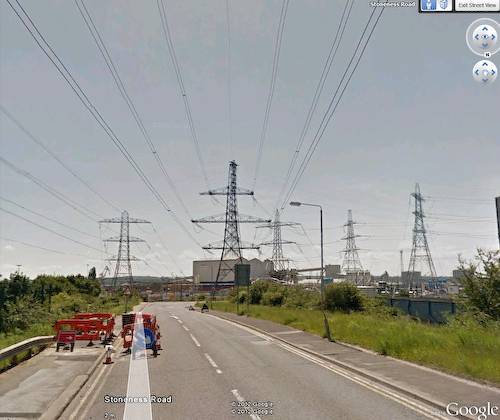
Figure 6
All? Ho ho.
A major electric rail tunnel (high speed to channel I think) passes 750m to the south-west (with tunnel ventilation outlets). There is another line to the south, another north side of river.
I repeat, this is not an international climatic station.
http://news.bbc.co.uk/1/hi/uk/3138865.stm
http://news.bbc.co.uk/1/hi/england/kent/3153532.stm
Record UK temperature for October set at 29.9C
http://www.bbc.co.uk/news/uk-15137832
http://www.bbc.co.uk/blogs/paulhudson/2011/06/
It just goes on and on try this search gravesend hottest site:bbc.co.uk
However The Met Office are today more serious about matters and point out this
“Gravesend-Broadness (Kent) 38.1 New station record, but data records only back to 1995.” — http://www.metoffice.gov.uk/climate/uk/interesting/aug03maxtemps.html
Which puts a much better context on things. Note the BBC item I quoted near the top of the whole article… not true because it conflates Kent record with a station which did not exist in 1875. There again who told the BBC about the temperatures? This is pushing honesty in my view past breaking point, barely in Kent either.
Look at the map, this station would more sensibly be named Tilbury which is much closer than Gravesend, one snag though from the Met Office point of view, is in Essex, not Kent, both are near as dammit to Middlesex (London).
So is this station stupid hot? I doubt it but slightly elevated over a more rational siting outside of frenetic human areas.
Distributed data?
Example.
Synodic data, look for “SMUK43 EGRR” where EGRR is Exeter, ie. Met Office. Example is CODE FM 12-IX SYNOP format. Is an AWS so there isn’t much data.
Hand decode of a data line, dodgy one, should be for 16th August 2012
PDF of codes atmo.tamu.edu/class/atmo251/LandSynopticCode.pdf
03784 46/// /2012 10223 20136 30149 40153 51004 91150=
03 is UK, 784 the WMO ID used.
Can’t figure date/time, missing data
Same precipitation and type of station, no rain data makes sense
10223 temperature +22.3C
20136 dewpoint +13.6
30149 pressure 1014.9hP
40153 sea level pressure 1015.3hP
51004 pressure varying, not rising as fast, +0.4hP
91150 Ah, is a strange time code, 11:50hrs

Figure 7
Something is wrong, must be a time offset but can never figure which way is BST. Plot is from
http://www.metoffice.gov.uk/weather/uk/se/gravesend_latest_weather_graphs.html
I was too late to grab tabular. (those in the US, call it back? Met Office, there is no archive unless you pay them or they want to push it at you, why jumping through hoops is necessary, Wunderground have METAR data if there is anything for this station)
Comment
Mentioning record temperature is at least sharp practice and doing this without being very up front with the honest context is dishonest. Endemic problem in public life.
There are no international climatic stations in the area which is a strong implication the Met Office know there are major station problems. However http://www.nws.noaa.gov/dm-cgi-bin/nsd_lookup.pl?station=03784
Looks to me like trying to find a very hot location.
[update]
Just discovered more sharp practice by the Met Office. To me this stinks.
WMO 03784 GRAVESEND, BROADNESS SAMOS NCM KENT 51467 300 3 OS 5606 1764 15 9 1995 31 12 9999 ZZ99LH
Date station opened 1995 31 12, 31st December 1995
Honesty would state 1996.
http://badc.nerc.ac.uk/data/surface/station_lists/midas_stations.html [/update]
Backlink surface stations project
Posted by co-moderator

I wonder how much heat rolls off the mudflats when the tide is low. What might be the prevailing wind direction?
http://binged.it/PwlyRn for us Google-free zones
This is very interesting. It does sound like a ploy to add weight to the warming story. I have a clear recollection of that ‘record breaking’ day. I was smashing up reinforced concrete all day. I felt hot but no hotter than on many a previous summer’s day when doing less strenuous work. I was truly astounded when I arrived home to hear the news. I just didn’t believe it and put it down as a fluke at a single station. Turns out, it was.
Excellent post Tim.
DP: Prevailing would be from London just along the river Thames to the West.
dp,
Mudflats, very humid, if sunny and the tide rolls in on warm mud, yet more. The actual effect? Someone surely has researched this?
On the other hand extreme cold and hot usually occur with dessicated dry air, humidity normally moderating temperature.
Temperature is a proxy for entropy (choose right definition) hence the thermal mass variation with water content is critical.
The (other side) west of England is Atlantic maritime with normal weather from the south-west and west.
Gravesend is east side where the prevailing weather is attenuated, also why it is dry, in rain shadow. There is more of a tendency to pick up weather streams from south near continental Europe, east, North Sea and Scandinavia, Arctic the channel between Scotland and Norway.
The notorious “blocking highs” we get mostly summer or winter when the prevailing flow from the Atlantic is shut out, gives the snow, cold, heat waves, drought most concentrated in the south-east. Kent and East Anglia get it worst.
Gravesend is going to get local topography channelling looks like gets it every which way of exposure to human development. (as Tallbloke wrote)
I apologise for only using Google (who I hate) and I admit to forgetting to check out what MS were showing. I’ll add a link for others, thanks. [done on front page]
Why should it be necessary to pinpoint the site on Google etc.?
This is surely not a state secret and I feel that the location such sites should be openly available.
Wierd. I used to live less than a mile from there; Greenhithe is the nearest conurbation and the marsh is on the greenhithe/swanscombe border. [some info in swanscombe btw: http://en.wikipedia.org/wiki/Swanscombe%5D.
I’ve got some pics from the marsh somewhere, pre-digital days so I’d have to trawl through some dusty boxes.
http://en.wikipedia.org/wiki/Greenhithe
Well done investigation. It may be that the station is affected by heated water discharge from the power plant and the sewage plant into the river. Being on that spit of land it has water on three sides.
I’d ask the plant operates what the temperature of the water discharge is, then look for a reading upstream for water temperature, say from a hydrological monitoring station. Or, just go there and sample the water temperatures yourself. – Anthony
Here from Bing Maps is a much more closeup view of the station, taken from airplane. Sure looks like a Stevenson Screen to me. http://binged.it/N5z7rg
Note the marine radar antenna. Check for vents on that equipment building and prevailing winds that day. I’m betting wind direction is a factor in the highs. This station really needs an on-site visit and photo survey along with data analysis.
Following up on Anthony’s comments, I have been digging a little, using Tim’s links. The Littlebrook power station just to the west of the QE Bridge does discharge warm water from its condenser into the Thames. The intake and outflow are the two circles in the Thames, visible in the Bing ariel view if you scroll left. The PDF document on the site that Tim linked says:
“The condensate is pumped back to the boiler for reuse and the cooling water [i.e. now warm water] is returned to the river.”
This must be several hundred megawatts at least, given the fact that it is cooling something approaching 800kg of condensate per second at full operating capacity. This would be in addition to the heat lost up the chimney during oil combustion which may or may not drift over the station in question. What is certain is that a large portion of the condenser outflow ends up bathing the station on three sides. Even if there is some convective/turbulent mixing, the mixed water will retain this heat energy quite well at or near the surface albeit as lower grade heat. Since water has a specific heat capacity four times that of air and the mass of air directly above the Thames is much less than the now-mixed surface layer, it means that the water surface can heat the air above it to the same temperature without dropping in temperature itself, or at least by a negligible amount. This amounts to a very reliable, permanently elevated heating source, one which is likely to be elevated further when the power station cranks up in the evening….I noticed that Thursdays temperature graph for Gravesend showed an anomalous rise at 6PM. I was waiting for today’s 6PM update to see if it happened again but as of starting this comment it hadn’t come through. It might warrant monitoring over the next few weeks or months- though tides will dull or enhance the effect I should think.
That’s a crazy site for a weather station. Those transmitters have power cabs at ground level sucking in ambient air and pumping out heated air. As you say it’s not an international station but why put it there in the 1st place and why not issue a health with the results?
Odd though from my limited experience of Met office reporting sites they have never been anything but meticulous.
Excellent work, take it further.
Anthony, thanks for your interest and the Bing aerial view. I think simultaneous temperature readings of the Thames from both sides of London would be worth taking.
Scute,
Hundreds of MW, probably upper, however, oil is an unusual fuel so I suspect this is peak times only. They mention gas plant but seem to casually throw this in without detail. Presumably a similar power and the thermal efficiency is a little better.
More subtly, I mentioned this is lower reaches, the Thames is a small river with low flow: it is tidal.
For this reason any cooling outfall from the station nominally downstream will flow back upstream… and cooling upstream will stagnate in a pool of water.
Goodness knows the effect, for all I know, none.
There is a vast amount of data on the lower Thames.
Click to access BAUGH_Data_Rich_Estuary.pdf
Tide.
and
Temperature
Table 3
Water ought to be a moderating influence and even pooling water ought not to affect peak maximum temperatures, the only political issue, not climatic although cynically, it will get used.
“The tidal excursion on the Thames, or movement up and down stream by a discrete body of
water, is predominantly affected by the flow over Teddington weir, treated effluent discharged
to the river and the ebb and flood of the tide. Water travelling downstream on an ebb tide will
travel approximately 14 – 15 kilometres, but will return upstream on the following flood-tide, to
a point as close as 1-2 km downstream of its start on the previous tide. This tidal excursion
results in a potential average time for water to travel from Teddington to the sea of between 3
weeks and 3 months (depending on the volume of water flowing over Teddington Weir). ”
http://www.hpa.org.uk/webc/HPAwebFile/HPAweb_C/1194947405865
Places along the sea and large rivers are suppose to be cooler, but this area appears to be a frequent exception.
Sheerness, Southend on sea and Gillingham are also often quoted on local records on weather reports in SE England’s summer days.
It may be some kind of natural path created by the Thames’ estuary funneling warm air from continent, which in the summer months is usually much warmer.
Sheerness, Southend on sea and Gillingham are also often quoted as records on the local weather reports in SE England’s summer days.
Interesting Satellite Infrared image shows that area to be one of the warmest, even exceeding London.
http://geology.com/world-cities/london-united-kingdom.jpg[ http://geology.com/world-cities/london-united-kingdom.shtml ]
[ Seems Geology are touchy on copyright and insist on link to web page.
You are being helpful Anthony, thank you. There is plenty more I have stacked up but putting things so they interest other people is not so easy. –Tim]
Here’s a very nearby weather station. Grays Essex which looks to be about 3km away. http://www.wunderground.com/weatherstation/WXDailyHistory.asp?ID=IESSEXGR2&day=17&month=08&year=2012
Although it does not have data for 2003, it dies go back to 2008….you may be able to correlate with some other dates of the Gravesend station making high temperature appearances in the BBC.
Admit I don’t usually look at private weather stations. This one is said to be
http://www.heavyweather.info/english_uk/english_uk_2300.html
The snag is no Met Office data. This could be painfully done over the next few months by collecting live data, would need coding up. A lot of work.
METAR is quantised to whole degrees only, still needs coding up. (there is no normal archive, went through that with the Heathrow exercise)
Aside information: an often useful resource is
http://weather.gladstonefamily.net/site/03784 (showing as I show because I reported it)
In this case doesn’t show the Grays private site but does have click to nearby.
This does give some data but (like wunderground) tends to have missing timeslots.
I looked at this problem yesterday but concluded I should publish and move on to more important articles which are pending, not expecting much interest. Wrong again. 🙂
Yesterday I did a little bit of a sanity check. The maximum which the only Political figure is <1C, not huge. The amount of information is too large for a comment, it is easier to do a new article. Will think about what to do.
Another factor to consider is that Gravesend is in the lee of the North Downs and enjoys a much drier micro-climate than the rest of the South East. If a warm moist continental wind was coming up from the south it could be adiabatic compression which pushed temperature to the record observed on 10 August 2003
Don’t know where to find the info needed to see if this is a possibility?
Just few miles down the river Whitstable Marina has live updates
every 10 sec
http://www.whitstablemarine.co.uk/weather.asp
The Bing Link cracked it for me. It was obvious looking at the shadows that the weather station, transmitter and radar tower were sat on a level depression protected on three sides by banking ie they had their own micro climate.
I then selected Ordnance survey mapping and confirmed that this was indeed a place with a micro climate as the banks are clearly marked on the OS map. But it gave one other vital piece information, the location is Broadness Salt Marsh.
Just a few steps later and a Google of Broadness Salt Marsh and I had the picture and all the information required to see that this weather station is a dud. Note the banking, brick power building with ventilation equipment and the weather station.
The Met Office should hang their heads in shame and also the BBC for reporting the temperatures recorded by this station. Well done chaps I hope you can get the message out to the wider world. If anyone lives in that area the site looks easily accessible.
Here is a link to the source of the photograph that Wiki used.
© Copyright Glyn Baker and licensed for reuse under this Creative Commons Licence
http://www.geograph.org.uk/photo/48941
Fantastic Caz, this is what many brains can do. Nicely the photo has a good copyright.
What the image folks didn’t know is the significance of the box.
From my point of view this is a relief because it is all too easy to get caught declaring know a Met site when it isn’t. Only one red face but that was private, just that I was pretty sure until ground level mapping appeared.
I’ll update the article and maybe do a new article.
From the Met Office’s own site.
Ideal site
Level ground.
No trees; buildings, or steep ground nearby that might influence the measurements.
Undesirable site
Warming effect of buildings on the measurement of temperature
Sheltering or shading effects of trees on the measurement of sunshine and wind.
Frost hollow where overnight temperatures on still clear nights may be far lower than at neighbouring locations.
Top of a hill or steep escarpment where winds will be unrepresentative of the wider area
http://www.metoffice.gov.uk/learning/science/first-steps/observations/weather-stations
[mod added: Link to ordinance survey detail map which shows the embankment, possibly part of flood defences –Tim]
Tenuc, not sure if this helps?
850hpa

500hPa

This is the mainpage. Goes back to 1881
http://www.wetterzentrale.de/topkarten/fsreaeur.html
Caz, Brilliant!
I knew once I saw the Bing aerial view there was a screen there. Good on you for following the trail further.
New observational truism of the atmosphere:
If tornadoes are seen to be drawn to trailer parks…
…then temperature stations are drawn to air conditioners.
Here you can see live 6 day data output for the station
http://www.weathercast.co.uk/world-weather/weather-stations/obsid/3784.html
Excellent work everyone. Tim and I will do an update with Caz’ photo find and some extra info on nearby stations, and a couple more “hottest evva!” quotes from the BBC. 🙂
Hopefully Anthony might like to give it some wider exposure.
Temperature stations are also drawn to jet exhausts Anthony. Scroll down to Measurement of Air Temperature in this document produced by the Met Office.
Click to access factsheet17.pdf
I noticed a small fly in the ointment yesterday but didn’t want to confuse matters because it doesnt detract from the main thrust which is that this weather station is poorly sited and possibly disingenuously so.
When I clicked on Tim’s link to the aug03 temperatures and scrolled down to August 10th, the station at the top of the list (highest temperature for that day) was Brogdale, near faversham, Kent. This is not all that far from Gravesend/Tibury and on the south side of the estuary too. The mention of this station and temperature is most intriguing to me because I am sure that the BBC article is referring to the Gravesend site and its temperature of 38.1. You can tell from the wording later in the article- and anyway, I remember on that day Qthat it had just scraped over the 100F mark, not 101.4 (38.5C). There was no mention of Brogdale. It can’t have been recorded much later in the day, being a record.
Anthony mentioned correlating Gravesend with temperatures at Grays presumably in order to see if there is a chronic anomaly. This temperature of 38.5C at Brogdale on the same record breaking day of August 10th suggests that the Gravesend temperature that day wasn’t unduly high compared with other temperatures in the vicinity.
I don’t like muddy pictures but seeing as we are quick to catch others missing countervailing evidence, I have tossed it in here. As I say, it doesn’t change the main argument. It is just one piece of contrary evidence.
I would really like to know why everyone has been talking about a 38.1C record instead of a 38.5C record for the last 9 years. Maybe that just shows the power of one article on a big network to induce Groupthink.
Scute, On the contrary, if this is wrong I want to know.
Writing at length is wrong right here.
I’m working on things, there is a data source. There is also a lot to bring in in the wider context.
The Met Office are notorious for dragging out minor sites. If I explain the whole thing it would take a lot of time and space.
Click, got it first time.
Government agricultural station, always have some kind of met records.
http://www.brogdale.org/
A quick look, I can’t spot the screen [maybe see below]. Experience tell me these can be difficult and some move around over time. Been some bother over these in the middle of crops. (at least stubble burning has ceased)
Anyone wanting the look, it has it’s own postcode. ME13 8ZX
Just below the M2 (motorway). Lots of fields and croppings.
51.296991° 0.877894°
MS via browser
Looks feasible but is this where staff used to trudge out every day of the year to take readings?
“Brogdale is well situated for this monitoring role, having recorded the highest temperature seen in Britain of 38.3 degrees Celsius in 2003.”
http://news.bbc.co.uk/1/hi/business/5242788.stm
Okay, lets see the proper met station?
Note the wording the BBC use. This strikes me as someone knowing this is a bit close to the knuckle. Highest recorded but not record. Why? Or is that the highest during 2003?
My English is not very good when it comes to between the lines..
Brogdale weather station. Sheltered by a Leylandii hedge, It’s not a Met office Synoptic station anyway.
I’m writing up a large post. Check WUWT soon. Anybody know how to find the time the high temperature was recorded at Gravesend on 8-10-2003? News reports say late afternoon, but no time given. Met Office is as usual, useless for finding such data.
It would be poliite to allow TB & Tim to post their follow up first Anthony. Could not believe what a gift that photo was when I first unearthed it. But the spark was TB’s blog and his mod.
[…] at Tallbloke’s Talkshop, moderator Tim Channon wondered about this regularly hot station reported in the news: An often appearing name in the BBC news as the hottest place in the country […]
Ah too late, besides TB already hinted “Hopefully Anthony might like to give it some wider exposure.” which I have done.
Brogdale ought to be 10 . (47-4)/1000 = 0.4C cooler from lapse rate but in summer inland temperatures are higher, opposite in winter.
Time? Working on this. Getting high res data.via CGI out of a server is fun. (completely legal stuff, just that the query is irregular)
[deleted]
Still working on this.
[edit: We need to be careful over USA vs. UK numeric dates! 10th of 8th month. Such august company we keep. –Tim]
Looks like there could be a new kid on the block at Brogdale farm…
http://www.fastltd.co.uk/LiveWeather.html
At least it looks like this one is sited in open fields.
You can’t rely on Brogdale college for record data. It all depends on how the “duty” student recorded the max temp. Parallax error makes a big difference as does attention to detail. The data from this site does not count in the statistics books and for good reason.
At the end of the day the temperatures recorded at Brogdale are no more official than what you or I record in our Stevenson Screens.
tchannon says:
August 18, 2012 at 11:26 pm
That list of temps and times is Brogdale or Gravesend?
Very interesting. The mud flats issue prompted me to do a (very rough) correlation of temperature (logged by me), wind direction (60% probability of positive for the time selected) & tide level (BoM) here at 19.192847 S, 146.677684 E. Yep – looks like the 1000+m of flats makes a difference.
Noticing the use of Bing maps as well as GE. Here the Bing images are slightly more recent, resolution is lower, but, apart from being one house out, Bing knows the address … hmmm …
Caz (august 18th 11:51)
I agree, that data shouldn’t be bandied around as official and yet, not being content with 38.1C at Gravesend, the Met office has still decided to slip Brogdale into first place on its ‘August 2003 Hot Spell’ page (Tim’s link).
The accuracy of the Brogdale reading is already called into question by the fact that it is cited as 38.5 on the ‘Hot Spell’ page, yet is cited as 38.3 in the BBC article linked by Tim (this time in Tim’s comment).
So, would it be too much of a stretch to conjecture that some semi-hung-over student slogged out to that remote field in that punishing Sunday afternoon heat of August 10th, oblivious to the weight of history that was about to be thrust upon him? No pressure then.
Gravesend
10/08 00:50 18.8
10/08 01:50 17.9
10/08 02:50 17.7
10/08 03:50 17.6
10/08 04:50 16.4
10/08 05:50 na
10/08 06:50 21.4
10/08 07:50 26.4
10/08 08:50 29.8
10/08 09:50 31.2
10/08 10:50 33.1
10/08 11:50 36.3
10/08 12:50 37.4
10/08 13:50 37.4
10/08 14:50 37.4
10/08 15:50 36.3
10/08 16:50 33
10/08 17:50 29
10/08 18:50 27.9
10/08 19:50 25.5
10/08 20:50 23.4
10/08 21:50 21.5
10/08 22:50 20.5
10/08 23:50 20.1
From this
AAXX 10154 03784 42968 01709 10374 20121 30149 40155 56005 91450=
time 14:50
1 record, 0 means + 37.4C
(see PDF I referenced in article)
More Info about the doubts around Brogdale. Check out the photo, there were even dark stone chippings dumped around it at that time. Not forgetting the Leylandii hedge. This was an artificial hot spot waiting to happen. We could all create a new record if we relocated our Stevenson screens into such locations
http://onlinelibrary.wiley.com/doi/10.1256/wea.10.04B/pdf
Brogdale weather station. Sheltered by a Leylandii hedge, It’s not a Met office Synoptic station anyway.
Someone’s stolen the door off the thunder-box …
Mosh, yup, that’s one big blob of warmth just upwind of the station.
Brogdale also has the problem all the carbon dioxide from the Sheperd Neame brewery at Faversham to allow for. Some research needed probably. The Hop Festival in a fortnight would be a good time.
http://favershamhopfestival.org/
Cross-posted from WUWT for completeness, a discussion of the Brogdale station and record here –
http://www.weather-banter.co.uk/uk-sci-weather-uk-weather/121618-brogdale.html
Final post by Stephen Burt is the most relevant, quoting from his article in ‘Weather’ –
“Conclusions
The results of three separate and independent analyses clearly
demonstrate that the maximum reading of 38.5 ºC obtained at Faversham
on 10 August 2003 is anomalous (approximately 2 degC too high) and
cannot be easily accounted for meteorologically, climatologically, or
statistically. The authors believe that other reasons must be sought
to explain it*, and that ˜The Faversham Maximum™ cannot be regarded as
sufficiently beyond doubt to justify its continued claim to the UK
national temperature record.”
Nigel, excellent suggestion: I’ll bring some hankies to wave.
Chuckles, thanks, spotted that on the WUWT thread. I guess the Lelandii hedges don’t help (cut down wind).
Contributor AJB has kindly supplied hourly data (some dropouts) for the last year at the Broadness station. He’s still working on cleaning up duplicates etc so I’ll post a link to an xls once we’re happy with it. It’s likely raw data so if anyone can get the adjusted to compare it to that would be great.
May not be relevant, but when I read about the power station it reminded me of this nice demonstration by Richard Box of what can be achieved with electrical induction from power cables.
[And what a great title to be “Artist-in-Residence” in a University Physics Department 🙂 ]
Raw data? No.That is the tip of a very large can of worms.
Knife edge diffraction of the infrared by the mast!
http://en.wikipedia.org/wiki/Knife-edge_effect
Here’s the .XLS of the Gravesend data from may ’11 to date
https://tallbloke.files.wordpress.com/2012/08/gravesend.xls
Big thanks to AJB
I’ve located this photo also. What looked to be a sidewalk turned out to be a big chunk of concrete. Heat sink anyone?
This photo is from a Royal Meteorological Society publication, they apparently didn’t want the world to see the other nearby issues related to the radar station.
More on that publication, and how I’ve caught the Met Office in a lie, coming soon.
Anthony, You can just see the edge of the heavy plinth on the shot Caz found. Your shot was taken just a month after the record was set.
Good find Anthony. I could not understand why Google and Bing were both showing an object next to the Stevenson screen. I believe what you describe as a walkway in the photo I found is the concrete base of the plynth in the photo you have found.
Earlier on I linked you to a photo of a Stevenson screen at Heathrow subject to jet blast. In the text it says the door is always placed North to prevent solar heat affecting instruments when the door is opened, in this case radiant heat from that concrete plnyth must be affecting instruments when the door is opened.
Been considering this quite a lot. I doubt the power lines, sewage works, concrete factory etc are affecting this site. It is obviously in the warmest part of the country anyway but the amplification is purely down to the met office breaking its own siting guidelines.
Surrounding it by very close banking on three sides a nearby brick building and placing a large concrete plynth next to it is bound to create a micro climate and all this flies in the face of met office guidelines.
My gut feeling is that the banking is the major factor here.
Wouldn’ t it be fun to spend a couple of days camped on top of the banking measuring the temperature and comparing results with the official thermometer. 🙂
caz,
Automatic station, door is not opened for months on end.
That said, if the internal layout is asymmetric with an intended sunside it might matter.
I’ve been monitoring the last 24 hours of temp data for Gravesend every evening when I get home to see if it kicks up around early evening (using Tim’s link just below the red bar graph). This is because in my original comment above I was speculating not only on whether Littlebrook power station’s coolant (warm) water was having an effect on the Gravesend site downstream but also whether this would be further evidenced by an anomalous ‘kick-up’ around 6 or 7 PM when people come home from work and started cooking etc. As we know, it kicked up at 6PM last Thursday evening according to the graph in Tim’s post. Then on Friday there was no kick-up (according to the graph but see below!), however there was an extended
flatlining to 7PM. The same flatlining happened again on Saturday (according to the graph). Then today (Sunday) there was a marked kick-up at 5PM. This was when I realised there was something a little strange- the temperature scale for the graph on the left was rising in 2.5 degree C increments for Sunday as opposed to 1 degree increments on Thursday and I believe Friday. I forget Saturday because I just registered the (apparent) flat lining. That 5PM kick-up went from 27.5C to 30C which smacked of rounding both up and down (those red bars ‘snap’ to the nearest horizontal temp scale line). So I clicked on the ‘table’ tab and all was revealed: a rise at 5PM, still a marked one but 0.7C. Now I’m kicking myself for not seeing this earlier because there was no flatlining on Friday and Saturday after all- the red bars were snapping to the same temp even though the tabular results were almost certainly showing different temps and therefore a possible kick-up or kick-down. That bar graph is worthless especially if they change the scale every day and still more so if the temp shown is up to 1.25 C out. Today (Sunday’s 5PM kick-up temp) was 28.8 C on tabular and 30 C on the graph. Admittedly there is a link at the top to a new line graph page for Gravesend that was in beta mode and now live. This shows the true temps but why they ever had, and still have, the bar graph is highly questionable.
So, the conclusion is that there were marked early evening kick-ups on Thursday and Sunday and there might have been on Friday and Saturday too. I realise that on weekends the cranking up of the power station would be less marked but on the hottest weekend of the year everyone is out in the day.
I should mention that the reason I thought there was something in this is that the cooling (ie hot) water discharge at Dungeness nuclear plant is disgorged to the sea about 40 metres from the shore and flows down the shoreline with the tide. It is a distinctly different colour and the sea anglers use this as a guide to cast out to: scores of anglers all casting into the warm flow for hundreds of yards ‘downstream’ and not a single angler upstream of the roiling underwater outlet. So clearly the fish know it’s warm even when it’s thoroughly mixed, way down the coast. This is why my interest was piqued when I saw no cooling towers in the satellite image of Littlebrook power station and knew it had to be discharging to the Thames like Dungeness does to the sea. In other words there is a very spectacular precedent to what may appear to be idle armchair speculation in these comments and over at WUWT.
CGT stations can operate
withoutusing low visibility towers. Didcot is a case of a large coal fired which has switched to gas.An aside here, quite an interesting 2007 item which mentions A and B. This is the nuclear valley hereabouts anyway. (the flue plume coming down ground level here where I live was a pain, stank)
http://www.telegraph.co.uk/earth/earthnews/3295331/Didcot-power-station-may-go-nuclear.html
Here we are nice, web site shows both. Odd that a 2GW coal plant is replaced by a smaller one.
Coal connection: Didcot is famous as a railway town.
http://www.rwe.com/web/cms/en/97538/rwe-npower/about-us/our-businesses/power-generation/didcot/
PDF off there which details plenty.
AJB, I hope this is complementary, I am working on decoding the full records from a different source.
You seem better able to produce neat presentation.
It will be interesting seeing if the Met Office current records are the same as the independent archived records I am accessing. (not giving the source because it is a single server private database which requests no abuse — I try to be gentle but this takes system time)
I doubt there will be a difference but if there is it might be useful to see what kind of corrections take place. (eg. anemometers are troublesome)
This is an adhoc decode, ought to be a full parser on what is pretty complex.
More or less there, fixing up the missing data, always a pain. Almost right.
Once this is done there are many stations available. Data goes back to 2000 but I can’t simply request the lot so this has to be considered, only take what is useful.
air temperature
dewpoint
wind direction
windspeed
air pressure
sea level compensated pressure
Not decoding rain, cloud, weathertype at the moment, might be there for other stations.
So far 2012 since 12th Jan (don’t ask) for gravesend
max
min
wind_knots, T_C, dewpoint, station_pressure
24 31.1 21.2 1042.8
0 -8.8 -10.6 977.1
Looks right. I’m a little surprised the maximum windspeed is that low but London is never supposed to have recorded a gale (>40 mph for more than one hour)
A quick eyeball suggest blows come from 265 degrees. (is in 10 degree steps)
The document does not define the reference! Unfortunately I am used to working in fields where there are various standards so I have no idea whether this is widershins. (spell as you like are many)
I think this is from the west even though this is an estuary open to the east, maybe there were no gales from that direction. On the other hand that embankment is open more or less to the west.
Okay you cleverer folks, which direction is it?
Ought to go and find a definite blow from the east and look.
Anyone know useful ways of presenting wind data?
It is definitely worth looking for a 40 minute lunar pattern in the temperature history. Vuk’s data doesn’t go back far in time but goes foward toward infinity if one is patient.
Darn I should have scrolled further down in the link I posted earlier when discussing Brogdale. It contains the photo that Anthony has posted and a full description of the Broadness site. Seems that when it recorded it’s UK record it was surrounded by chalk gouged from the construction of the Ebbsfleet channel tunnel railway station. I see the Met office website still has Brogdale as the record UK high and that is a travesty considering that hedge and pile of stones breaks all their guidelines for the siting of a weather station. In any other sport the record would be declared void.
http://onlinelibrary.wiley.com/doi/10.1256/wea.10.04B/pdf
Bing Link to the Brogdale weather station
http://binged.it/Rwbt8U
I note this story from The Gravesend Reporter, Wednesday, August 1, 2012: ‘The reason behind Gravesend’s record-breaking temperatures’.
Here’s the whole thing (since it’s so short):
‘Record-breaking temperatures in Gravesend are neither “unreasonable” nor “unexpected”, according to the Met Office after it attempted to explain the reasons behind the area being such a regular hotspot. National weather reports often show Gravesend as one of the hottest places in the country, with temperatures reaching 29 degrees celsius last week.
The area has been recording data since 1995 and posted one of the hottest temperatures since UK records began in 2003 when a heatwave reached 38.1 degrees celsius.
A Met Office spokesman said: “There are fewer than 10 weather stations for which we receive near real-time data in the Greater London area.
“With only Gravesend to the east of London, this would explain why this particular station quite regularly records the highest temperatures.”’
So, to be fair, it’s reasonable to note that someone from the Met Office appears to be the main source for this little local news piece, and that he was happy to draw attention to the effect of siting… Congrats due to the reporter, one Joshua Fowler?
Without showing my scribblings (like RAF Valley) I make Gravesend
At best WMO Class 3 caused by Class 2 demanding 5% in which case Class 4
It might be as low as Class 5 caused by “any” shadow from the sun at 20deg caused by the significant fence very close and lattice mast.
There are further problems caused by an unstable environment, cars, vans, boats, etc etc getting left lying around.
Further problems are the fundamental question of whether the site is typical of the area, if moved some distance would the result be the same? I don’t think so.
It is also in a loop of water. Compare that with Greater London or the whole of Kent?
More subtly insertion into a group of met stations poses problems of equivalence. This is more than merely offset, changing conditions will effect environmentally different sites differently so I don’t think this is safe. More I am not writing now.
tchannon,
Has anyone pointed out that the Industrial galvanized steel fencing could be the cause of the high temperature reading? I’ve noticed Palisade Fencing can become pretty hot and reflect a lot of heat especially tightly spaced fencing as this, add to this the bank/windbreaker and that’s a major heat trap. The other thing I noticed was the grass looks like it gets a fair amount a traffic, right up to the weather station, could it be the case that a maintenance team pulled up to the weather station in a van and parked there for the day while they done some work on the nearby building? the van would be facing south an ideal location to receive sunshine all day, the heat would build up between the van and the fencing peaking at mid-afternoon, maybe maintenance records could be checked for that day? Either way this station is obviously a total dud.
I can plot the suns direction for London over the area if you need it.
p.s. Have you any thoughts on the Armagh station?

There are trees nearby, a van and a very reflective observatory.
Sorry about the delay.
Less directly yes.
I think a fence like that is a dubious area. I interpret it as causing a shadow but this ought to be a cone , all compass directions rather than the sun, is also about exposure.
I also interpret it as like a building but I doubt that would go down well because I call in infinite building depth not just the fence thickness.
This also fails the relocation test of whether the exact site is typical of the area, unless such fences stretch for miles in all directions.
Given high peak temperatures the presence of hot metalwork suggests that is the cause although there might be more reasons which will probably appear from detail work. (if anyone does it, there are more important issues elsewhere)
More a matter of being sensible, perfection is only ideal. That said some major issues have turned up generally. some discussion will be needed as thing progress.
Snippets to add.
There was a Met Office station in Gravesend itself.
The new Gravesend site was notified late 1995 in the WMO Bulletin.
Armagh?
I know the data and site well, spent months on it. Is a mess.
Ignore it. The AWS is not notified to WMO as an active site.
If you really want to know more I can email you. Long story where I have unpublished stuff
tchannon,
Thanks for the update, feel free to add me to your e-mail list. when you get the time.
[…] there is history on the Talkshop with this […]
I have lived in the area all my life and have noticed that early evenings on certain tides the temperature can indeed shoot up dramatically. I have thought about it quite alot and come to the conclusion that on a hot day on shore breezes temper the area over what should be the midday peak however, if the out going tide coincides with the drop off of on shore winds this effectively draws the mass of hot air down the Thames valley from London and also over north downs ,which creates a fohnn effect further amplifying the ambient air temp. This is just my theory I live in corringham Thurrock
looks like this station’s days are numbered. Hollywood is coming. I don’t suppose it hurts the publicity to have a few record breaking high temperatures either.
http://www.dailymail.co.uk/news/article-2214560/Paramount-Pictures-open-huge-2bn-theme-park-near-London-rival-Disneyland-Paris-create-27-000-jobs.html
Nice one. Temperature is paranormal anyway.
My reading of the Met Office is they will welcome such a development.
Wrong location for new development, completely wrong part of the country but that is an entirely different subject.
I’ve just noticed this thread specifically about Gravesend. So, I’ll repeat what I just posted (misplaced) on the surface station thread. It should have gone here. The point is it’s not the generator of the radar that is likely to cause heating but the radio power put out by the radar itself.
I’ve just checked up with a college who has years of experience in radar and microwave design. He reckons the Gravesend – Broadness radar is probably X or C band, ie 5-8 GHz (rather than the 20 GHz I suggested).
Estimating the tower height and distance from the screen it would seem to be about 30 degrees off the horizontal axis of the radar. He reckons that would be about -3dB of the on-axis peak power.
What is more interesting is that one to way to accurately measure the power of millimetric radar is with a bolometer that includes a THERMISTOR.
He says he recalls using such a device that at it’s most sensitive scale measured 1mW full-scale. The transmitter will be several kW.
All this confirms my gut feel on seeing this set-up. There is ample scope for significant heating of the sensor by the radiation from the radar transmitter if this is indeed a thermistor based thermometer.
That’s new angle on station bias. 😉
update:
said college just managed to get onto one of the port of London Authority maintenance team for that radar.
it’s 8,2 GHz radar on 25m tower about 25m away from the met station. 25kW transmitter peak power but very short duty cycle so less than 12W average power.
He’s now suggesting -20dB at 45 degrees off-axis.
In view of the solid angle represented by the thermistor I’d now estimate the effect to be immeasurable.
so hats off to my mate tor finding the right contact so quickly and thanks to the guy at PLA for the data. Nothing beats having some precise figures to work with.
Gigawatts of waste heat from neighbouring power stations and warm air off mud flats seems to be main contenders for spurious warming at Gravesend.