


My Thanks to Paul Vaughan for alerting me to a new paper which has appeared on ARXIV purporting to rebut Abreu et al’s 2012 paper ‘Is there a planetary influence on solar activity?’. Paul has something to say about this paper, as well some other matters related.
No evidence for planetary influence on solar activity
R.H. Cameron and M. Schussler
Max-Planck-Institut fur Sonnensystemforschung, Max-Planck-Str. 2, 37191 Katlenburg-Lindau, Germany
e-mail: cameron@mps.mpg.de,schuessler@mps.mpg.de
July 26, 2013
ABSTRACT
Context. Recently, Abreu et al. (2012, A&A. 548, A88) proposed a long-term modulation of solar activity through tidal effects exerted by the planets. This claim is based upon a comparison of (pseudo-)periodicities derived from records of cosmogenic isotopes with those arising from planetary torques on an ellipsoidally deformed Sun.
Aims. We examined the statistical significance of the reported similarity of the periods.
Methods. The tests carried out by Abreu et al. were repeated with artificial records of solar activity in the form of white or red noise. The tests were corrected for errors in the noise definition as well as in the apodisation and filtering of the random series.
Results. The corrected tests provide probabilities for chance coincidence that are higher than those claimed by Abreu et al. by about 3 and 8 orders of magnitude for white and red noise, respectively. For an unbiased choice of the width of the frequency bins used for the test (a constant multiple of the frequency resolution) the probabilities increase by another two orders of magnitude to 7.5% for red noise and 22% for white noise.
Conclusions. The apparent agreement between the periodicities in records of cosmogenic isotopes as proxies for solar activity and planetary torques is statistically insignificant. There is no evidence for a planetary influence on solar activity.
1. Introduction
There is a long record of attempts to associate periodicities in the level of solar activity with the orbits of the planets. All of these eventually failed rigorous statistical tests (Charbonneau, 2002), which is not surprising in view of the extreme tininess of the physical effects (e.g., Callebaut et al., 2012).
Recently, Abreu et al. (2012, hereafter A2012) made a new attempt in this direction by comparing periodicities detected in the records of cosmogenic isotopes 10Be and 14C (or quantities derived from them) as proxies for solar activity in the past 9400 years with those of the torque exerted on a thin shell of an ellipsoidally deformed Sun1. They found coincidences between selected periodicities in the planetary torque and the level of cosmogenic isotopes. After assessing the statistical significance under the assumption that the level of solar activity is a realisation of either white or red noise, they interpret their result as evidence for a planetary influence on long-term variations of the activity (in their words:“… highly statistically significant evidence for a causal relationship…”).
Here we show that the statistical test presented by A2012 to demonstrate a causal link between the planetary orbits and the level of solar activity is conceptionally flawed and biased. Furthermore, their execution of the test contains severe technical errors. A corrected test reveals that the period coincidences reported by A2012 are statistically insignificant.
5. Concluding remarks
The statistical test proposed by Abreu et al. (2012), a comparison of the coincidences of spectral peaks from time series of planetary torques and cosmogenic isotopes (taken as a proxy for solar activity in the past) with red and white noise, is logically unable to substantiate a causal relation between solar activity and planetary orbits. Furthermore, the execution of the test contains severe technical errors in the generation and in the treatment of the random series. Correction of these errors and removal of the bias introduced by the tayloring of the spectral windows a posteriori leads to probabilities for period coincidences by chance of 22% for red noise and 7.5% for white noise. The coincidences reported in Abreu et al. (2012) are therefore consistent with both white and red noise.
Owing to our lack of understanding of the solar dynamo mechanism, red or white noise are only one of many possible representations of its variability in the period range between 40 and 600 years in the absence of external effects. This is why the test of A2012 is logically incapable of providing statistical evidence in favour of a planetary influence. Alternatively one could consider the probability that a planetary system selected randomly from the set of all possible solar systems would have periods matching those in the cosmogenic records. In the absence of a quantitative understanding of the statistical properties of the set of possible solar systems to draw from, the comparison could again, at best, rule out a particular model of the probability distribution of planetary systems. Here we have shown that the test in A2012 does not exclude that the peaks in the range from 40 to 600 years in the planetary forcing are drawn from a distribution of red or white noise.
We conclude that the data considered by A2012 do not provide statistically significant evidence for an effect of the planets on solar activity.

Hey,
Svalgaard and I have worked out mutually inclusive planetary theory:
Read on the WUWT from here and have a good laugh.
I am sure that Anthony (Watts) and his pit bull (aka Leif) will have a field day with this paper. That will be until they see the backup papers from the Abreu et al. group which will clinch the deal.
When a paper is written to specifically target the assertions of another group and it only has a total of four references, you know that they are running scared.
McCracken, K.G.; Beer, J.; Steinhilber, F.; Abreu, J. (2013). A phenomenological study of the cosmic ray variations over the past 9400 years, and their implications regarding solar activity and the solar dynamo. Solar Physics 286(2), 609-627.
=
Two 9400-year long 10Be data records from the Arctic and Antarctic and a 14C record of equal length were used to investigate the periodicities in the cosmic radiation incident on Earth throughout the past 9400 years. Fifteen significant periodicities between 40 and 2320 years are observed in the 10Be and 14C records, there being close agreement between the periodicities in each record. We found that the periodic variations in the galactic cosmic radiation are the primary cause for periods 250 years. The spectral line for the Gleissberg (87-year) periodicity is narrow, indicating a stability of ≈ 0.5 %. The 9400-year record contains 26 Grand Minima (GM) similar to the Maunder Minimum, most of which occurred as sequences of 2 – 7 GM with intervals of 800 – 1200 years in between, in which there were no GM. The intervals between the GM sequences are characterised by high values of the modulation function. Periodicities < 150 years are observed in both the GM intervals and the intervals in between. The longer-period variations such as the de Vries (208-year) cycle have high amplitudes during the GM sequences and are undetectable in between. There are three harmonically related pairs of periodicities (65 and 130 years), (75 and 150 years), and (104 and 208 years). The long periodicities at 350, 510, and 708 years closely approximate 4, 6, and 8 times the Gleissberg period (87 years). The well-established properties of cosmic-ray modulation theory and the known dependence of the heliospheric magnetic field on the solar magnetic fields lead us to speculate that the periodicities evident in the paleo-cosmic-ray record are also present in the solar magnetic fields and in the solar dynamo. The stable, narrow natures of the Gleissberg and other periodicities suggest that there is a strong "frequency control" in the solar dynamo, in strong contrast to the variable nature (8 – 15 years) of the Schwabe (11-year) solar cycle.
=
Data:
ftp://ftp.ncdc.noaa.gov/pub/data/paleo/climate_forcing/solar_variability/steinhilber2009tsi.txt
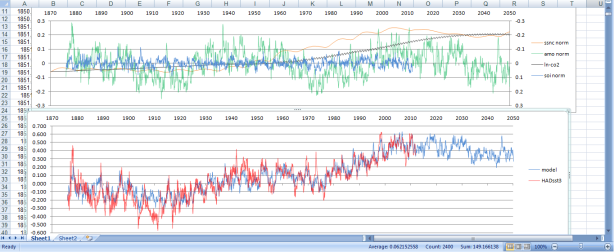
Illustrations
Tim Channon

Ray Tomes:

Abreu+(2012):

We have a square hole and by jingos we are going to shove a round peg into it, no matter what it takes. The ultimate exercise in a foregone conclusion.
Paul,
How are you getting through to Rog? Twitter? I seem to be persona non grata right now. He must be off walking in the Yorkshire Moors or something because he fails to respond to any emails that I have sent him.
[Reply] Ian, not deliberate, will trawl inbox and respond. Too much going on – had a partial meltdown. Rog
NASA J2000 (3000BC-3000AD)
J = 11.86630899
S = 29.47303787
U = 84.05119028
N = 164.888325
(164.888325)*(84.05119028) / (164.888325 – 84.05119028) = 171.4442259
(11.86630899) / 2 = 5.933154494
(29.47303787) / 5 = 5.894607573
(5.933154494)*(5.894607573) / (5.933154494 – 5.894607573) = 907.2999052
(171.4442259)*(164.888325) / (171.4442259 – 164.888325) = 4312.016244
2*(907.2999052) = 1814.59981
2*(4312.016244) = 8624.032488
(8624.032488)*(1814.59981) / (8624.032488 – 1814.59981) = 2298.160281
(8624.032488)*(1814.59981) / (8624.032488 + 1814.59981) = 1499.158824
(There’s much more to say about these 2 at a later date…)
(2298.160281)*(1499.158824) / (2298.160281 – 1499.158824) = 4312.016244
(2298.160281)*(1499.158824) / (2298.160281 + 1499.158824) = 907.2999052
(1149.080141)*(907.2999052) / (1149.080141 + 907.2999052) = 506.9881439
(506.9881439)*(1149.080141) / (506.9881439 + 1149.080141) = 351.7789774
(506.9881439)*(351.7789774) / (506.9881439 + 351.7789774) = 207.6788531
(506.9881439)*(207.6788531) / (506.9881439 + 207.6788531) = 147.3283595
(506.9881439)*(103.8394265) / (506.9881439 + 103.8394265) = 86.18693831
(351.7789774)*(207.6788531) / (351.7789774 + 207.6788531) = 130.5854536
2*(351.7789774) = 703.5579549
(207.6788531) / 2 = 103.8394265
(147.3283595) / 2 = 73.66417975
(130.5854536) / 2 = 65.29272681
Tim Channon
Ray Tomes
10Be: http://cyclesresearchinstitute.wordpress.com/2011/07/13/analysis-of-be10-records-as-a-solar-irradiance-proxy/
14C: http://cyclesresearchinstitute.wordpress.com/2010/06/27/cycles-in-sunspot-number-reconstruction-for-11000-years/
104 & 208: http://cyclesresearchinstitute.wordpress.com/2012/11/13/sunspot-number-reconstruction-by-leif-svalgaard-and-proxy-cycles-of-104-and-208-years/
___
correctly points to harmonics, but skips careful diagnostics:
Svalgaard, L. (2013). Comment on the planetary influences paper by Abreu et al. (2012).
Click to access Comment-Planetary-Peaks.pdf
___
stat inference based on assumptions that are untenable in light of observed data structure:
Cameron, R.H.; & Schussler, M. (2013). No evidence for planetary influence on solar activity.
http://arxiv.org/pdf/1307.5988v2.pdf (dated July 26, 2013)
Abreu, J.A.; Beer, J.; Ferriz-Mas, A.; McCracken, K.G.; & Steinhilber, F. (2012). Is there a planetary influence on solar activity? Astronomy & Astrophysics 548, A88.
Click to access aa19997-12.pdf
(SAO/NASA ADS citation history)
IMPORTANT:
http://img845.imageshack.us/img845/6451/1xx.gif (2-slide animation)
The ~200y is very well known but this is about modulation of cosmic rays where the proxy is 10BE or less usually 14C (shorter half-life).
Why the modulation occurs is unclear. One explanation is magnetic and presumbaly of solar origin. Unfortunately this is chicken and egg, does not prove anything since any cause of cosmic ray variation could be at work. We don’t even know the origins of the cosmic rays.
Now rolls this back onto the dispute over solar variation.
It would be nice if things were simple.
(the modulation of ~200y intensity, yes I agree but I can’t recall showing this, might have done)
Or perhaps I don’t understand.
Paul,
Very impressive investigation! You may want to go to my web site over the coming weeks for an encore.
Only a small quibble. You still have not explained why the Northern and Southern Hemisphere SST’s respond to different stimuli.
http://img845.imageshack.us/img845/6451/1xx.gif (2-slide animation)
I did some work on the sunspot number integration a while back.
2010
2013
2012

Planetary influence on solar variation
This thing is going to get funny. I wonder if the editor gave Abreu et al. the right of a reply.
My first impression is that their analysis is not robust. Inventing statistical tests to try to rebut a coherence finding of real data is not a robust way to proceed in general. If they try to use the same technique on records with known harmonics (astronomical or tidal) they would not find anything as well and disprove important results. They did not do such tests to test the same robustness of their statistical methodologies.
Proper red-noise tests are made in my papers (figure 3).
Scafetta N., and R. C. Willson, 2013. Planetary harmonics in the historical Hungarian aurora record (1523–1960). Planetary and Space Science 78, 38-44.
Click to access Scafetta_Willson_2013_Aurora_PSS.pdf
and in Figure 4
Scafetta N., 2012. Multi-scale harmonic model for solar and climate cyclical variation throughout the Holocene based on Jupiter-Saturn tidal frequencies plus the 11-year solar dynamo cycle. Journal of Atmospheric and Solar-Terrestrial Physics 80, 296-311.
Click to access ATP3581.pdf
Note that I use better technique of spectral analysis of Abreu et al., by the way.
Moreover, R.H. Cameron and M. Schussler cite Callebaut et al. (2012) :
“All of these eventually failed rigorous statistical tests (Charbonneau, 2002), which is not surprising in view of the extreme tininess of the physical effects (e.g., Callebaut et al., 2012).”
but they refuse to cite my own paper suggesting the solution of the problem
Scafetta N., 2012. Does the Sun work as a nuclear fusion amplifier of planetary tidal forcing? A proposal for a physical mechanism based on the mass-luminosity relation. Journal of Atmospheric and Solar-Terrestrial Physics 81-82, 27-40.
Click to access ATP3610.pdf
and my own rebuttal to Callebaut et al., 2012.
Scafetta N., O. Humlum, J.-E. Solheim, and K. Stordahl, 2013. Comment on “The influence of planetary attractions on the solar tachocline” by Callebaut, de Jager and Duhau. Journal of Atmospheric and Solar–Terrestrial Physics. in press.
Click to access ATP_3797.pdf
The debate will continue between people proposing detailed and advanced statistical technique to find a subtle signal, and people trying to disprove the findings by using rude statistics unable to do the job.
By the way,
Tim and Roger may be interested in running a new post on this.
Just today a new paper was published showing strong evidences supporting the planetary theory of solar variation, which is the theory claiming that there is a (direct or indirect) planetary control on climate change.
Despite the defamation attempts of Anthony and Willis who are simply trying to deal with something bigger than themselves, I continue to publish on the topic. This thing is getting big.
Scafetta N, Willson R.C. (2013). Empirical evidences for a planetary modulation of total solar irradiance and the TSI signature of the 1.09-year Earth-Jupiter conjunction cycle. Astrophysics and Space Science.
DOI: 10.1007/s10509-013-1558-3
http://link.springer.com/article/10.1007%2Fs10509-013-1558-3
Abstract
The time series of total solar irradiance (TSI) satellite observations since
1978 provided by ACRIM and PMOD TSI composites are studied. We find
empirical evidence for planetary-induced forcing and modulation of solar
activity. Power spectra and direct data pattern analysis reveal a clear
signature of the 1.09-year Earth-Jupiter conjunction cycle, in particular
during solar cycle 23 maximum. This appears to suggest that the Jupiter side
of the Sun is slightly brighter during solar maxima. The effect is observed
when the Earth crosses the Sun-Jupiter conjunction line every 1.09 years.
Multiple spectral peaks are observed in the TSI records that are coherent
with known planetary harmonics such as the spring, orbital and synodic
periods among Mercury, Venus, Earth and Jupiter: the Mercury-Venus
spring-tidal cycle (0.20 year); the Mercury orbital cycle (0.24 year); the
Venus-Jupiter spring-tidal cycle (0.32 year); the Venus-Mercury synodic
cycle (0.40 year); the Venus-Jupiter synodic cycle (0.65 year); and the
Venus-Earth spring tidal cycle (0.80 year). Strong evidence is also found
for a 0.5-year TSI cycle that could be driven by the Earth’s crossing the
solar equatorial plane twice a year and may indicate a latitudinal
solar-luminosity asymmetry. Because both spring and synodic planetary cycles
appear to be present and the amplitudes of their TSI signatures appear
enhanced during sunspot cycle maxima, we conjecture that on annual and
sub-annual scales both gravitational and electro-magnetic planet-sun
interactions and internal non-linear feedbacks may be modulating solar
activity. Gravitational tidal forces should mostly stress spring cycles
while electro-magnetic forces could be linked to the solar wobbling
dynamics, and would mostly stress the synodic cycles. The observed
statistical coherence between the TSI records and the planetary harmonics is
confirmed by three alternative tests.
see my web-site for the pdf file
Click to access 10.1007_s10509-013-1558-3.pdf
Nicola,
Thank you for alerting us to this new paper. I will certainly give it a separate posting for discussion. Apologies to all for my recent lapses in replying to email.
Nicola says:
Power spectra and direct data pattern analysis reveal a clear
signature of the 1.09-year Earth-Jupiter conjunction cycle, in particular
during solar cycle 23 maximum. This appears to suggest that the Jupiter side
of the Sun is slightly brighter during solar maxima.
This is consistent with Wolff and Patrone’s 2010 finding:
“We demonstrate the energy with a very simple model in which two fluid elements of equal mass exchange positions, calling to mind a turbulent field or natural convection. The exchange releases potential energy that, with a minor exception, is available only in the hemisphere facing the barycenter of the planetary system. We calculate its strength and spatial distribution for the strongest case (“vertical”) and for weaker horizontal cases whose motions are all perpendicular to gravity. The vertical cases can raise the kinetic energy of a few well positioned convecting elements in the Sun’s envelope by a factor ≤ 7. This is the first physical mechanism by which planets can have a nontrivial effect on internal solar motions. Occasional small mass exchanges near the solar center and in a recently proposed mixed shell centered at 0.16Rs would carry fresh fuel to deeper levels. This would cause stars like the Sun with appropriate planetary systems to burn somewhat more brightly and have shorter lifetimes than identical stars without planets.”
yes, Roger
I wait your new post for commenting
[Reply] On it’s way!
After the kicking handed out on the Callebaut and de Jaeger paper, I very much doubt Anthony will be making a song and dance about the Cameron and Schussler paper on WUWT. He must by now be beginning to get the feeling that Leif has been pulling the wool over his eyes all these years.
The solar-planetary theory is powering forward thanks to the unstinting efforts of its proponents!
Something I’ve never seen reported before by anyone: solar cyclocycloperiodicity. Not only is there periodic variation of cycle length, there’s additionally periodic (centrally limited attractor) variation of the periodic variation of cycle length — i.e. periodicity of the periodicity of the periodicity.
Take note of where Cameron & Schussler (2013) explicitly assume uniformity.
At the very least Cameron & Schussler should know how to diagnostically refute an assumption of uniformity by detecting cyclic volatility.
It’s standard practice in academia to totally & completely omit diagnostics on inferential assumptions, something I’ve always found to be an “interesting” cultural phenomenon.
_
Nicola Scafetta (July 29, 2013 at 11:33 am) suggested:
“If they try to use the same technique on records with known harmonics (astronomical or tidal) they would not find anything as well and disprove important results.”
I encourage you to explore this rigorously.
If you find anything worthy of report, may I suggest writing it up in a concise paper that deliberately avoids pressing political hot-buttons?
–
Ian:
I have quantitative refinements and I’ve drafted concise notes. I aim to share sometime during the next 2 months.
For the local Pacific Northwest example I gave, 97% of the variation is explained. If you look hard enough near the bottom of that graph, you’ll see a faint grey line that accounts for less than 3% of the variation, which is about 0.5 degrees Celsius per century — that’s all that’s left to be shared by UHI, CO2, LIA rebound, &/or whatever else.
–
Ulric Lyons: Looking forward — as always — to your input, if you have anything to graciously volunteer…
R.H. Cameron and M. Schussler from the Max-Planck-Institut fur Sonnensystemforschung, conclude: ‘No evidence for planetary influence on solar activity’ . ‘ABSTRACT: Recently, Abreu et al. (2012, A&A. 548, A88) proposed a long-term modulation of solar activity through tidal effects exerted by the planets.
Conclusions. There is no evidence for a planetary influence on solar activity.’
Hi all, that is junk science.
It is evident that significant power peaks in a FFT analysed spectrum from Abreu et al. like a peak period at ~900 years, ~300 years and ~180 years indicate a first harmonic (900), a 3rd harmonic (300) and a 5th harmonic. This suggests that the 900 year cycle is not a stupid sine function. It can be known that these power peaks occur also in a FFT spectra of the heliocentric synodic tide function from the planets Quaoar and Pluto, because this fact is known since 3 years.
It is some stupid to claim NO evidence; there is only a personal statement possible, that they have not found any evidence.
But there are more points. To take a doubtful time scale calibration as scientific fact is stupid, especially because there is no calibration normal to the astronomical time scale. But it is possible to take solar tide functions of planetary couples to recalibrate the time scale. But they haven’t. Looking for the main power peaks of the Abreu FFT spectrum there is a shift between the Abreu peaks and the power peaks from the Quaoar/Pluto peaks:
It is of no scientific worth, to claim nothing and let the causes of the power peaks containing heat power stream over time from the Sun to the Earth out.
Some 8 solar tide functions in sum fro, plaanets reflects also in the neutrino capture rate from the Sun:
It would be better if the authors look for coherence instead of sell nothing.
V.
Paul Vaughan says:
*******
Nicola Scafetta (July 29, 2013 at 11:33 am) suggested:
“If they try to use the same technique on records with known harmonics (astronomical or tidal) they would not find anything as well and disprove important results.”
I encourage you to explore this rigorously.
If you find anything worthy of report, may I suggest writing it up in a concise paper that deliberately avoids pressing political hot-buttons?
*****
Paul, it is very easy.
Fourier spectral estimates as used by Abreu et may have some problem, they need to double check the peaks with the MEM and the periodogram, which may not have those kind of padding problems, etc.that may make the things messy.
As I try always to do in my papers.
In general solar records present peaks at about 85-90 year and 200-215 year, and they are well known. These frequencies can be easily reconstructed by planetary harmonics.
In general these statistical tests need to use the physical statistical error in the data instead of generic white or red errors definition. One never knows if the problem is the data or the statistical test.
Ian Wilson (July 29, 2013 at 3:40 am) wrote:
“We have a square hole and by jingos we are going to shove a round peg into it, no matter what it takes. The ultimate exercise in a foregone conclusion.”
The way it works:
1. Create a system of administrative double standards.
2. Attempt enforcement.
It’s not sensible to play that game with abusive double-speakers.
Persistent online stalking, harassment, bullying, & abuse are unacceptable. I firmly support efforts to make these activities illegal. When these activities happen in person, you can call the police and have them arrest the aggressor. During the past few days we’ve seen Nicola attacked in a manner than can be described as follows: maliciously spoken, misleading, and calculated to intimidate and discourage.
The info needed to reproduce Nicola’s calculations is publicly available. Aggressors repeatedly suggest otherwise. If a fraction of the effort invested in harassing Nicola had been spent on calculations, the calculations could have been reproduced several times over by now.
“This claim is based upon a comparison of (pseudo-)periodicities derived from records of cosmogenic isotopes with those arising from planetary torques on an ellipsoidally deformed Sun.”
Huh??? Perhaps I’m a bit ‘thick’ on this subject, but the ‘force of origin’ (gravity) must surely be a “radial” one?
Unlike the Earth – Moon couple, where Earth’s solid body gravity varies with longitude, a planet’s gravitational force to Sol, and vis versa, acts along a line that bisects the core of both bodies. The active force is greater at the nearest side and lesser at the furthest side, the gravitational/tidal effect amounts to the difference between the exerting body’s gravitational pull between the nearest and furthest extremity of each body. The effect tries to ‘stretch’ the bodies along the bisecting line between the cores.
Any upheaval of gas from Sol’s unforced substance is caused solely by a “radial” force of gravity from orbiting planets. The point that Sol also rotates brings another effect into action, Coriolis.
The Coriolis effect is just conservation of the rotating kinetic. As Sol’s material gains altitude by tidal displacement its rotational vector remains unchanged, thus traversing fewer degrees around the body giving the ‘appearance’ of slowing. However, its speed is unchanging and reverts to traversing the same number of degrees around the body when its altitude is normalised again.
Where is the “torque” generated? Is it frictional (unlikely), electro-magnetic (probably)? Anyone?
Best regards, Ray.
Ray, ‘ellipsoidally deformed’ gives the clue. Abreu et l’s hypothesis is that there is a lack of uniformity in the Sun which tidal forces from planets act differentially on.
Nicola Scafetta (July 29, 2013 at 1:48 pm) suggested:
“These frequencies can be easily reconstructed by planetary harmonics.”
Yes, I know.
Insights from your figure 4 point to a subset of these periods which can be used to mimic the data with arbitrary precision (r^2 effectively 100%). It’s child’s play. But the data represent nonlinear and more importantly spatiotemporally-multipath signals (why we can’t ignore nonuniform volatility). Therefore I’ve chosen not to present potentially very misleading graphs & forecasts. I stick to exploration. I leave forecasting to others. I respect that we each have a different role to play.
Regards
— — —
I want to nip potential misunderstandings in the bud.
This is regarding the animation I’ve shared above.
The orange lines are summaries of sunspot numbers and NOTHING else.
The orange lines are NOT based on planetary periods.
The orange lines are NOT smooths of the blue SST lines.
I emphasize this because of repeated false assumptions that keep coming up in discussion (occurring elsewhere) no matter how many times I emphasize this.
FYI Svalgaard’s TSI can be substituted for sunspot numbers to produce the same result. (NO planetary periods and NO SST smoothing involved.)
Thanks sincerely for your careful attention to this cautionary note.
@Paul
The bottom dollar is that if you can track the solar activity from multi-body heliocentric configurations at the scale of terrestrial weather, you can say exactly when any pseudo cycle will be constructively or destructively affected. And at that scale, predict the hydrological implications, which is not possible at longer scales. The best clues are found in the noise.
tallbloke says: July 29, 2013 at 3:41 pm
“Ellipsoidal deformation”??? So Sol is ‘oblate’, like the Earth, as a result of its ‘spin’ as well? I didn’t think it was. 😦
http://en.wikipedia.org/wiki/Sun
It seems I need to learn a lot more on this subject before I can discuss it, I thought Sol’s mass was held in place by a gigantic gravitational force and pushed apart by gigantic electro-magnetic and electro-static forces. The reason behind us not observing tidal motion, only increased electro-magnetic/static activity/emission.
Best regards, Ray.
Ray, there is an observed anomaly in the sun which may be making the tachocline egg shaped. Yes, gravity is trying to pull it spherical, but remember the Sun is a dynamic beast of the thing, which enormous amounts of energy pouring from its heart outwards. If for whatever reason there is less resistance to the energy’s motion in a specific direction, you’ll get a bulge there.
tallbloke says: July 29, 2013 at 9:58 pm
“If for whatever reason there is less resistance to the energy’s motion in a specific direction, you’ll get a bulge there.”
From my understanding, if a star is at the stage where the gravitational force can’t properly contain the thermonuclear shocks of random fusion, its near to a supernova event.
A star sheds mass slowly in the ‘proton : electron’ stellar wind. If the stellar mass is reduced to a critical level before thermonuclear fusion ceases, the star goes supernova. If a star ceases thermonuclear fusion before its stellar mass falls below a critical level, the star collapses into either a ‘dwarf’, or a ‘neutron, star (please note the lack of a ‘time line’ here 🙂 ).
If you refer to the tidal effect generating a ‘bulge’ that causes uneven mixing of fusion material within Sol. The uneven mixing may be possible, but I doubt that the ‘bulge’ is. Magnetohydrodynamics would dampen the expansion, and gravity would do the rest to maintain Sol’s centre of gravity (nothing to do with Barry Centre).
TB I don’t want to keep making these OT remarks. Can anyone please ‘point me towards’ (link to) a pertinent educational product for this discussion? The subject is absorbing, but I’m working on ‘first principles’ here. 😦
Perhaps you could at least point me towards the “observed anomaly in the sun which may be making the tachocline egg shaped.” TB?
Best regards, Ray.
@ian Wilson
Go easy, I rarely comment here, but surely differing responses in northern and southern SSTs is due to circulation. Southern oceans are wide open, Northern crowded by continents. Or were you being ironically rhetorical?!
“there is an observed anomaly in the sun which may be making the tachocline egg shaped”
Right oh.
So gravity can take the yolk?
tchannon says. July 30, 2013 at 2:01 am
“So gravity can take the yolk?”
Yeah TC. Perhaps it can, but I can’t. I’m out’a here.
Ray.
In the night Ray Dart says:
Perhaps you could at least point me towards the “observed anomaly”
Ray, So sorry, I was asleep when your data request came in. Vuk has a couple of graphics. Maybe he has links to the places he got them from.
try this: Ossendrijver, M. A. J. H. Astron. Astrophys. 359, 364–372 (2000).
Later in the night Ray Dart says:
I’m out’a here.
Vuk, don’t bother.
Tim C says:
So gravity can take the yolk?
Well, you’ve studied the sunspot asymmetry in the separated N.S. data.
Got a ready explanation for the persistent longterm inhomogeneity?
If not, then as Paul V admonishes us from time to time:
RULE NOTHING OUT.
>> suricat says:
July 29, 2013 at 3:26 pm
“This claim is based upon a comparison of (pseudo-)periodicities derived from records of cosmogenic isotopes with those arising from planetary torques on an ellipsoidally deformed Sun.”
Huh??? Perhaps I’m a bit ‘thick’ on this subject, but the ‘force of origin’ (gravity) must surely be a “radial” one?
Unlike the Earth – Moon couple, where Earth’s solid body gravity varies with longitude, a planet’s gravitational force to Sol, and vis versa, acts along a line that bisects the core of both bodies. The active force is greater at the nearest side and lesser at the furthest side, the gravitational/tidal effect amounts to the difference between the exerting body’s gravitational pull between the nearest and furthest extremity of each body. The effect tries to ‘stretch’ the bodies along the bisecting line between the cores.
Any upheaval of gas from Sol’s unforced substance is caused solely by a “radial” force of gravity from orbiting planets. The point that Sol also rotates brings another effect into action, Coriolis.
The Coriolis effect is just conservation of the rotating kinetic. As Sol’s material gains altitude by tidal displacement its rotational vector remains unchanged, thus traversing fewer degrees around the body giving the ‘appearance’ of slowing.
However, its speed is unchanging and reverts to traversing the same number of degrees around the body when its altitude is normalised again.
Where is the “torque” generated? Is it frictional (unlikely), electro-magnetic (probably)? Anyone?“ <<
@suricat
As Hung has pointed out, the acting torque (and vector) to move the solar gas of the surface of the Sun, is about ~60° away from meridian of the planet constellation measured in longitude coordinates.
People speaking on the lenght in time of a sunspot period. But that is junk, because the correct scientific dimension is a frequency measured in [Hz] or [1/year]. This is necessary because only frequency can be connected to an energy using e geometric structure.
The average frequency of the sun spots since they are recorded is 1/11.196 [y-1]. Because of that it is possible to compute the frequency shift (delta f) of the single sun spot phases. This frequency shift (red filled dots)can be compared with (i) the solar tides from the planets Jupiter and outer planets inclusive Quaoar (light blue), and with (ii) the (smoothed) Yamal temperature reconstruction data for the last 3 centuries (dark blue):
Logic tells us that there is a correlation between the frequency shift of the average sun spot frequency and the global temperature on Earth. In the torque discussion the fluid surface of the Sun this means that while increasing tide torque phases like 1760 AD, there must be an increase of the sun spot frequency correlated to an increase of the heat load of the sun streaming to the Earth. This can be argued with a constant angular momentum but a changing average radius to the outer surface layer of the Sun (We all know this from a person on a rotating chair, who is taking the arms with weights to the body). This all is simple physics.
There constantly Newton’s gravity is mentioned if solar tide is argued. But that is a fallacy, because in the case of tides, which do need always two oscillating bodies, the size of the bodies are also relevant as you have written. If there would be two objects with very small radius, there would then only a very small tide effect on fluids or elastic plates. This is different to the Sun as you wrote correctly, because of the big radius of the Sun.
But there is another aspect. The path of a planet like Sedna is running at a distance of 1000 times the distance Sun/Earth [AU] without any ‘gravitational force’, but only on a natural geometric law of a frequency [1/s] and an angular momentum with the dimension of [V A s s] equal to Planck’s constant h, exhibits an energy E [V A s]. As we know from the path of the Moon, which is taking greater distances to the Earth, because of the tides, there is a transfer of the (common constant) angular momentum from the Earth to the Moon. There is no loss of angular momentum in this process, and not so as well in the tide processes in the solar system.
V.
Ah, Vuk popped the link I was after for Ray on the WUWT thread
“It is well known fact that solar magnetic field has a pronounced bulge (discovered by young Svalgaard and his colleagues) written about by Dr. J. Feynman, which slowely drifts longintudinaly”
http://www.vukcevic.talktalk.net/LFC7.htm
(2298.160281) / 2 = 1149.080141
(should have been included above)
>> Paul Vaughan says:
July 31, 2013 at 4:23 am
(2298.160281) / 2 = 1149.080141
(should have been included above) ”
I do not see what these precise math of our 4 selected planet time periods shoud show.
Can you please talk about it and why you do not explain the common idea of it?
Calculating the synodic frequency of two planets it is just the difference of the two eigen-frequencies.
Because of the ellipticity of each planet, there is not only is precise frequency measurabel, but a spectrum of many frequencies and also with higher harmonics,
In the case of Abreu this means that only with complex tide function of 2 planets their spectrum can be verified including the 3rd anf 5th harmonic of the tide 1st harmonic frequency of 1/913 years-1
V.
@ Volker
Most people do not realize the indirect utility of the spotlight you put on the motions of Quaoar & Pluto.
We will not reach shared vision in 1 exchange, but a brief exchange may be worthwhile.
Ulric Lyons points to:
a) JEV = 11.054640623224
b) SEV = 9.01617300286582
c) related ~99 & ~198 year event series
Interpretation of the analysis of the adjusted sunspot numbers here can be improved with attention to the aggregate pace of north-south asymmetry, which suggests need for more careful attention to & distinction between quadrupole & dipole components:

http://imageshack.us/a/img16/4559/xzu.png (pay particular attention to the faint light blue & turquoise phase summaries)
The preceding all look consistent with the calibration shift you suggest, but I advise caution for reasons that may only become evident several discussions from now. If TB is curious to know more (and explicitly says so), I will introduce calculations I believe he will like.
[Reply] I think it’s great to have calcs out where they may jog someone else’s ideas too. So I’m explicitly saying yes, please post them.
@ Paul Vaughan
Sorry. There was a paper about cosmic ray variations over the past 9400 years, and there was a conclusion from a counter paper: ‘There is no evidence for a planetary influence on solar activity’.
The question is, ‘Who is right?’
I have done some FFT investigations on the Steinhilber data for that time range and have compared it with mainly one heliocentric synodic tide function from two planets, which synodic time period is about 1800 years and he tide period is about 900 years, because the tide strength of this period is about three times higher than a period of 90 years. The period of 900 years is well known from the temperature reconstructions we all know for the last 2 millennia.
To answer the question it seems to be wise to compare both the FFT analysis of the Steinhilber data with the FFT analysis of the tide data from the two planetary couples available over a time range of 6000 years. This seems especially wise, because power peaks of the same frequency can increase the significance of the relation.
Doing this, it seems that the Steinhilber time scale calibration from isotopes is 7.14% to high in respect to the astronomical time scale, if one takes a linearity in the calibration. Correcting the Steinhilber time scale by a factor of k = 0.93333, there not only some power peaks on equal frequencies, but also a similar function over the time.
Speaking about significance this means that this comparison has a greater significance as a number of single time periods without any Amplitude and without any astronomical logic. Periods in years are numbers attached with a name and not more.
I think it is something stupid to try to match blind astronomical time periods with time periods defined as years but of low accuracy. And IMO this problem will not be fixed, if all possible synodic periods and all their harmonics will be calculated.
Despite the principle errors in their cosmic ray paper, from their data one can conclude that there is a very high significance that the synodic tide couple of the planets Quaoar and Pluto and all other neighbour couples until Mercury control the heat power of the Sun measured on Earth as the global temperature over many millennia.
So the answer is: ‘Right is science, because these strong astronomical facts cannot be scientifically refuted.’
Thank you
V.
Volker Doormann says: July 30, 2013 at 11:10 am
“>> suricat says:
July 29, 2013 at 3:26 pm”
Thank you so much for your measured reply. I was up nearly all night trying to make sense of things, I can’t recall how many papers I Googled. 🙂
“As Hung has pointed out, the acting torque (and vector) to move the solar gas of the surface of the Sun, is about ~60° away from meridian of the planet constellation measured in longitude coordinates.
”
Unfortunately the diagram doesn’t depict a ‘torque’. This shows an ‘opposing couple’ where the forces in each hemisphere cancel each other. The sum of these forces deliver zero torque. However, this does look to be a diagram that depicts the causal forces for upper atmospheric gas/plasma [mass] movement, which also isn’t compliant with ‘Newtonian Mechanics’ (NM) either (unless the subject is gas/plasma [mass] loss from TOA).
I can’t reconcile Sol’s spherical form with NM either. With Sol’s radius and rate of spin NM declares Sol to be ‘oblate’, but it isn’t. There must be other forces at work, perhaps electro-magnetohydrodynamics? These ‘other forces’ must also inhibit a tidal surge on Sol, thus, generate ‘other means’ to release these energies.
“People speaking on the lenght in time of a sunspot period. But that is junk, because the correct scientific dimension is a frequency measured in [Hz] or [1/year]. This is necessary because only frequency can be connected to an energy using e geometric structure.”
Yes, a mutual periodicity is necessary to establish a correlation between Celestial Mechanics (Stellar System Mechanics in this instance) and the observed behaviour of a Star, but what of the Stellar Mechanics that lead to the observed behaviour?
TBH, the frequencies that interest me more, are the Sun Spot EM emission frequencies. These ‘seem’ to be the final stage of energy release following perturbation from a gravitational anomaly.
I’m way off thread again now, I need to get out’a here again. 😦
Ray.
Ray, Hung found the planets elicited flare activity most frquently at certain angles from the meridian. 30 and 60 being strong ones. Suggests electro-magnetic linkage rather than gravito-tidal to me.
tallbloke says: July 31, 2013 at 11:23 pm
“Ray, Hung found the planets elicited flare activity most frquently at certain angles from the meridian. 30 and 60 being strong ones. Suggests electro-magnetic linkage rather than gravito-tidal to me.”
Perhaps I’m not as OT as I thought I was TB. 🙂
I’m trying to associate/understand the mechanics, and train of events leading to full resolution, behind an observed Solar reaction with the gravitational anomaly that correlates with that reaction. IOW, how/why Planets affect a Sun.
Why do we use the term ‘meridian’ with Sol, but use ‘equator/equatorial’ elsewhere? It has the same latitude marque (point of ref). Just trying to simplify interaction between divergent disciplines. 🙂
I’d rather await Volker’s response before saying more.
Best regards, Ray.
Volker, I’m orders of magnitude short on free time, but should a period of extreme freedom ever arise in the future I might look into the calibration issue. TB, I’ll put up some numbers next chance I get.
„ suricat says:
July 31, 2013 at 11:12 pm
Unfortunately the diagram doesn’t depict a ‘torque’. This shows an ‘opposing couple’ where the forces in each hemisphere cancel each other.
However, this does look to be a diagram that depicts the causal forces for upper atmospheric gas/plasma [mass] movement, which also isn’t compliant with ‘Newtonian Mechanics’ (NM) either (unless the subject is gas/plasma [mass] loss from TOA).”
@suricat
This is a graph from a text book of tide physics.
“The sum of these forces deliver zero torque.”
The point I have mentioned is that first there is an increase of the sunspot frequency with increasing tides and the second is that the resulting rotation velocity because of a different radius resulting from valleys and hills out of the moving plasma holding the angular momentum constant. You cannot exclude that this delivers a torque..
“I can’t reconcile Sol’s spherical form with NM either. With Sol’s radius and rate of spin NM declares Sol to be ‘oblate’, but it isn’t. “
Agree.
“There must be other forces at work, perhaps electro-magnetohydrodynamics?
I really don’t know. But as I have written and shown, the neutrino capture rate from the sun correlates with the global temperature, and this shows that there must be a process that controls the fusion process in the inner Sun which is in correspondence to the tide dynamics on the surface layer. The Sun physics has different observables in the the inner Sun and the outer Sun. The outer Sun’s photons have times of about 150000 – 190000 years to jump from atom to atom until the surface, but the neutrinos have the velocity of light in vacuum. Because the fusion process is coupled always with the neutrino generation it is not out of the question that the generated heat function is different to the TSI function, from the surface layer.
An angular momentum has the dimension of [V A s s], a mass has the dimension of
[V A s s s / (m m m)], energy has the dimension of [V A s], there is no reason that gravitation must have a different nature than electro-magnetic fields of V/m and As/m.
“People speaking on the length in time of a sunspot period. But that is junk, because the correct scientific dimension is a frequency measured in [Hz] or [1/year]. This is necessary because only frequency can be connected to an energy using e geometric structure.”
“Yes, a mutual periodicity is necessary to establish a correlation between Celestial Mechanics (Stellar System Mechanics in this instance) and the observed behaviour of a Star, but what of the Stellar Mechanics that lead to the observed behaviour?”
Angular momentum IS. You cannot generate that, nor you can destroy that. The idea of causality is stupid, because it suggests that an effect FOLLOWS a cause (in time). But that is wrong. There is only an timless streaming energy in Planck’s constant h as a rotation, identical to an angular momentum because the dimension is identical. You cannot discriminate between both.
To come back to topic, I think it is more important to agree or disagree on the arguments given between the Sun’s heat and the tides from the planets, than to try to solve the physics of the solar system in detail first. You can observe tides and describe tides without knowing what mass IS. If you can decribe tides, you can describe the heat from the Sun and predict it. That’s the point
V.
Ray asks:
Why do we use the term ‘meridian’ with Sol, but use ‘equator/equatorial’ elsewhere?
The Sun is tilted at 7 degrees to the average plane of the planets.
tallbloke says:
“Ray, Hung found the planets elicited flare activity most frquently at certain angles from the meridian. 30 and 60 being strong ones. Suggests electro-magnetic linkage rather than gravito-tidal to me.”
That sounds extremely not electromagnetic to me, 0° and 180° makes sense, and is where Hung found the best correlation, although I can point to events at 90° (as Nelson notes) which contradict Hung’s idea that 90° is the lowest planetary index. He notes far fewer at 30°. To me they look spurious, due to two main reasons; 1) overlooking syzygies of other planets that the tidal model excludes, and 2) something that no one else has spotted as far as I know, is that there are sometimes “seed” alignments at 0.5, 1, 1.5 and 2.0 solar rotations before the flare date. My work on solar based long range weather forecasts supplies a suitable theory as to why this should happen at times. Which is that if the overall configuration of all the bodies is diminishing solar activity at the time of a major syzygy, flaring is inhibited until the next suitable alignments occur in a more augmented overall configuration.
It seems that the Steinhilber time scale is not just wrong by a factor, it seems after a new FFT job that there are some nonlinearity involved.
However, to get a picture on the question about a planetary control of the solar activity I have overlaid some FFT spectra from solar tides an d the FFT spectra reconstructed by Steinhilber and used by Abreu.
Because of the complex tide function of Quaoar and Pluto the FFT spectrum shows odd numbers of higher harmonics. It is not easy to identify theses modes in the Steinhilber FFT spectra, because of nonlinearities in the time calibration, but also because other tide functions with minor strengths are present.
But there is no doubt that the Steinhilber data contain solar tide functions from Quaoar and Pluto und this means that planets control the solar activity reconstructed by the isotopes in the samples and it means that Cameraon and Schussler are blind.
This relation is public since three years, but the climate mind war is still going on.
Good Night
V.
Anthony Watts says:
“I am so done with planetary cycles and the people who see such cycles affecting climate where none of relevance exists.”
It wasn’t worth pushing the point about the Jupiter orbital period anyway Rog, where Willis splits the data in half proves so.
Hi Ulric, we know the Sun is bipolar in its behaviour, favouring cycle lengths around the Jupiter orbital period or around the JEV period ~10.38yrs. Over the full length of the sunspot record it evens out, but in one half or another it doesn’t. So I don’t accept Willis’ analysis.
Anthony makes a claim from ignorance, but that’s par for the course. Not everybody has the time to closely investigate the phenomena, and he has Leif to keep him blindsided.
Rog, it takes 14-15 orbits of Jupiter for any JEV syzygies to be in a similar place in the orbit of Jupiter. Claiming that the Sun favours cycle lengths of Jupiter’s orbital period is rather abstract without some kind of physical reference point.
It’s the shape of Jupiter’s orbit that matters, it’s the reason for the run of short JEV periods in recent cycles.
Ulric, agree that Jupiter’s eccentricity and where perihelion occurs is important. My ‘claim’ s a simple observation, performed by Timo Niroma. Cycle lengths *do* cluster around 11.9 years at one end of the scale and 10.3 at the other.

Willis has a fair point, the first half of the series gave a 11.2yr peak, the second half a 10.4yr peak. That the 11.9yr peak shows up only on the full series has to mean it’s an artifact of long term averaging. I calculated it to be 11.865yrs from long term averages of 7.5 Venus synod JEV cycles.
They should cluster at 10.391 and 11.99yrs, because the JEV configurations alternate from cycle to cycle, 6.5 synods, then 7.5 synods.
OK, sounds viable and a good fit to data. 🙂
The variance due to the shape of Jupiter’s orbit will cluster longer and shorter JEV periods over 166 or 179 year cycles (maybe the half cycles too, I’ll check manually). The first half of the split data is the mean of 6.5 and 7.5 Venus synods (11.191yrs), it’s the second half at 11.391yrs that needs a proper explanation. Why so so strong on the 6.5 Venus synods on the latter half of the series?
sorry typo… it’s the second half at “10.391yrs”
The short term average cycle length would be 7 Venus synodic periods, though at 16 JEV cycles, one Venus synod needs to be lost to maintain the sync of the three bodies (112-1=111). So there’s an extra 6.5 instead of a 7.5 synod cycle every 179yrs from that too, and may help to explain why the maximum in SC 8 is less than 179yrs back. The next slip is at 666 Venus synods (one back to 665), giving an average length of 4044.87 days for the JEV cycle.
[…] No evidence for planetary influence on solar activity – Tallbloke's … https://tallbloke.wordpress.com/My Thanks to Paul Vaughan for alerting me to a new paper which has appeared on ARXIV purporting to rebut Abreu et al's 2012 paper 'Is there a planetary influence on solar activity?'. Paul has something to say about this … […]
In fact every 4th 665 has a slip too, it’s looking nearer to 4043.35 to 4043.45 days from that and the 4627.33yr cycle. I’ll settle with that 🙂
I now have time for promised follow up:
—
In the past I’ve shared this simple framework that falls cleanly out of well-constrained solar & geophysical data, Russian literature, & NASA JPL literature:
(22.2)*(6.4) / (22.2 – 6.4) = 9
(11.1)*(3.2) / (11.1 – 3.2) = 4.5
(22.2)*(9) / (22.2 + 9) = 6.4
(11.1)*(4.5) / (11.1 + 4.5) = 3.2
(6.4)*(1) / (6.4 – 1) = 1.185
(12.8)*(2) / (12.8 – 2) = 2.37
I’ve noticed that some solar-planetary enthusiasts insist on a role for:
Jupiter – Saturn = J – S = 19.86377916
Just in case it still hasn’t become obvious to everyone from the simplified tip, I’ve decided to enhance the tip by one more level.
Concise overview of how J – S fits the framework perfectly:
Solar Hale ~= 22
Solar Schwabe ~= 11
JEV beat calculations shown in comments here:
https://tallbloke.wordpress.com/2013/04/18/paul-vaughan-comparing-jupiter-earth-venus-alignment-cycles-with-variation-in-the-solar-rotation-period/ (cautionary aside: In an overheated discussion at WUWT a few days ago I saw a darkly ignorant &/or deceptive attempt to deflect attention to metrics of solar rotation based on different variables. Let’s be clear: Apples are NOT oranges.)
SEV & NEV beat calculations are analagous, giving:
SEV = 9.016173003
NEV = 4.497005011
Polar motion group wave = 6.4 (also Mayan calendar)
Heliospheric current sheet 3.2 (turbulent, so obscured to standard mainstream methods)
(22.10928125)*(9.016173003) / (22.10928125 + 9.016173003) = 6.404440015
(11.05464062)*(4.508086501) / (11.05464062 + 4.508086501) = 3.202220008
Sunspot North – South aggregate asymmetry = 9 (occasionally flips phase, thus extending for one cycle to 13.5 = 9 + 4.5 — I believe this may be a key clue about toroidal vs. poloidal // quadrupolar vs. dipolar components and tie in with Hiroko Miyahara’s work — planning to explore this quantitatively (via raw data exploration, not falsely-assumptive models) via 2 different avenues…)
LF (low frequency) ENSO = 4.5
(22.10928125)*(6.404440015) / (22.10928125 – 6.404440015) = 9.016173003
(11.05464062)*(3.202220008) / (11.05464062 – 3.202220008) = 4.508086501
Also note that the harmonic mean of 22.10928125 & 6.404440015 is 2(J-S) — i.e. the exact frequency of JS syzygies. (Request: TB, please acknowledge if you’ve absorbed this — thanks)
QBO & QB ENSO 2.37
Chandler wobble 1.185
(12.80888003)*(2.00000054) / (12.80888003 – 2.00000054) = 2.370066851
(6.404440015)*(1.00000027) / (6.404440015 – 1.00000027) = 1.185033426
Cross-ENSO annual-LOD envelope attractor 12.8
Cross-ENSO semiannual-LOD envelope attractor 11.05
Noteworthy: Every ~1500 years this SJEV framework laps the adjacent solar system boundary framework set by the highest & lowest frequency Jovian planets, J & N. Is this the D-O cycle? It’s worth considering. (I can provide more detailed info, including a detailed algebraic derivation at a later date — grossly insufficient time to organize the material at present.)
2.37, 1.185, 12.8, & 6.4 also show up in solar rotation, lunisolar cycles, Mayan calendar beats, & local weather. That’s way too much hierarchically-nested coincidence to be random. One commentator at Judy Curry’s Climate Etc. blog provocatively raised the question of whether a unified approach to solar system coherence is needed. Seeing a comment like that at a venue that is usually afraid of such topics suggests that the mainstream is beginning to realize how silly it looks to pretend that these layers upon layers upon layers of coherence don’t exist clearly in multivariate observational records. It was refreshing to see nature getting some due respect at a mainstream venue.
—
Sometimes old info only appears relevant in light of new info. The above assumes reader background. If anyone needs some of the assumed background pointed out again, please feel welcome to request that during the next 2 days.
Regards
making it even easier to see with simple clarity
copy & paste these into excel:
=(29.47303787)*(11.86630899)/(29.47303787-11.86630899)
=2*harmean(22.1092812464479,6.40444001524529)
(they give the same number (19.86377916) precisely)
reminders:
average solar hale cycle period = 22.1
average absolute barycentric radial acceleration period = 6.4
hiroko miyahara
—
related:
aggregate support for Ulric Lyon’s 111 year event series (mentioned above) can be found in recent (East)Indian solar literature — (limited details available upon request)
Cautionary Note: Be aware that claims about event series can be checked using a generalized class of wavelets — not the limited class referred to ignorantly &/or deceptively in the abstract here (a familiar paper that resurfaced recently in a WUWT article) — the authors either don’t realize or have refused to acknowledge the extreme flexibility of more generalized classes of wavelets that are (with adequate time & resources) widely extensible to mimic other kinds of time series analysis — that’s the neat thing about math: you can go around in circles between “different” (perhaps superficially) things if you invest the effort necessary to find and know the way. Math’s a big, humbling world. My guess is that even the best mathematicians see only a fraction of it’s connections during their lives, no matter how mathematically well-traveled they become.
Regards
Paul, I’ve read through and I’m really pleased to be able to say that I’m able to follow most of it. The same periods have been cropping up in personal comms with Ian Wilson recently, and I thing we’re all rapidly converging, which is great. Would you and Ian have time to put papers together by mid september for a paper-conference which will be published in a special journal edition later this year? I’ve been invited as guest editor. Email me.
In addition to the above arguments on a planetary control of the Suns heat periods there is an interesting parallel for the longer time periods of ice ages in the last millions of years, simply because the nature of non-sinusoid time periods exhibit higher harmonics also known in physics as modes or mode numbers. Taking the diffusion wave of photons from the inner Sun to the outer sun it takes about ~190 kilo years jumping from one atom to the next. But because of the sphere geometry of the Sun, there are resonances of higher modes with time periods well known from the Vostok data in kilo years
Dr. L. Lisiecki has reconstructed the temperature proxies from d18O isotopes for the last 5.3 Million years with corresponding temperature saw tooth like cycles of about 8K amplitude in the last million of years. (http://www.lorraine-lisiecki.com/stack.html). The last temperature increasing phase has happened at the end of the last Ice Age ~ 20 ky ago, and is now on a slighly relaxing phase still on a high level:
It has been shown that the oscillation pattern measured from d18O isotopes in the last 5.3 million years can be explained by this resonant diffusion modes in the Sun, as Bob Ehrlich has found out:
This is obvious when the Lisiecki spectra is FFT analysed:
The periods of Ice ages over millions of years have common scientific based oscillations with fixed stable time cycles, which easily can be calculated from the knowledge about physical modes in spherical bodies. This means that there is an explanation which says that the big Ice Ages on Earth are controlled by the oscillating heat power from the Sun, and it means that the heat power of the Sun can varying on a scale the global Earth temperature is varying about ~8K.
In general is to say that to simulate the climate tides it is necessary to take the natural real tide functions, because of the non sinusoid function; simple year periods of high precision in number have no natural base.in the solar system.
V.
Paul Vaughan says:
“Ulric Lyon’s 111 year event series (mentioned above)”
What where? I mentioned a correction to the JEV periods from 112 to 111 Venus synodic periods at 16 Schwabe cycles. Nothing about a 111 years event cycle.
@Paul Vaughan
From long term JEV, Hale is 8086.8days
J-N ave syzygy = 2334.33d
Following your calc’s, that gives:
7245.76d, with the J-S ave synodic period at 7253.45d
Why do the axial period of Hale and the J-N syzygy? does that mean anything? and does it matter that every 4th one is close to the J-S synod?
tallbloke says:
August 2, 2013 at 10:34 am
“Anthony makes a claim from ignorance, but that’s par for the course. Not everybody has the time to closely investigate the phenomena, and he has Leif to keep him blindsided.”
Maybe he feels the need to toughen his image after being seen to be taken in initially by Scaffetta’s fine window dressing. Willis, despite saying that he would love to find correlations, and has spent time looking, also is playing the cynic, by attacking the whole subject while not being that intelligent about the numbers. For Leif’s field, being able to make deterministic forecasts for space weather would be revolutionary, but maybe with the company he keeps, it would be firmly classified information.
Sorry, Roy Martin’s 111 year event series.
And Ulric: With absolute certainty it would be firmly classified knowledge if existent (even if it only came into existence recently through a public blog). The tides were once classified (for obvious, simple reasons). It doesn’t matter if it’s ignorance or deception. It matters that it’s dark either way: None of us needs to tolerate abusive stalking and harassment. If someone does that in person, you call the police and have them arrested. In Canada there’s a push to get the online criminal code updated (to reflect the changing nature of human interaction) after several high-profile suicides related to internet bullying. I support these efforts firmly, as well as simpler practical ideas such as blocking online stalkers’ internet access. (When someone systematically hunts down everything you say online and attacks it, that’s stalking.)
I think you’re misunderstanding something about what I’m saying about JEV vs. J-N, but at present I see no quick fix and resolving this isn’t a priority today, so I suggest our sensible, civilized option is to delay until it’s obvious how to efficiently dissolve our misunderstanding(s). Be assured that I watch what you say, understand your concerns, and reflect carefully upon your comments. I’m optimistic that under favorable conditions we can eventually reach better mutual understanding.
Finally, at some point in time it becomes impossible to hide the tides because there are too many people in the population who can rediscover them…. (i suggest we leave it at that for today)
cheers!
@Paul
Some academics are bound to become abusive when confronted with something new that essentially challenges their whole orthodoxy, it’s human nature, man up to it. You get the last laugh if you’re on the right track.
We actually could say that the skeptic movement is stalking and attacking the alarmist camp, and bullying them hard lol 😉
Restraint is the most crucial human capacity.
—
As always: Thanks for sharing your insights Ulric.
Volker Doormann says: August 1, 2013 at 6:32 am
Apologies for the delay. Kids are on holiday and the grand-children descended on me.
“This is a graph from a text book of tide physics.”
Yes, but as Tallbloke points out in the next post on this thread “The Sun is tilted at 7 degrees to the average plane of the planets.”, so the solar meridian doesn’t follow the symmetry in the graph. Thus, this looks more like mass loss at TOA and likely ‘does’ follow Newtonian Mechanics and would reflect a ‘tidal’ component of sorts, but this is ‘grasping at straws’. Isn’t it?
“The point I have mentioned is that first there is an increase of the sunspot frequency with increasing tides and the second is that the resulting rotation velocity because of a different radius resulting from valleys and hills out of the moving plasma holding the angular momentum constant. You cannot exclude that this delivers a torque.. ”
In a longitudinal line? No, I can’t. However, at the mass densities at Sol’s TOA its effect must be negligible as a ‘torque’ because tidal movement in a fluid gives a small torque on the flood which leads to a small ‘opposite’ torque on the fall. Any ‘overall torque’ from the ‘flood’ and ‘fall’ of tide is due to ‘frictional forces’, or a ‘static barrier to the dynamic flow’ (on Earth, a land mass).
In relation to ‘Sun Spot Activity’ (SSA) there’s also the anomaly of the ‘tidal equator’ being 7 degrees of angle out of coincidence with the ‘solar meridian’, but I suppose my greatest problem is with resolving your second point “the resulting rotation velocity because of a different radius resulting from valleys and hills out of the moving plasma holding the angular momentum constant.”. As I said for the “longitudinal line”, I see this only as a ‘hiccough’ for torque. Though it does bear the ‘stamp’ of a ‘Pilot Wave’ which may/not lead to vortices, but these, again, involve/invoke Newtonian Mechanics.
“Agree.”
Great!!! We agree that Non-Newtonian Mechanics are involved with Sol’s systemic make-up. All we need to do now is determine where these boundaries are. 🙂
To my suggestion that electro-magnetohydrodynamics may be involved you wrote:
“I really don’t know. But as I have written and shown, the neutrino capture rate from the sun correlates with the global temperature, and this shows that there must be a process that controls the fusion process in the inner Sun which is in correspondence to the tide dynamics on the surface layer. The Sun physics has different observables in the the inner Sun and the outer Sun. The outer Sun’s photons have times of about 150000 – 190000 years to jump from atom to atom until the surface, but the neutrinos have the velocity of light in vacuum. Because the fusion process is coupled always with the neutrino generation it is not out of the question that the generated heat function is different to the TSI function, from the surface layer.”
Volker you seem to contradict yourself here. Yes, neutrinos are a by product of nuclear fusion, their rate of production is an indicator to the rate of fusion activity somewhere within Sol and they emit at the speed of light ‘in vacua’ through mass as though mass was a vacuum, but they are so hard to detect/observe that it’s difficult to obtain resolution from observations. Then there’s the other problem of simultaneity. It takes “???” how many years for photons of energy from this inner energetic event (realised from neutrino emission) to emit from Sol’s surface?
Then again, you may be saying that the energy generation rate is inconsequential to the TSI rate for the ‘surface layer’ (radiative TOA), and I’ll concur. So long as the ‘radiative TOA’ energy emission sums equally with the emerging internal energy transmission to the ‘radiative TOA’ a ‘sink/source’ equilibrium must exist. We can’t accurately imagine future events though until we have accurate neutrino data spanning “150000 – 190000 years”? Neutrino observation doesn’t look like a way forward for current day Solar Weather Forecasting unless neutrino emission is shown to be a causal factor for this.
“An angular momentum has the dimension of [V A s s], a mass has the dimension of
[V A s s s / (m m m)], energy has the dimension of [V A s], there is no reason that gravitation must have a different nature than electro-magnetic fields of V/m and As/m.”
Sorry Volker, but I just don’t understand your math notation. I don’t enjoy ‘superscript’ in a ‘Word press’ environment and that’s why I always try to talk my way through the math as logic. Kinetic energy can be expressed as ‘1/2 Mass x Velocity^2’. The logic behind the ‘Velocity’ factor is that this not only quantifies the speed, but also denotes the ‘speed’ at a given direction, thus rendering the term a ‘quantified vector’. I’ll not go on from there other than to say that gravity is a ‘weak’ force, whereas magnetism is a ‘strong’ force and I don’t understand how you can consider that their ‘nature’ could be ‘similar’.
“Angular momentum IS. You cannot generate that, nor you can destroy that. The idea of causality is stupid, because it suggests that an effect FOLLOWS a cause (in time). But that is wrong. There is only an timeless streaming energy in Planck’s constant h as a rotation, identical to an angular momentum because the dimension is identical. You cannot discriminate between both.”
Volker. You’re now confusing ‘mass properties’ with ‘EM radiation’!
Angular momentum IS ‘generated by the altered inertia from a force that alters the inertial vector of a mass’!!!
This is “generated” by a force that is continually vectored at an angle to the original trajectory of the mass and can be “destroyed” by either removing the force that alters the inertial vector, or place the ‘force’ in opposition to the ‘inertial vector of a mass’ causing the mass to come to an inertial ‘relative rest’ (it’s all ‘relative’). ‘Inertia’ is a property of mass, momentum (angular, or straight line) is what inertia can be influenced to be in a ‘reference frame’ considered to be ‘at rest’. ‘At rest’ within a reference frame, a ‘mass’ is considered to possess ‘potential’ (this is all to do with ‘kinetics’)
Effect ‘always’ follows cause. Events always lead to an ‘outcome’ and there’s no getting away from this ‘time-line’.
A word on the ‘Planck Constant’. Though this factor began its life in chemistry, it has brought a clarity of understanding to energy transfer composition through to the level of current day spectroscopy. Spectroscopy is, naturally, our main sphere of interest when making observations of Sol and other Celestial bodies when observing ‘EM’ (Electro-Magnetic) radiation (or ‘photon based’ rather than ‘particle based’) data.
For spectroscopic observation, the ‘Planck Constant’ (dominant wave length) is the greatest amplitude for all the included frequencies from the ‘test’ observation. If the energy ‘spikes’ at this frequency then OK, but if there is a ‘flatter’ response this may well lead to ambiguity. This usually means that we need to reduce the ‘frequencies’ (wave-lengths) that are under analysis and a ‘line by line’ analysis is undertaken, but for TSI the entire spectra of EM emission needs to be observed from the IR spectrum, inclusively, through to the gamma ray spectrum.
“To come back to topic, I think it is more important to agree or disagree on the arguments given between the Sun’s heat and the tides from the planets, than to try to solve the physics of the solar system in detail first. You can observe tides and describe tides without knowing what mass IS. If you can describe tides, you can describe the heat from the Sun and predict it. That’s the point”
Yes, “That’s the point”. For a physicist ‘correlation’ is only the beginnings of a ‘paper’. The ‘meat’ of a ‘good paper’ is describing the ‘connecting mechanism’ as well.
For example, what can possibly interfere with the ‘mass movement’, on Sol, from tidal surge? Well, we have ‘plasma’, which is electrically charged, and we’re trying to ‘move it’ ‘en mass’ by tidal surge. When we have a ‘moving charged particle’ we also have a ‘current’. A ‘current’ generates a ‘magnetic field’. Can you see where I’m going from here?
Best regards, Ray.
suricat says:
August 4, 2013 at 1:44 am
“For a physicist ‘correlation’ is only the beginnings of a ‘paper’. The ‘meat’ of a ‘good paper’ is describing the ‘connecting mechanism’ as well.
For example, what can possibly interfere with the ‘mass movement’, on Sol, from tidal surge? Well, we have ‘plasma’, which is electrically charged, and we’re trying to ‘move it’ ‘en mass’ by tidal surge. When we have a ‘moving charged particle’ we also have a ‘current’. A ‘current’ generates a ‘magnetic field’. Can you see where I’m going from here?”
Not really, Ray.
“Sorry Volker, but I just don’t understand your math notation. I don’t enjoy ‘superscript’ in a ‘Word press’ environment and that’s why I always try to talk my way through the math as logic. Kinetic energy can be expressed as ’1/2 Mass x Velocity^2′.”
It seems to be my problem that I have a different understanding on physics an logic as the communitiy of physics. Because of that there are not many agreements in scientific discussions.
Your logic tells you that in principle Energy [E] = Mass x Velocity^2. And Mr. A. Einstein has covered this formula to the expression: Energy [E] * Mass [M] x light Velocity [c]^2 . There is only a problem in physics not only with the term ‘velocity’ but also with a term of a ‘velocity^2’. Physics is not able to observe both, simple because neither space not time are physical observables. Moreover a velocity is in contradiction to the statement that a time is locked to its location and not to other locations. You cannot speak on velocity without to violate this claim. Because of that Mr. Einstein’s formula in physical nonsense.
A correct expression therefore is: Mass [M] = Energy [E] * µ0 x* ε0.
Because of the value of µ0 of 4 * pi * 10^-7 [V * s / (A * m)] and the value of ε0 of 8.85416 *10^-12 [A * s/(V * m)] and the dimension of energy [E] of [ J = W * s = V * A * s] the dimension of mass is [V * A * s] x [(s * s) / (m * m)]
I wrote _wrong_ above: “An angular momentum has the dimension of [V A s s], a mass has the dimension of [V A s s s / (m m m)], energy has the dimension of [V A s], there is no reason that gravitation must have a different nature than electro-magnetic fields of V/m and As/m.”
The correct dimension of mass is of [V A s s s / (m m)]
A Mass of 1.7801 * 10^-36 [V A sec^3 m^-2] is equal to an energy E of 1 eV.
But still holds that Planck’s constant h has the value of 6.62606957(29)×10^−34 [J * s] or [W * s* s] or [V * A * s * s].
The dimension of angular momentum is [V * A * s * s]
The dimension of torque is [V * A * s]
This means that a torque is an energy [J]
The dimension of the gravitational constant G is [m^5 * s^-5 * V^-1 * A^-1]
If you multiply the gravitational constant G with a mass the dimension is [m^3 * s^-2] and repeats J Keplers 3rd law as a geometric law without any physics, because space and time are not observables in physics.
There is no mechanism in geometry.
Higgs says: „Mass of quant is nothing else as their interaction with a field which is alocal and constant.
Robert Ehrlich writes: “One the most widely-cited estimates of td from Mitalas and Sills(Mitalas,1992) is 1.7×10^5y = 170ky. We have repeated their calculation, and obtained 190 ky.”
From logic it is clear that oscillations of about 100 ky need a different geometry as oscillations of 1 ky (little ice age) and minor, and that the processes must are different.
I’m not an expert in solar physics. But the correlation of the shifted sun spot number frequency with the decreasing and increasing global temperatures tells me that this coherence must include a physical process which controls the heat current streaming from the warm Sun along the surface of the Earth and into cold space.
The frequency shift of the average Sun spot number frequency is a fact. And this fact correlates with the global heat trends. The global heat trends are explained by geometrical solar tide functions of the tide frequencies of the planetary couples.
Sorry for the long text, but it should make clear the topic critique.to the paper in discussion.
Greetings
Volker
JEV = 11.05464062
V-E =
(1.00000027)*(0.615172098) / (1.00000027 – 0.615172098) = 1.598563486
Nearest JEV harmonic:
(11.05464062) / 7 = 1.579234375
(1.598563486)*(1.579234375) / (1.598563486 – 1.579234375) = 130.6064407
@Paul
Why divide a virtual (average) JEV by 7 ?
Ulric, I think Paul is calculating the period over which JEV comes back to the original alignment. It so happens that it is a not dissimilar period Bart and I found for the ‘long period harmonic’ of the DSP analysis of the Sunspot series peaks at around half the J-S syndic and Jupiter orbital. 😉
Bart said:
The sunspot count appears to reflect the energy of these combined processes at around 20 and 23.6 years, which necessarily has apparent periods of 0.5*T1, 0.5*T2, T1*T2/(T2+T1), and T1*T2/(T2-T1) years, or 10 years, 11.8 years, 10.8 years, and 131 years.
The thing is, as I said in the Jupiter jackpot thread:
“When we use the actual orbital periods rather than the DSP analysis estimates this works out at 122 years”
So maybe we need to re-run this calc with the period you mentioned the other day in relation to Timo Niroma’s solar cycle length distribution plot? I can’t remember it, what was it? 7.5x VE?
According to Paul’s VE figure, that would be 11.989226145 years.
And for his JEV harmonic number, 1.579234375, it would be 11.8442578125 years
That nicely bracket’s Timo’s 11.9 years for the most common cycle length at the longer end.
Doing 7.5 sevenths of a virtual JEV (of the wrong length too!) is even more of a muddle. I was the asking the reason for dividing the virtual JEV by seven in the first place. I would call it esoteric.
Eh? It’s not a ‘virtual JEV’ it’s the average JEV cycle isn’t it? Which gives a figure close to the average Solar cycle length.
What is your JEV period and components?
Mind you, if we take a more accurate long term JEV period of 4043.4 days:
4043.4 / 7 x 7.5 = 4332.2 (Jupiter orbit)
EV synod = 583.922d
Ulric says:
EV synod = 583.922d
Which is 1.5987255 years, if Wiki answers is right that the Earth years is 365.24218967 days.
365.25636 sidereal I think.
It’s because 15 ave JEV = 14 Jupiter orbits (very close)
Thanks, I was looking at tropical year.
So, 583.922/365.25636=1.59866347
Paul has 1.598563486 or 0.0001yr or ~1 hour difference.
Paul’s JEV 11.05464062*15=165.8196093 years
14*11.862=166.068
I make that 90.726 days out.
So doing what Paul did with 4043.4 / 7 and 583.922 comes out at 146.7yrs. I don’t see the validity of seeking a harmonic between those two figures.
What you want to look at is the beat of 4332.589 with 4043.4.
Ulric Lyons says:
“What you want to look at is the beat of 4332.589 with 4043.4.”
It’s amazing how much difference 4332.2 or 4332.589 makes to the beat period. The latter figure was from here: http://nssdc.gsfc.nasa.gov/planetary/factsheet/jupiterfact.html
OK so over 179yrs there will be 9 x 6.5 Venus synod JEV’s and 7 x 7.5 Venus synod JEV’s. Then through every 166yrs the 6.5’s and 7.5’s will cluster up this way and that because of the shape of Jupiter’s orbit.
Q: So where exactly is the seventh of the average JEV period for each E-V synod to form a beat with as Paul suggests?
A: The average JEV period is virtual not real, so it cannot.
Anyone with the TheSky astronomy program, have a look at this. Set to 11th Jan 2014 (heliocentric mode), and step at 583.922d for 14 steps. That’s the JEV center for SC26, notice how E+V are now opposite Jupiter, so the full astronomical cycle is two Hale cycles or 28 Venus synodic periods.
But by the time four of these 28 synod cycles are completed, one Venus synod has to be lost to maintain the JEV synchronicity. This gives the extra 6.5 Ve synod cycle every 179yrs, at the loss of a 7.5 one.
6.5*9 = 58.5
7.5*7 = 52.5
52.5+58.5 = 111
The next slip as I wrote earlier, is at (6*111)-1 = 665, and then at (665*4)-1 = 2659 Ve synods, by which point you can get a pretty good JEV average figure; 384 x 4043.35572
Ulric Lyons says:
“What you want to look at is the beat of 4332.589 with 4043.4.”
It’s amazing how much difference 4332.2 or 4332.589 makes to the beat period. The latter figure was from here: http://nssdc.gsfc.nasa.gov/planetary/factsheet/jupiterfact.html
4332.589 with 4043.4 = 165.48 years
4332.4 with 4043.4 = 165.94 years
That’ll put Earth nearly 180 degrees different.
so the full astronomical cycle is two Hale cycles or 28 Venus synodic periods.
Or around 44.7 years, which matches the temporal spacing of the beach ridges in Northern Siberia and around Hudson Bay.
Back to Rhodes Fairbridge and Hillaire Marcel’s 1977 paper, as mentioned in the encyclopedia of world climate:
To whom it may concern.
Only real solar tide functions fit with the global sea level oscillations and the part of the solar heat function.
The solar heat function is modified on Earth by the impedances of the ocean oscillations. Because of the definition of the MEI, the global temperatures are delayed by 1/e * the chandler wobble period of 433 days = 0.436 years or 159 days.
V.
@Rog
You missed there somewhere..
4332.589 is 165.84968yrs
4332.2 is 166.05816yrs
4332.4 is 165.9509yrs.
So what’s the 111yr signal in the Hudson staircase?
http://www.crawfordperspectives.com/Fairbridge-ClimateandKeplerianPlanetaryDynamics.htm
I just spotted that King-Hele got the ratio of Jupiter orbits to the average solar cycle wrong:
“This essay began with a mention of King-Hele’s work. King-Hele was able to identify a cyclical process referring to the return alignments of Jupiter, the center of the Sun, and the center of gravity of the Solar System (the barycenter). This King-Hele cycle is 177.9394 years. An now, we find that 1/15 of this cycle gives the period of Jupiter, and 1/16 gives the mean Sunspot Cycle.”
As I showed above it is 14:15
It seems to be useful for an understanding of the periods involved with the solar system to separate the Earth eigen periods from the tide periods on the Sun. This is necessary to separate heat source and heat resistor or heat impedance. A heat resistor creates no heat power and also a heat impedance like a oscillating Earth ocean creates no heat. This means that the ENSO describes a temperature profile over time, but has no creation effect as many people belief.
That the ENSO or MEI is an Earth eigen function can be shown by the analysis of 140 years data of the MEI. Analysing the ENSO data as MEI for 140 years using the chandler wobble frequency of 0.84547 y-1, many integer and half integer subharmonic modes can be easy identified in the FFT spectrum.
There are only two frequencies visible, which are not part of the chandler sound. Fist it is the 10:1 resonance of the chandler frequency and the Jupiter frequency, and second it is the twice the frequency of the SSN frequency of 11.196 y-1.
This gives input for a fine simulation formula to compute the MEI over any time. And this would be helpful to investigate on the solar tide functions not disturbed by the Earth noise.
After this it becomes very clear that solar tide functions and especially the fast ones are connected to the global temperature overlaid by the MEI noise and the volcano drops.
V.
Volker;
The ratio of El Nino to La Nina episodes/conditions varies, generally colder periods have had more El Nino conditions. This can effect upper ocean heat content over decades.
@Ulric Lyons
That’s a fallacy. It would mean that the ocean streaming balance is not zero, But over a long time (from 1871 onto now) this is impossible.
If there is an offset in the MEI then it is an accuracy error from the data.
The mean value form 1707 MEI values is -0.010813
>> MEI
Number of values 1707
Sum -18.458
Minimum -2.56
Maximum 3.349
Mean -0.010813
Standard error 0.024028
95% confidence interval 0.047066
99% confidence interval 0.061817
Standard deviation 0.99272
Critical K-S stat, alpha=.05 0.033
<<
Volker,
Some ENSO history studies for you: http://www.co2science.org/subject/e/ensogw.php
.ENSO is a negative feedback to external solar forcing not an internal oscillation.
Volker Doormann says: August 4, 2013 at 12:32 pm
“Not really, Ray.”
Then I’ll spell it out. Sol’s fusion product consists mostly of electrons and protons. Electrons are more easily accepted as being the active part of an ‘electro-motive force’ (-ive voltage [electrons]), but protons are also a part of an ‘electro-motive force’ (+ive voltage [electron holes]).
Following this production/dissociation, the ‘fusion product’ always tries to ‘re-form’ and neutralise the ‘potential difference’ (electro-motive force [EMF]), but the turbulence generated by Sol’s rotation rate makes this difficult and generates potential differences much greater than those seen in ‘lightning events’ in Earth’s atmosphere. Incomplete re-combination is evident in the ‘effluvia product’ (solar wind) from Sol, of which consists of both electrons and protons in varying ratios (perhaps a data-point to mark for future ref. [‘mixing ratios’ within Sol’s interior should show in Sol’s effluvia]).
Efforts to ‘re-combine’ electrons and protons in Sol’s upper atmosphere result in enormous electrical currents, which in turn result in enormous magnetic fluxes. When it comes down to ‘rock, paper, scissors’, it seems that ‘magnetism’ trumps ‘gravity’. Thus, the ‘gravity mechanics’ for Sol is ‘trumped’ by the ‘magnetism’ (magnetohydrodynamics) induced by the ‘electrical effect’ of plasma in motion (electro-magnetohydrodynamics [for want of a better explication]). Sol isn’t ‘oblate’ because of this.
Where I’m going. Newtonian physics doesn’t account for the ‘magnetic phenomenon’ that impedes mass migration. Tidal surge of mass media is suppressed by ‘electro-magnetic’ actions that aren’t recognised as a ‘mutual attractor’ when consideration is made for the action of a variant gravitational force to Sol. The ‘force’ may well affect the ‘Planck constant’ in consideration with the ‘TSI’ (Total Solar Insolation) value.
“It seems to be my problem that I have a different understanding on physics an logic as the communitiy of physics. Because of that there are not many agreements in scientific discussions.”
I’m not a ‘physicist’ Volker, I’m an ‘engineer’. I’ll not get into this argument because as soon as we mention ‘pi’ we’ve introduced an undefined definition that defies its origin. Math proponents insist that it derives from the radius, but engineers, like me, insist that it’s a derivative of the diameter. Who’s to say who’s right? We need to understand our differences and agree to disagree. 🙂
We ‘engineers’ do, generally, understand our ‘alternative’ perspective of the world. We know that our ‘math’ is only an ‘approximation’ of reality and that ‘relativity’ ‘doesn’t compute’ for us (that’s why we allow ‘error margins’). However, without our ‘perspective’ the inconsistencies that lead to ‘relativity’ wouldn’t have been apparent.
“Sorry for the long text, but it should make clear the topic critique.to the paper in discussion.”
Whatever the length of your text Volker, I’ll always give it a read. However, I would appreciate a link to some educational source that would ‘enlighten’ me to your math model. You have my interest, but I hope it’s not above my ability to learn. 🙂
Best regards, Ray.
“ Ulric Lyons says:
August 7, 2013 at 11:15 pm
ENSO is a negative feedback to external solar forcing not an internal oscillation.”
I do not believe in repetition.
V.
„suricat says:
August 8, 2013 at 4:44 am
Volker Doormann says: August 4, 2013 at 12:32 pm
“Not really, Ray.”
“It seems to be my problem that I have a different understanding on physics an logic as the communitiy of physics. Because of that there are not many agreements in scientific discussions.”
We ‘engineers’ do, generally, understand our ‘alternative’ perspective of the world. We know that our ‘math’ is only an ‘approximation’ of reality and that ‘relativity’ ‘doesn’t compute’ for us (that’s why we allow ‘error margins’). However, without our ‘perspective’ the inconsistencies that lead to ‘relativity’ wouldn’t have been apparent.“
“Sorry for the long text, but it should make clear the topic critique to the paper in discussion.”
Whatever the length of your text Volker, I’ll always give it a read. However, I would appreciate a link to some educational source that would ‘enlighten’ me to your math model. „
Ray, the problem is that you have not said _what you have understood_ of my arguments.
It is senseless to me to discuss here solar tides, gravity, angular momentum and Keplers laws, and at least relations between solar tides and global Earth climate, if there is no common base on engineers units.
It is a common understanding in the engineers community that energy has the dimension of Newtonmeter [Nm] and that a force [N] has the dimension of [kgm/s^2]. This means that energy has the dimension of [kg m^2 / s^2] and is equal to the dimension Joule [J], while [J] is defined as [Ws] and Watt is defined as [VA] and [V] are Volts and [A] are Amperes. Ampere is a definition.
You may have noticed that the mass of the Higg’s boson is measured to 125.3 GeV/c^2 and not in kilograms, and as I have written that 1/c^2 is = µ0 * ε0, I do write 125.3 GeV s^2 m^2. µ0 and ε0 are the electromagnetic field constants. and contain no time effects and no space effects.
V.
Amazing how some scientists can see the connection between solar system and earths climate and others can’t
Dr Willis and scientists like Cameron et al also had no chance of finding the connection
as the 60 yr global temp’ cycle is in phase and locked to 6 cycles of the schwabbe in terms of timing exactly
If you don’t select the appropriate time sample you would miss the connection
Dr wilis sample size should at least capture the 200 yr cycle or at minimum the 60 yr cycle
l would have thought
If he had of taken cycle 21, 22 and 23 he would have captured the upward phase of the 60 yr cycle commencing in 1975 and finishing 2005 at the chandler wobble anomaly perhaps .
1975 .The great climate shift. Into warming phase
To capture the downward phase of the 60 yr global temp cycle, he would see that 60 yr cycle trending down from 1942 to 1974. Encapsulated by schwabbe cycle 18, 19 ,and 20 exactly!!
( data commencement starting and finishing about 2 yrs before solar minimum at the beginning and end of the schwabbe tripletsPS )
The variation of the lengths of the schwabbe cycle account for the description of the 60 yr cycle as quasi as its length is governed by the length of the sum of schwabbe cycles in triplets for each phase
2 * 3 ( schwabbe cycle) = one unnamed 60 yr cycle
Hope the algebra is correct
Can we please name this cycle!!?
The connections between solar cycle length and global temperature for this 60 yr cycle become important for globaltemperature trends
If solar cycle lengths are longer in the upward phase the linear upward trend is longer..
If solar cycle length is shorter in the upward phase the upward temp’trend is shorter
Haven’t calculated this but it seems logical.
Hypothetically extending this notion
To achieve a global temperature decline on a 60 yr scale
Shorten the solar cycle length in the upward phase( 30yr ) of 60 yr cycle and lengthen the solar length of the downward phase ( 30 yr)of the 60 yr cycle )
Because global climate is solely governed by cycles. The sampling method becomes crucial as does the statistical methods
If you pick a period at peak or trough you will see no trend..as the trends cancel
I would imagine
PS of interest in TB’s 45 yr cycle article
Fairbridge et al 1977 suggested
quad sets of the schwabbe cycle for the 45 yr ..
This has not happened since cycle 18. THey have been triplets
Enjoying the insightful research from the posters here.
What a great compilation of material on this topic.
Some information l have noted from this post for my own personal interests
from here and may be useful to others
includes
Lots of great info here. I was wondering what to contribute.
Whilst there is lots of discussion on ratios of these solar system variables currently on other threads
I noted from Paul V’s posts the following re-occuring ratios of the number 2..
This number interests me personally as many of the earths climate oscillations are biennial ( quasi 2 year)
The QBO and Indian ocean dipole l think would be examples
No idea if there is any connection
..
Anyway the number 2.. Also found in Dr V Doormans spectrum of MEI data . as a spectral peak
in ENSO
THe QBO phases( biennial= ~2 ) are linked to ENSO so the number 2 must be in the MEI power spectrum..
I would think
I have found from my personal studies that there is a correlation between the length of phase of the QBO and La Nina
I found the QBO had an extended phase length in a La Nina period but an pattern was not noted for an El Nino
If QBO mean = as Ian Wilson has suggested
2×CW = QBO = 2 ½×DY = (2/10)×TJ = (2/10)×SJS – SVE
Then a longer QBO cycle infers that something in that equation must shift to preserve equality?
Maybe the chandler wobble shortens to compensate for a longer length QBO in a la nina?
This would be easily testable
or?
————
The number 2 in Paul V’s posts
===================
QBO and QB Enso =2.37
Chandler wobble = 1.85
2.37 : 1.85 = 2 ( 1.9999999)
Biennial link??
————-
Hale cycle 22
Schwabbe cycle 11
22 : 11 = 2
——————–
quote
“The folllowing show up in solar rotation, lunisolarcycles mayan calender beats
2.37, 11.85, 12.8, 6.4
12.8 : 6.4 = 2
2.37 : 1.185 = 2
———————-
6.4( polar motion) : 3.2 ( helios ) =2
——————-
SEV : NEV
9.00 : 4.5 = 2
==============
TB from beach ridge study
Gleissburg 90 yr : 45 yr terrestrial oscilation = 2
also from that article
356 yr cycle : 178 yr cycle = 2
THanks for thelinks TB. I am getting to read your most excellent blog..
Volker Doormann says:
“I do not believe in repetition.”
But you should know that observation trumps theory, every time.
El Niño/Southern Oscillation (ENSO) is the most important coupled ocean-atmosphere phenomenon to cause global climate variability on interannual time scales. Here we attempt to monitor ENSO by basing the Multivariate ENSO Index (MEI) on the six main observed variables over the tropical Pacific. These six variables are: sea-level pressure (P), zonal (U) and meridional (V) components of the surface wind, sea surface temperature (S), surface air temperature (A), and total cloudiness fraction of the sky (C). These observations have been collected and published in ICOADS for many years. The MEI is computed separately for each of twelve sliding bi-monthly seasons (Dec/Jan, Jan/Feb,…, Nov/Dec). After spatially filtering the individual fields into clusters (Wolter, 1987), the MEI is calculated as the first unrotated Principal Component (PC) of all six observed fields combined. This is accomplished by normalizing the total variance of each field first, and then performing the extraction of the first PC on the co-variance matrix of the combined fields (Wolter and Timlin, 1993). In order to keep the MEI comparable, all seasonal values are standardized with respect to each season and to the 1950-93 reference period.
http://www.esrl.noaa.gov/psd/enso/mei/
“ Ulric Lyons says:
ENSO is a negative feedback to external solar forcing not an internal oscillation.
But you should know that observation trumps theory, every time.”
The topic of this thread is the question whether there evidence for planetary influence on solar activity or not.
I do not like the term ‘solar activity’, because it says nothing but activity, but if it includes a heat load beaming out of the Sun to heat the Earth I can take that term. Speaking about a planetary influence I think it needs observable real planetary functions which are observable on the global Earth temperature.
I have argued that there is a problem with the impedances of the ocean currents streaming from the equator to both hemispheres controlled in the frequencies given by the chandler wobble of the Earth axis eigen frequency of 433 days or a 10:1 Jupiter resonance. Because of several subharmonics of the chandler frequency as ‘echo’ of the impedances of the oceans there is a time delay from the ENSO oscillation function that is overlaid on the solar ‘activity’ controlled by the tides of planetary couples. An impedance is a time depending passive resistance without any heat generation. The hole system is a heat current supplied by the Sun’s heat streaming to the earth with its oscillating ocean currents determined by the impedance frequencies like an ‘echo’.
To test this idea you can eliminate the echo of the MEI or ENSO from the UAH global temperatures:
After the subtraction of the MEI function from the global temperature function there remains
A red curve. Yo can compare this red curve with blue curve. The blue curve is compiled by the fast solar tide functions including Mercury/Earth of 6.30 periods per year. This result confirms the idea that the solar activity is influenced by the planets. It is clear that a constant time shift of the MEI function cannot fit the result perfect, but it makes clear that the MEI or ENSO is a mainly terrestrial oscillation which echos the solar activity function with its eigen resonances of the Earth’s ocean currents.
Just for the records.
V.
V
Weak trade winds (giving El Nino conditions) are associated with negative AO/NAO conditions (which are solar forced) http://www.nc-climate.ncsu.edu/climate/patterns/NAO.html
Volker Doormann says:
“Speaking about a planetary influence I think it needs observable real planetary functions which are observable on the global Earth temperature.”
That cannot be done without understanding how ENSO type effects respond to the solar signal. One can predict local land temperature deviations from the weekly/monthly average by predicting essentially the AO/NAO and where the jet stream flow will be, with heliocentric planetary analysis of the solar signal. But for average global temperature, you need to know the oceanic response to the solar signal, which is often inverse in key regions.
Ulric Lyons says:
August 8, 2013 at 4:45 pm
Volker Doormann says:
“Speaking about a planetary influence I think it needs observable real planetary functions which are observable on the global Earth temperature.”
That cannot be done without understanding how ENSO type effects respond to the solar signal. „
I just have shown and explained in detail and in a graph exact this.
I think it is senseless to argue here the topic further. Wasted time.
V.
Volker Doormann says: August 8, 2013 at 7:28 am
“Ray, the problem is that you have not said _what you have understood_ of my arguments.”
How can I tell you, ‘what I’ve understood’, when I can’t recognise the math model that you use?
“It is senseless to me to discuss here solar tides, gravity, angular momentum and Keplers laws, and at least relations between solar tides and global Earth climate, if there is no common base on engineers units.”
Now that’s just a ‘slap in the face’ for engineers and I’ll ask for an apology for that remark!
Just because ‘this engineer’ (me) doesn’t recognise your math model, isn’t to say that ‘all’ engineers fall into a group that can be categorised as “It is senseless to me to discuss here solar tides, gravity, angular momentum and Keplers laws, and at least relations between solar tides and global Earth climate, if there is no common base on engineers units.” because our ‘host’ is also an engineer! Is that correct Rog?
If that remark is ‘true’. Why are you here?
Why ‘engineers’ are so good at what they do and why ‘engineers’ are so diverse in their disciplines?
Taking the latter point first, an engineer chooses a career in a given ‘direction’ (discipline) and the education received in that direction also branches into ‘other disciplines’. It’s the ‘nature of the beast’ (engineering). Secondly, “‘engineers’ are so good at what they do” because of the ‘cross discipline’ teaching received during their chosen ‘direction’ instruction.
IOW, engineers are instructed/taught to ‘separate/pull apart’ systems to their basic component configurations and then observe their interactions and processes from there onwards.
FWIW, I think your model ignores attractors.
Ray
@Rog
I found the 111 year signal. Funnily enough it’s staring me in the face with what I messaged you about.
Volker Doormann (July 30, 2013 at 11:10 am) wrote:

=
Logic tells us that there is a correlation between the frequency shift of the average sun spot frequency and the global temperature on Earth.
=
_______
Solar-Terrestrial-Climate 101
” suricat says:
August 9, 2013 at 2:18 am
Volker Doormann says: August 8, 2013 at 7:28 am
“Ray, the problem is that you have not said _what you have understood_ of my arguments.”
How can I tell you, ‘what I’ve understood’, when I can’t recognise the math model that you use?“
I do not know what a ‘math model’ should be. I do know the science of algebra, and AFAIK it is acknowledged in Sumer, in Persia, in Russia, and in many more countries. Omar Khayyam from Persia has written a lot of books about algebra, and he was the first scientist, who could solve cubic roots from numbers. Astronomy has used for a long time a system based on the number 60, taken from the mathematicians from Chaldea
[π = 3.141592654 = 3, 8, 29, 44, 0, 47, 26, 21].
We do make use of this system in geometry and time, for minutes and seconds, but we make also use of a system based on the number 10.
The formulas I have written are based on the system based on number 10, and the notation of the character ’^’ means that the number following the ‘character ’^’ is the tenth power of the base number.
What is a math model?
“It is senseless to me to discuss here solar tides, gravity, angular momentum and Keplers laws, and at least relations between solar tides and global Earth climate, if there is no common base on engineers units.”
Just because ‘this engineer’ (me) doesn’t recognise your math model, isn’t to say that ‘all’ engineers fall into a group that can be categorised as “It is senseless to me to discuss here solar tides, gravity, angular momentum and Keplers laws, and at least relations between solar tides and global Earth climate, if there is no common base on engineers units.”
Ray, you wrote: “Kinetic energy can be expressed as ’1/2 Mass x Velocity^2′.
So it is possible to compute the kinetic energy W from a Mass m measured in [kg] and a velocity v measured in [m/s] and the engineers unit is [kg m^2/s^2].
Since we make use of the physics of electromagnetism about ~200 years ago we make also use of the units Ampere [A] and Volt [V] and the equivalent of [V] is [kg m^2 / (A s^3)].
Because of this it is well known that 1 Joule [J] = 1 [Ws] = 1 [VAs] = 1 [kg m^2/s^2]
Because of this a Mass [kg] is equal to a Mass [VA sec^3/m^2] and
Because an energy of 1eV is equal to 1.6^-19 Joule [J],
a mass m of 1.7801 * 10^-36 [V A sec^3/m^2] is equal to an energy of 1eV.
This is not a math model, it is an application of the system of engineering units.
„I think your model ignores attractors.”
I think that the consequence to clean the sciences of physics from the unit [kg] and to make use of the unit [GeV s^2/m^2] similar to the physical scientist who are discuss the mass of the Higgs Boson, reduces the number of dimensions in physics to [V/m] and [As]. While [A] is a arbitrary definition, the unit [As] is connected inseparable in Amperes or seconds to the charge of an electron. This reduction includes all units in physics and also the angular momentum L [V As s] and Planck’s constant h [V As s]. And the latter does mean that the nature of Planck’s constant is a rotation:
“The Planck constant of action has the dimensionality of specific relative angular momentum (areal momentum) orangular momentum’s intensity.”
s. http://en.wikipedia.org/wiki/Planck_constant
Different to the idea of a transfer velocity in physics the idea of a field without any space or time has advantages to understand nature.
One example is the ohmic impedance of the vacuum of 377.7 [Ohm] of [V/A].
R = 377 [V/A] = (µ0/epsilon0)^-2 =
(4Pi*1.0*10^-7 [V sec / A m] / 8.85416*10^-12 [A sec / V m]) ^-2 =
141926.2 [V*V/A*A]^-2 = 376.7 [Ohm] .
This impedance has no location and no time, but a reality in nature.
The square root law of the strength of the solar tides from the solar tide period suggests that Sir Newtons force idea is not applicable to understand the relation between solar tides from planetary couples and the global temperature where the ENSO ‘echo’ sound is retained.
BTW. I have visit a basic school for 9 years. And have worked for 50 years in the range of RF-technique inclusive visible coherent light, x-ray light, and x-ray vacuum tube design of cathode electron output for 300 kW anode power. I never have visit a school for engineers or a university.
I wrote here because of the wrong claim in the subject. But I think it was a fault. Pardon for the intrusion.
VOLKER

I was interested in your graph of solar tides
I have never graphed ENSO against solar tides.
Could you explain what solar tides mean on your graph?
I have taken a snap of your graph and used the unadjusted global temp data, your solar tides and superimposed the Nino 3 SST index and also have marked the SOI switch which occurs every 6 months close to the solstices.
One SOI switch in May/JUNE and the other one DEC/FEB
I was interested that your solar tides also has 2 switches each near the solstices.
Somewhat identical to the SOI annual cycle (~ May to ~May)
The solar tides seem strongly linked to the SOI switches and annual phase… !!
in timing that is but not phase necessarily the phase of SOI ( pos/neg)
THe pattern of solar tide seems regular and constant
Does this occur all the time over a longer time series?
The SOI year commences at the ~ May/JUne solstice and peaks at the ~Dec/FEb solstice
If you map a 5 month weighted mean SOI graph from May toMay..you will see the annual SOI phase that looks like ( eyeball)the sun spot cycle..time series.!!!
Here is your graph posted below ,with my annotations superimposed
highlighting global temp, solar tide , Nino 3 SST and SOI switch points
Note that global temperatures were out of phase with Nino 3 SST in 2012 ( May to May cycle)??
The SOI annual cycle starts in May/ JUNe and finishes mostly 12 months later
Why are Global temps exactly !! out of phase with the Nino 3 SST last season (JUly 2012 toJuly 2013)??
Likely..Global temp cycle has a different frequency to equatorial pacific temperature cycle
Global temp does not always follow NINO SST ..?? Exceptions like the recent 2012Autumn to autumn season (oz)
GRAPH here
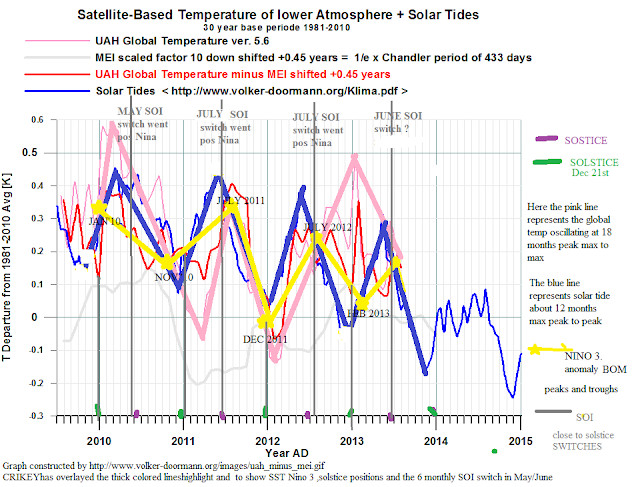
Link has zoom feature
https://picasaweb.google.com/110600540172511797362/TIMESERIESAndTrends#5910091225708874530
SOI 5 month weighted mean
http://www.bom.gov.au/climate/current/soi2.shtml
Nino 3
http://www.bom.gov.au/climate/enso/indices.shtml?bookmark=nino3
Leif was on about a ~100yr signal in solar activity. Recently he upped that to ~107yrs, ~110.5yrs would be a good target to agree on. Then I can show him the direct astronomical reasons for the collapse of solar cycles 24 and 25, and the astronomical forcing of the near exact year of solar maximum for every sunspot cycle in the whole series.
“Paul Vaughan says:
August 9, 2013 at 3:38 am
Solar-Terrestrial-Climate 101
http://img94.imageshack.us/img94/3161/zlp.png”
[Reply] Can you show us your solar tide curve projected back to 1750 and forward to 2050 please Volker. Thanks – Rog
Is Leif S whistling a new tune or is this just a joke?
‘yes, the planets are driving our climate’
” crecey says:

August 9, 2013 at 1:47 pm
VOLKER
I was interested in your graph of solar tides
I have never graphed ENSO against solar tides.
Could you explain what solar tides mean on your graph?”
Sure. The blue curve is a summation of several solar tide functions. The used solar tide functions are compiled out of 14 planetary neighbour couples including the objects Quaoar, Pluto, Neptune, Uranus, Saturn, Jupiter, Mars, Earth, Venus and Mercury.
From FFT analysis it can be learned, that the strength of the different tide couples are follows a square root law of mean solar tide period. A main function of about ~900 years corresponds to the solar tide period of the couple of Quaoar and Pluto.
First you have to compile the absolute synodic function of the tide function of each couple from the ephemeris within 0° for the hole time window (3000 BCE to 3000 CE possible). But because the tide function is twice in the frequency of the synodic function you have to fold the function at 90° and take the absolute value between > 0° and < 90°. Now you can shift the function by minus 45° to become a symmetric function between -45° and +45°. You can scale down that function to -1° and +1°. The value of -1° corresponds now with a nip tide and a value of +1° corresponds with a spring tide on the Sun. The correlation is that a nip tide correlates with a global cold phase and a spring tide with a global warm phase.
Now you can sum up all functions with its strength factor from the square root of the tide period. A last step is a shift to the baseline of the temperature which is used as zero. Ready.
OK?
V.
[ Can you show us your solar tide curve projected back to 1750 and forward to 2050 please Volker. Thanks – Rog ]
OK, Rog, but please take into account, that the solar tide function does not include the volcano effects, and not the echo’s from the ocean resonances (ENSO).
V.
[Reply] Thanks, interesting.
@ crikey
„The pattern of solar tide seems regular and constant
Does this occur all the time over a longer time series?“
Yes over some 5 millennia and more:
V.
@ crikey
There are no solstice phases in climate.
Looking to the fast climate anomalies, the Mercury/Earth synodic tide function is remarkable, because its phase is coherent to the sea level oscillations. While the synodic period is of 3.15 periods per year, the tide period is twice with 6.30 periods per year and its peaks do occur also in the temperature.
Alls these ocean index is not physics. That are numbers. That what would be helpful is a formula which describes the echo’s in time function given by the solar tide function heat power to the earth geometry. The echo is not the source of sound, it is a passive impedance.
The geometrical basis for the echo is the sphere of the Earth and the rotating axis frequency of 433 days (Chandler wobble frequency) and the slave functions of subharmonics to be seen as QBO as second subharmonic mode in the atmosphere and so on. A simple ANSYS model should help to solve this geometric problem.
V.
correction:
>> First you have to compile the absolute difference angles of the synodic function of the tide function of each couple from the ephemeris within > 0° and < 180° for the hole time window (3000 BCE to 3000 CE possible). <<
V.
Volker Doormann says: August 9, 2013 at 12:06 pm
“I wrote here because of the wrong claim in the subject. But I think it was a fault. Pardon for the intrusion.”
Pardon granted, but my claim was that ‘other systems are involved’ to uncover the ‘mechanism’ that leads to ‘the link’ between ‘correlation’ and ‘energy transfer’.
Volker, I think that I really should give you more ‘slack’ (be more ‘forgiving’) with your posts. It seems evident to me that your first language isn’t English and that your input is significant, but only discloses ‘correlation’ and not the method/mechanism of/for ‘energy transfer’ (for ‘energy transfer’ think of the system loss [rated as the inverse of efficiency] that is ‘attracted’ into neighbouring systems).
Am I wrong?
BTW, I also do harmonics. 😉
Best regards, Ray.
What Volker Doorman & Tomas Milanovic say about echoes is crucially important. Even where there are identifiable macro & mesoscale attractors, spatiotemporally turbulent multipath signals are lacing through regionally/locally. More than just naive, it’s blindly naive to pretend the spatial dimensions don’t matter. I recommend heeding William Hsieh’s cautions about overfitting and being very careful in determining exactly which stats are obscured only by noise (that can be overcome by central limit theorem). Anywhere falsely assumed “noise” is actually systematic multipath bias, naive algorithms are just nonsensically overfitting on the basis of a fundamentally contextually-corrupt methodological paradigm. That isn’t helpful. In many cases it has been seriously misleading. It’s fine to use naive algorithms for preliminaries in a course of data exploration, so long as everyone’s lucidly aware of limitations.
suricat says:
August 10, 2013 at 2:55 am
. . . only discloses ‘correlation’ and not the method/mechanism of/for ‘energy transfer’ (for ‘energy transfer’ think of the system loss [rated as the inverse of efficiency] that is ‘attracted’ into neighbouring systems).
Am I wrong?”
Ask yourself whether there is a system loss in the mechanism of ‘energy transfer’ between a planet and the neighbouring Sun on an elliptical gravitaional path over millions of years. I’m off. My aim here was to show astronomical facts between solar tides and terrestrial climate to prove the claim in the subject wrong, as I have told several times. All other is intrusion, OT and/or wasted time.
V.
THe maths is out of my league DR Dormann but the concept l can deal with
I like the concept of solar tide incorporating the ‘sum of ALL planets’
That makes sense because the earth is enclosed in a system ( solar system)
and Fibonacci patterns of the solar system demands order and precision
No part of the solar system is an island
By looking at Jupiter and Saturn alone is like looking at just the wheel of a bicycle and not the whole machine
Your long term solar tidal model shows a steep descent post 2005
This is like the Archibald step down prediction of global cooling
Are you predicting global cooling and of what magnitude?
I assume this step down in solar tide is like the saw tooth wave phenomena ..seen when many cycles constructively amplify
Also of note is the trough in solar tide at 1900 ( base of cool period) and the step incline to 2005 ( a warming period)
This upward period is ~105 yrs
The downward phase was 1820 to 1900 ( cooling phase) = ~ 80 yrs
A net global warming over the 2 phases
Do you link your solar tides to any of the well known cycles like the DE Vries cycle or the gleisburg cycle?
This solar tidal cycle looks quite short considering it encompasses the entire solar system.
The ~1968 strong solar tide inflection point is very near the great earth climate shift of 1977
There appears to be a shorter frequency oscillation in your longer term solar tide record
from
of ~50 yrs ( up/down) and full sine wave cycle ( up/down/up/down) = 50 + 50 = 100 yr cycle
If l was going to raise doubts regarding the long terms correlation with temperature l would
question the shortness of data period
Volcanic activity can only arrest global temp trend for 2-3 yrs
The 1810 period looks like an out of phase period with global temperature indicating at least another variable/ frequency related to global temp’cycle
Is your quasi annual solar tide cycle linked toscafetta 1.09 Saturn/Jupiter cycle
If it is l would expect my observed quasi anual SOI switch , shift forward about a month every next year l guess ( 1.09 )
In ~1950 there was an increased frequency change in Enso sst pattern ( inflection point/step change)
Congratulations on your work and findings. Just mind blowing really
@ crikey
„THe maths is out of my league DR Dormann but the concept l can deal with”
I sometimes have trouble with algebra, never have taken lectures on it, never have written a dissertation, only some few papers about my experimental work on magneto-optical material on a Job defined for an engineer of physics, I never have graduate to. Let me tell you, that the math is adding and subtracting excel like columns of about 32000 lines, while the columns have to multiplied by a factor k, the square root of the half synodic period. that’s all. Additional there is a one time IN download of all the heliocentric positions of the 10 planets on the ecliptic circle for the years between 1 AD and 3000 AD with an interval of 30 days. This is possible on several servers using the NASA ephemeris software with a precision of arc seconds for the hole time range. It’s a mouse click or 10 in hole. That’s the job.
There are no mysterious secrets on, or personal secrets on. I think the rules of addition an subtraction are well known, except to climate sceptics, they trust in nothing. I think, that’s the reason, why these simple geometry of the solar systems frequencies has been refused and ignored since over 3 years by the professional and amateur authorities of sceptics. As I has said, that I have found the GHI on the 11th of February 2010, people wont to have a proof and would have a proof for my competence in astronomy.
http://gruppen.niuz.biz/astrologie-t504379.html
Very sad.
One can forget all prominent cycles in years. There are no cycles in years in the solar system. Relevant are real astronomical frequency functions and terrestrial frequencies of the Earth axis and its subharmonics building the ocean impedances. The short drops in temperature from the volcano’s do not change the frequency laws of climate. I have just refined the solar tide function a few in respect to the MEI retained UAH curve.
I do own an old DOS PC and a small Windows 7 PC. I was wrong to believe that there is a science community. It is not. I’m on my own. They kick you off.
V.
The sidereal orbits have to be involved in harmonic agreement, because the orbits are not circular.
You should publish a paper on your composite solar tide theory.. Volker.
It is unique in l think that no one has ever tried to define the sum of all planetary tides and provide the link to earths global temp’
.
Someone on here should help you publish your work … Assist an aspiring and talented researcher
Don’t be perturbed about poor responses and being kicked off forums etc . It happened to Landcheidt and others and look what happened to poor Dr scafetta on WUWT..
Planetary discussion on the climate banned!!
scandalous
Your composite solar tidal theory …is great .. Up with the best.
.Good luck with your publishing..
Lampooning the scientific method by pontificate bullies is nothing new . A wise man like yourself would know that. Just keep up the good debate.. You are not on your own.. with this problem of obnoxious climate bullies ruling the roost..
The great divide ….AGW vs CYCLES
———————————————
Question..
What ‘astronomical frequency function’ occurred around the 1975-1977 great climate shift?
There was a great shift..in climate..
One associated shift ..There was a change of phase of the AMO (pos) 1977- 2010 was the zero anomaly line ( 33 yrs)
.
What astronomical function or solar system arrangement was associated with this time period.
Conjunctions/ synods , alignments etc
Is it possible to look at the planets positions pre and post 1975?
The hardest thing is getting the dates correct..
1972 or 1975.. What was happening astronomically( planetary)
Link?
—————————————
I want to find out how 3 AP index cycles shifted global temperature up ..with NO LAG?
and
how 3 AP index cycles shift global temp’ down …with no lag?
Down global temp’ phase
————————-
1943 to 1975 = 32 yrs .
.total of solar cycle lengths( cycles 18/19 and 20)
= 10.2 yrs + 10.5 + 11.7 = 32.4 .. AV / MEAN ( 10.8)
years of temp decrease.. to ..the sum of solar cycle length … 32 : 32.4 = 0.99
years of temp decrease.. to.. Mean of 3 cycles .. 32yrs : 10.8 = 2.96
rate of temperature decline for the downward phase in global temp’ was = ~ minus 0.37 deg C per century between 1942 and 1975
SSL( sum solar cycle length) : global temp change of minus 0.1 = 32.4 : minus 0.1 deg C = 324
Up global temp’ phase
——————————–
1975 to 2005= 30 yrs ..
total of solar cycle lengths ( cycle 21, 22, 23)
10.3 yrs + 9.7 yrs + 12.6 yrs = 32. 6 yrs Av / mean ( 10. 866)
years of global temp’ increase to sum of solar cycle length 30 yrs : 32.6 = 0.92
years of global temp’ increase to mean of 3 cycles .. 30 yrs : 10.866 = 2.76
sum of solar cycle length : global temp change in the up phase = 32.6 yrs : 0.6 deg c rise = 54.3
—————————
Not sure what l have achieved here
The mean solar cycle length of each of each of the solar cycle triplets is ~ 10.86 yrs
I cannot see from those figures that solar cycle length is related to the steep change in temps post 1975?
Unless l have misunderstood the math.
Where else to look?
The shift in global temps is related to the solar triplets and a flip in phase some how l think
“ Crikey says:August 11, 2013 at 12:59 pm
What ‘astronomical frequency function’ occurred around the 1975-1977 great climate shift?
There was a great shift..in climate.. “
@crikey
There is the Blues Brother movie today in TV, and we will have popcorn to night.
Sorry, but I’m done with the peer high society after three years of knocking on the doors of ignorants. Crikey, go on, check yourself. If you take a look between the hadcrut4 anomalies and the MEI and the solar tide function you can see that there is a El Nino about 0.47 years prior to the hadcrut4 increasing peaks, and some El Nino conditions after 1977. I wrote on this above. If you subtract the time shifted MEI function from the hadcrut4 function you get the solar tide function
I do not know, what superpositions of same polarity phases of all the MEI ocean oscillation modes create, but I think this is the core question to solve. Take the ANSYS FEM software and solve it
There is only a little help now, to forecast the temperature, because of the 0.47 year delay of the MEI in the temperature function.
I think it is out of the scope of a blog to discuss events or fractions.
I have a saying: ‘There is nothing complicate in nature, there are only a number of simple relations’.
V.
Volker Doormann says: August 10, 2013 at 7:05 am
Well I’ve tried, but I haven’t been much help, have I. 😦
FWIW, your calculations are impeccable, but they only tell part of the story. I fully concur that there are planetary tidal ‘influences’ on Sol, but how does this affect Sol and Earth’s climate?
a). We don’t observe ‘tides’, per se, on Sol.
b). Sol’s TSI only measures a difference of ~!% from the ‘established’ luminosity for Sol.
From here we can only question ‘why’ “We don’t observe ‘tides’, per se, on Sol” and challenge “the ‘established’ luminosity for Sol”. Personally, I think the way to establish Sol’s tidal reaction is by using ‘first principles’ from ‘magnetohydrodynamics’:
http://en.wikipedia.org/wiki/Magnetohydrodynamics#Importance_of_kinetic_effects
Then prove that the ‘Planck Constant’ doesn’t provide a true marker for the “‘established’ luminosity for Sol” (solar constant):
http://en.wikipedia.org/wiki/Planck_constant
http://en.wikipedia.org/wiki/Solar_constant
Whilst the ‘modern’ version of the “‘established’ luminosity for Sol” shows greater variation to Sol’s ‘EM’ (electromagnetic) output than the ‘older’ version, there is ‘no reference’ to, or comparison for affect upon, Earth and it’s climate which includes ‘particle emissions’. What is Sol’s ‘particle bombardment’ behaviour? For example, I understand that a ‘CME’ (Coronal Mass Ejection) can produce an immediate warming effect to Earth’s surface when it hits.
I’ve referenced wiki because you can access the link in your native language should you wish to do so. 🙂
All the best.
Best regards, Ray.
Thanks for your response Volker.. and suricate and all.
I am doing some checking Volker and l am very impressed on the correlations l have found posted

here
and zoom feature from this link
This is just one of my libraries of correlation work
https://picasaweb.google.com/110600540172511797362/TIMESERIESAndTrends#5911170409411458482
The link between your ‘solar tide’ graph and the pacific and the SOI ( Pacific atmosphere) is incredible
Your ‘solar tide’ function is in phase with SST anomalies in the pacific.
I have superimposed your ‘composite 14 planetary tidal signal on Nino 1.2
( Nino 1 and 2 cycle is leading the pacific in this time period of data)
Your comment about a 0.45 shift for MEI and global temp is not uncommon or lag time between ENSO and global temperature
Various authors have some degree of lag they adhere to..
The most wonderful thing about this finding is that ENSO is a cycle. not just a mass of chaos
Enso is oscillating in phase with the motions of 14 planets and our sun at minimum
as you have defined as solar tide
You must look further at solar tide frequency
It is exactly like my SOI inflection point findings
The SOI has inflection points during the period ( May/June , July)
and ( DEC/ FEB)
at the inflection point SOI either changes phase or doesn’t change phase. at 6 monthly intervals ( 0.5 yrs)
That should be seen in something like fourier transform analysis
Best described by a logic circuit.
Change phase if ….
Else…..
Your solar tide algorithm also has quasi 6 monthly phase ..
Check it out
Do you agree.
The SOI cycle, the pacific SST temperature cycle and the Vulker 14 planetary composite solar system tide cycle are incredibly in phase ( quasi 0.5 yr.=.one phase . )
( up/ down phase is quasi 11-18 months?)
between 2009 and 2013 data analysed
I noticed the solar tidal function incorporates short and longer term frequencies
You have noted a downward trend in the solar tide VOLKER
How do you measure the amplitude/size of the solar tide. Its going down?
Inferring a Coolingpacific
Of interest is your projection of solar tide. Firstly the current downward cycle since about May 2013 is projected as a decline to peak at minimum trough November 2013
Ha,, That’s interesting as it inferring a continued cooling of the Nino 1+2 pacific for the rest of 2013
THat is consistent with my own primitive calculation of the current Nino 3.4 frequency
I also notice that you have a forecast for an even deeper cooling of the pacific going into 2015!!
and further into this century..
long term solar tide forecast is global cooling until ~ 2050 which is consistent with other solar/planetary forecasters
The merit of your algorithm is credible from my own personal investigations..
Another question..
What is the dynamic forces of the planets in your calculations of composite solar system tide
Its not really a solar tide is it..??
Newtonian mechanics of the planetary masses?
If l was an enrepeneur.. I would sign you up immediately and publish your findings..
Can someone put there hand up to assist Volker in publishing..
You have established the cause of the ENSO cycle as far as l can see.
THe lag issue is insignificant
I helped with the SOI.cycle loink… LOL
Actually your findings are quite revolutionary!!
.
[snip]. No edit function
By the way.Volker. I mentioned in the first analysis in an abovepost, that the MEI and Your solar system tidal model seemed out of phase at June 2012 to May 2013
an investigation and help from a fellow forum member at AV weather..Real climate..assisted me in finding the likely cause
You used UAH data.. and during that time period UAH appears to throw out a rogue hot value of 0.5 deg C. Far higher than other models.. This would contribute to an apparent out of phase year.
Also ..THe SST’s during that period were very volatile in that period and seemed perturbed by another variable.
Enjoy your popcorn and movie..
I will start building an ark for the cool pacific that gives La Nina conditions and Australia Rain and floods
What does a La Nina give Germany and the UK ?
„crikey says:
August 12, 2013 at 12:53 pm
Enso is oscillating in phase with the motions of 14 planets and our sun at minimum
as you have defined as solar tide“
Sorry crikey, that is not correct. In phase is the global temperature sound, with the solar tide function of 14 planetary couples, when the global temperature is cleaned from the 0.44 y shifted MEI or SOI function.
The main points are: (i.) The ENSO is locked to sphere geometry of the rotating Earth with its coriolis effects, and (ii.) the ENSO free global temperature is locked to the solar tides, baut can have drops from significant volcano effects.
“Your solar tide algorithm also has quasi 6 monthly phase ..”
The algorithm of the sum 14 solar tide functions with period times from ~900 years to 6.3 periods per year has many frequencies, also because of the complex tide functions from the elliptic pathes.
“You have noted a downward trend in the solar tide VOLKER
How do you measure the amplitude/size of the solar tide. Its going down?“
The analysis of the long term temperature data shows, that there is a square root law between the solar tide time period an the amplitude of the temperature frequency. This make the little ice age structure more visible, then the Mercury/Earth tide period of 6.30 periods per year.
Because of that the main function deceased after ~2000 AD until ~2040 AD. This decrease is also part of the decreasing rend in the high resolution plots of 2010/2013.
„long term solar tide forecast is global cooling until ~ 2050 which is consistent with other solar/planetary forecasters”
Yeas, but they have no idea about the nature of the geometry. It is still cycle repition.
“What is the dynamic forces of the planets in your calculations of composite solar system tide
Its not really a solar tide is it..??
Newtonian mechanics of the planetary masses?”
I don’t know. It is for sure solar tide. It needs a special discussion about what’s going on the surface locations of fluids where a gravitation occurs without any time delay from a velocity. There is no time delay in the paths of the planets. If there is no time delay, the idea of a Newtonian force is not applicable. Physicists must explain this dilemma.
“If l was an enrepeneur.. I would sign you up immediately and publish your findings..”
It is public since 11th February 2010:
Click to access ghi_solar_s.pdf
http://www.volker-doormann.org/frequencies_of_climate.doc
„Actually your findings are quite revolutionary!!”
Yes, I think it is the most important discovery in astronomy since Johannes Kepler has discovered his third law. But the sceptics don’t trust revolutionary discoveries. I’m suspect all over the climate world and the idea is a taboo in the climate community.
V.
Volker Doormann says: August 12, 2013 at 8:08 pm
Happy to see that you haven’t gone yet Volker.
“It needs a special discussion about what’s going on the surface locations of fluids where a gravitation occurs without any time delay from a velocity. There is no time delay in the paths of the planets. If there is no time delay, the idea of a Newtonian force is not applicable. Physicists must explain this dilemma.”
From what I’ve learned from other ‘physics fora’ in the past, gravity’s influence is established at the speed of light (this needs verification). Thus, Earth’s gravitational influence on Sol would be established ~8 minutes ‘retrograde’ of Earth’s current position. More distant planets would invoke a greater time-span for the ‘lag component’ due to the ‘propagated effect of gravity’. In the physics world, it would seem that ‘nothing’ can be ‘instantaneous’ (pardon the logical pun).
A time lag ‘does’ exist between planetary ‘motion’ and the planets ‘tidal’ forcing to Sol. Thus, NM seems okay up to this point, as long as relativity is accounted for, but the surface/interactivity of Sol doesn’t respond in the same way. An attractor is involved which makes ‘interpolation’ necessary.
Best regards, Ray.
I have printed off your research papers and will read in the coming days Volker with great interest
Expect questions as l am an astronomical beginner
Oh ..Yes we have how many planets in the solar system..? wikopedia says 8..
and the asteroid belt … does this need including in your composite model.?
You choose 14 planetary couples
8 planets coupled by permutations and combinations yields many couplets
Why did you choose only 14?
I find a half year phase lag between your composite planetary tides and global temp’ exceptionally small given we are talking the ..Solar system.
Why is the sun not coupled in your calculations
Sun/earth sun/venus …etc
————-
Volker said
“The analysis of the long term temperature data shows, that there is a square root law between the solar tide time period an the amplitude of the temperature frequency.
I think l understand this
You are saying there is a simple relationship between the composite planetary tides frequencies and global temperature
You specify the 900 yr frequency as a major frequency which peaked in 1100 AD and again at 1997/98 AD
897 yrs for the last quasi?cycle
The square root of 900 = 30 magnitude/amplitude
The inference is that the peak of 900 yr cycle gave some decent ‘oomph’ to the global temp record
whether at max or minimum.
THe trough at 1700. THe Maunder minimum
The De vries cycle at ~ 200yr gives an amplitude value of the square root of 200 = 14.14
So that infers if the 900 yr and 200 yr cycle constructively align . THe resulting magnitude / impact on global temps would be the sum of the square roots of each cycle
30 + 14.4 = 44.4
Now of interest about this topic of constructive interference of cycles
Qian and Lu (2010)
Calculated 4 cycles reaching max amplitude between 1992 and 2004
THe 21 yr cycle , 62.5, 116 yr, and 194. 6 yr
and now we can add a 5th cycle maxing at the turn of the century
Now ALL of these cycles are going down together at a magnitude of the relationship you mention
So
Square root of all of those frequencies
900yr cycle = 30
194.6yr = 13.99
116 yr = 10.77
62.5yr = 7.9
21 yr = 4.58
THe sum = 164.5
Now that would be a horrendous decline in global temperature not seen since the last glacial perhaps
BUT
What if the smaller cycles were multiples of the larger primary 900 yr..
Just adding the smaller higher frequency cycles amplitude values maxing at 2000
gives ~approx
14 + 10.8 + 8 + 4.6 = 37.4 !!!!
(Archibalds shows a steep downward curve from 2014
Could it be of magnitude 37.4 !! )
Furthermore this additive of the square root of key frequencies , clearly shows how these frequencies constructively combined to escalate global temperatures as they approached modern maximum at 1998
Ha..
Take out the square root of the 62.5 yr ( AMO/ PDO? )cycle and you have 3 cycles( 195+ 116+ 21) = the 900 yr cycle = 30 magnitude..
The 900 yr cycle a sum of smaller cycles…( 195..116..21 ) ?
Thanks for your help.
You were talking about an astronomical calibration point .. 1998 perhaps ..
5 cycles at maximum node
THe mayans had 2012.. 14 yrs out?
Actually.. The fibonnacci series is infinite ..So no calibration point but there are nodes of reference to solar system time like 1998
————————————–
question
Can the sum of all the planets / moons and sun of their gravitational tides move the ocean and atmosphere in decadal and millennial time scales.
Newton.. For every force there is an equal and opposite force?Blah blah??
@ surcat
Volker says: “Ask yourself whether there is a system loss in the mechanism of ‘energy transfer’ between a planet and the neighbouring Sun on an elliptical gravitational path over millions of years. I’m off. My aim here was to show astronomical facts between solar tides and terrestrial climate to prove the claim in the subject wrong, as I have told several times. All other is intrusion, OT and/or wasted time.”
Surcat says: „ From what I’ve learned from other ‘physics fora’ in the past, gravity’s influence is established at the speed of light (this needs verification). Thus, Earth’s gravitational influence on Sol would be established ~8 minutes ‘retrograde’ of Earth’s current position.”
Yes, you and many people say so. The problem is, it is OT here, its an idea of Mr. Einstein, and the idea is wrong, it’s an unproved claim, and fails to answer your question, and fails to show a system loss in the mechanism of planetary energy transfer moving in perpetual motion over millions of years on paths which are precise follow to the geometric relations Kepler has found out, and do not follow unstable paths because of a delay of time from a gravity force.
If there would be gravitational delays of times involved in the motion of the celestial bodies it would not be possible to forecast eclipses with an accuracy of seconds. There is no term of a light velocity in the astronomic formulas of time and space. If there would be a delay in the interaction of Quaoar and Sun there could not be a relation of 285.96 years for the period and the half axis of 43.405 AU ( 43.405 = ³√ 285.96² ). The light needs 499 seconds for 1 AU, and 21659.3 seconds or 6 hours and 59 seconds for 43.405 AU to Quaoar. If there would be a gravitational interaction, each interaction would have a delay of 6 hours from Sun to Quaoar and back from Quaoar to the Sun. No one can explain why each planetary motion is stable after Keplers geometry when there must be a delay of minutes or hours which effects the bodies and how.
V.
crikey says:
August 13, 2013 at 1:42 pm
[…]
Newton is dead.
A force has the dimension [V/m * As], it is a product of an electric field and an electric charge.
“You choose 14 planetary couples
Why did you choose only 14?”
It’s a limitation of the CPU in my PC. You can make use of all couples; there seams only a rule that couples of very different periods have a loss in the tide strength. Check it.
“Why is the sun not coupled in your calculations
Sun/earth sun/venus …etc“
The Sun is the generator of heat. This generator is the geometric centre of tide functions given by always two bodies as spring tides and nip tides. The nip tides of the bodies Quaoar and Pluto are coherent with the little ice age temperature profile. This means that there is a reduction in the heat generation on the Sun in contrast to the spring tide constellations, when two bodies in one line with the Sun on the ecliptic. This suggests that only the resulting field on the Sun of two (neighbour) bodies has an effect on the generator. This is not the case, if only one body is running around the Sun. But there may an exception, because the Earth is one time a year on 3. January near the Sun, and do receive about 7% more heat power then on 3. July. This may be the reason of the El Nino start at xmas some days before and echoes along the oceans in the hemispheres.
„You specify the 900 yr frequency as a major frequency which peaked in 1100 AD and again at 1997/98 AD
897 yrs for the last quasi?cycle
The square root of 900 = 30 magnitude/amplitude“
I do not believe in cycles. There are no cycles in science. Forget cycles.
There are geometric functions in astronomy and especially tide functions of elliptic oscillating frequencies of two bodies do show that. It is nonsense to speak on cycles. Only by comparing tide functions with terrestrial ‘bad’ temperature reconstructions can bring light it this geometry.
I do not know, what you have calculated. As I wrote there is a square root function between the mean tide period and the strength of the tide. But a square root of a period in years is not equal to a global temperature in ° Celsius, based on a defined time interval in a century.
Therefore it needs a scale factor k to calculate all 14 temperature frequency functions and sum them up. In this graph the factor is k is the square rot of the period divided by 5.
Until there is no physical mechanism known which allows a calculation of heat currents and heat beams from the Sun we have take a scale factor to show the coherence of he functions.
There are well reasons for a square root function of the tide strength from the tide period and Hung has pointed out that.
“Can the sum of all the planets / moons and sun of their gravitational tides move the ocean and atmosphere in decadal and millennial time scales.”
I don’t know that and I don’t think on this. I have given my (3) claims here above and the way to verify the solar tide function. It is simple science work.
V.
Could you give me an example please
What exactly is temperature frequency ? 1/y ?
If temperature FFT power is 1.8 and temperature frequency ( 1/y)? is ?
Trying to understand this
————————————–
“a power peak of a 1000 yr period is 10 times stronger than a power peak of a 10 yr period.”
So a power peak at 900 yrs is stronger than a 200 yr or 100 yr or a 20 yr or a 11 yr peak..
Ok .I have seen this in my studies
query on this statement / anomaly
Yet… you have mentioned in your Fourier analysis that ” the 200 yr power peak is 5 times more powerful than the 900 yr power peak”.?
seems to contradict?
Why is De Vries more powerful? A key to the dynamics perhaps
——————————————————————-
You say
” this indicates a physical cause ”
. That is why l asked if combined planetary motion can move oceans.
The ocean sea level is higher in the east pacific during an El Nino dominant period on decadal scales
and the Nth pacific has lower sea level during a negative PDO ( pacific decadal oscillation during the ~ 30 yr phase
Sea level on both sides of ocean basins are directly correlated with global temperature…!!!
TIDAL
THe depths of the atmospheric layers vary with decadal phase
Both tidal and solar perhaps
———————————————–
You mention the outer planets Pluto and Quators tidal couplet . as linked to global temperature.
So geometry of the solar system bodies is linked to balance of forces and temperature. on earth?
as a proposition
If the net planets mass were all skewed on one side of an imaginary line through the sun .
The solar system mass would be heavier on one side..
THe tidal attrative forces would make the bulges and effect ocean sloshing across basins and solar tides..
This is a physical process
I would not throw Newton out with the ‘Babys bath water’ yet
Newtonian physics predicted Neptune
In the 1840s, using Newtonian mechanics, Urbain Le Verrier predicted the position of the then-undiscovered planet Neptune after analysing perturbations in the orbit of Uranus.[
from wikopedia..pluto
————————————————————–
The heliocentric tide function of pluto / Quaoar couplet is interesting as you have found its ‘function’ correlates with the global temperature trends generally
Why is this?
The temperature power peaks of global temperature are always offset to the left or shorter in peak by about 10 20 yrs except at power peak 330 yrs where both the pluto/Quaoar couplet and global temp’ are aligned
Some sort of lag there or ?
—————-
How do you think the Chandler wobble frequency relate to the sun of 14 planetary tidal couples?
——————-
your quote
“Newtons dead”
Ha … Noticed you quoted newton .. By HUNG in your research paper
Newtons law of linear motion…
—————————————–
KEPLER..studied Golden numbers phi.
why does the sum of 14 solar tide functions vary?
Is that due to the distance between the couples at any point in time or geometry in general
Mods.
I’m told I’m making my posts too quickly, but it’s 2 days since my last post! What the heck is going on???
Best regards, Ray.
„crikey says:
August 14, 2013 at 1:29 pm
What exactly is temperature frequency ? 1/y ?
Why is De Vries more powerful?
So geometry of the solar system bodies is linked to balance of forces and temperature. on earth?
Why is this?
Some sort of lag there or ?
How do you think the Chandler wobble frequency relate to the sun of 14 planetary tidal couples?
why does the sum of 14 solar tide functions vary?”
@crikey
In harmony with the topic of this thread I think it is not good to talk about my special solar tide relation with the global climate.
My thank to Rog.
Thank you for your interest.
V.
Crikey and Volker. Why not reconvene on Ian Wilson’s previous Chandler wobble thread?
tallbloke says: August 15, 2013 at 8:36 pm
“Crikey and Volker. Why not reconvene on Ian Wilson’s previous Chandler wobble thread?”
Sorry TB. I’ll stay quiet here.
Best regards, Ray.
Ray, not telling anyone to be quiet. Just offering a relevant venue for developing discussion.
tallbloke says: August 16, 2013 at 10:19 am
Perhaps TB, but I think was getting OT anyhow. 🙂
Best regards, Ray.
Here’s something for Cameron & Schussler to think about:
Solar-Terrestrial-Climate 101 (.pdf)
Click to access Vaughan%20130804%20Solar%20Terrestrial%20Climate%20101.PDF
I recommend that they think carefully.
Volker, I’ll explore your calculations when time permits.
crikey says:
“1975.. What was happening astronomically( planetary)”
Saturn square to; Jupiter opposite Uranus:
Every third 69yr interval is affected by Neptune to cause de Vries.
This comment from Ian W on the WUWT thread dealing with this paper is probably the most intelligent.
I presume someone has thought to follow Landscheidt and track what the barycenter path was in Dalton and Maunder and compare its motion then to its motion now? Or is your mind made up already? Just think a simple check and you could shoot down all those tin foil hat theories – or not 😉
Svalgaard replies:
It doesn’t matter what it was or is. The barycenter has no influence on anything.
If Svalgaard or Cameron and Schussler bothered to check the path of the Sun around the Barycentre they would quickly realize that every time the path takes a particular orbit the Sun goes to sleep.
This happens every time and never fails….surely this is enough evidence????
Svalgaard, Watts and the rest of their clan are protecting their belief structure and refusing to look at the real science. Watts said he would review my paper on WUWT once published….we will see.
The green path is the important path to consider. If the path tries to escape further than the solar radius distance larger slowdowns are experienced.
Geoff, It seems to me that Svalgaard’s response may have been one with which ‘gravity accelerates a feather at the same rate as a lead ball in a vacuum’.
However, a star is a far cry from a vacuum, where ‘MHD’ (MagnetoHydroDynamics) trumps both ‘fluid dynamics’ and ‘gravitational stratification by density’. Is he aware of this? 😉
The ‘tidal influence’ to a star must take a divergent course in comparison to the ‘tidal influence’ to a planet, but to state that “The barycenter has no influence on anything.” can only be seen as obfuscation by decree, but then again (from my experience), he just doesn’t ‘discuss’ any thing, any how, any way. 🙂
I gave up on his cause years ago.
Best regards, Ray.
Geoff Sharp says: September 10, 2013 at 7:08 am
“If the path tries to escape further than the solar radius distance larger slowdowns are experienced”
What do you mean by “larger slowdowns”?
Best regards, Ray.
Hi Ray, yes I also gave up on Svalgaard some years ago, discussion is pointless. I would not be surprised if he was getting paid by some green group to counter skeptic argument on WUWT, there is another who tells us the PDO has nothing to do with climate shifts.
Wolff and Patrone are still unchallenged so we have a physics based mechanism along with some solid work by Ian Wilson and Nicola Scafetta that shows promise. I really dont care too much about the mechanism as planetary theory can forecast solar activity accurately, which is something new for solar science.
In respect to the solar path there are different types of disordered solar orbits around the SSB, they only happen with J/U/N together with S opposite, but depending on the planet positions the extension of the orbit can vary. If the early to middle part of the inner loop orbit escapes the solar radius as plotted on a barycentre chart the chances of grand minima greatly increase, compare the orbit shapes in the following diagram and it becomes clear.
The disordered orbit at SC20 is weak and does not escape the solar radius, the AM perturbation is also weak and late. The greatest slowdowns like the Maunder etc have a high disordered orbit and the AM and velocity curve are interrupted midway and actually go in the opposite direction, one would suspect the Sun is not keen on this change in direction.
Geoff Sharp says: September 13, 2013 at 12:03 pm
“Wolff and Patrone are still unchallenged so we have a physics based mechanism along with some solid work by Ian Wilson and Nicola Scafetta that shows promise.”
No we don’t. We have a correlation from Wolf and Patrone that isn’t ‘physics’ based. To be ‘physics based’ we need to understand the ‘mechanism’ that links the observed correlation.
“I really dont care too much about the mechanism as planetary theory can forecast solar activity accurately, which is something new for solar science.”
That may well be the case, but, as an engineer, I’m not that comfortable with ‘correlations’ per se. It’s essential to show the ‘teleconnection’ between events. Cause and effect requires a positive ‘link’ that ‘proves’ the correlation to be the result of a natural attractor.
The answer may well be provided by ‘MHD’ (Magneto-Hydro-Dynamics) for Sol, hand in hand with more ‘conventional’ science applications. 🙂
Best regards, Ray.
Ray: We have a correlation from Wolf and Patrone that isn’t ‘physics’ based. To be ‘physics based’ we need to understand the ‘mechanism’ that links the observed correlation.
Errrm. No. Wolff and Patrone theorise a physics based mechanism based on the transfer of energy in a rotating system releasing more potential energy on the side of the Sun facing the barycentre of the solar system. They then model the hypothetical effect of the mechanism for various parameters and derive a range of estimates for the strength of the effect on solar variability.
tallbloke says: September 15, 2013 at 8:11 am
I must be really thick TB as that doesn’t really make any sense to me. 😦
Let’s keep the model simple :
http://oceanservice.noaa.gov/education/kits/tides/tides03_gravity.html
The greatest displacement effect is to the region ‘between’ the objects, and the ‘barycentre region’ for an ‘entire system’ like Sol’s is on the opposite side to the major planetary gravity action. It doesn’t make sense. If Wolff and Patrone are correct, and I followed your link in an earlier post to another page here where I discovered that the ‘paper’ is pay-walled to me, then the effect may be more than twice that magnitude.
Sol is a great ball of plasma with enormous ‘thermal convection currents’ (fluid dynamics), but because plasma is made up of ‘electrically charged particles’ (static charge) the ‘thermal convection currents’ become ‘electric charge conduits’ (analogous to ‘wiring’ in an electrical circuit) that generate strong ‘magnetic fields’ (such is the nature of a charged particle in motion) which even overcome the extreme rotational forces that try to make Sol take on an ‘oblate’ form.
TBH, an observation of the Solar mass displacement from planetary ‘tidal influence’ to Sol doesn’t stand a snowball’s chance in hell. The ‘mass displacement’ is influenced by a ‘strong’ magnetic ‘attractor’ that sinks energy into slight modification of the ‘electric charge conduits’, thus, making small changes to the local magnetic field.
This is why I think MHD is a key that must be turned before we can hope to improve our understanding of a ‘physical mechanism’ that links Sol’s activity with planetary configurations :
http://en.wikipedia.org/wiki/Magnetohydrodynamics
Sol is a ‘massive inductor’!
Best regards, Ray.
Ray: Wolff and Patrone are not proposing a tidal effect. That’s why their paper is called “A *new* way planets can affect the Sun”. In Earth’s magnetosphere MHD theory breaks down where magnetic fields between Sun and Earth reconnect according to a paper I was reading yesterday. The Sun’s surface gravity deduced from its mass is something like 47 times that of Earth. If that isn’t enough to prevent oblateness on a 1.4m km diameter body spinning once every 27 days, then what we are looking at isn’t a fluid surface as we previously understood it.
“Wolff and Patrone are not proposing a tidal effect. That’s why their paper is called “A *new* way planets can affect the Sun”. ”
That much I do understand and is why I say that the overall effect is much greater.
“In Earth’s magnetosphere MHD theory breaks down where magnetic fields between Sun and Earth reconnect according to a paper I was reading yesterday.”
I don’t know what you’ve read, but this must be a paper about the interaction between Earth’s magnetic field and the solar wind with solar flare intervention?
“The Sun’s surface gravity deduced from its mass is something like 47 times that of Earth. If that isn’t enough to prevent oblateness on a 1.4m km diameter body spinning once every 27 days, then what we are looking at isn’t a fluid surface as we previously understood it.”
You’re beginning to understand my dilemma TB. 🙂
Earth’s diameter = ~12.472 km. Radius = ~6.236 km.
Sol’s diameter = ~1,391,000 km. Radius = ~695,500 km.
Radius is important for the effect, but ‘pi’ is the factor involved. Thus, ‘pi x D’ (pi . D, or 2 pi . r, or 2 r . pi) = the perimeter of a described circle. The ‘distance travelled’ over a period of time discloses the ‘inertial KE’ of a ‘mass’ at this trajectory and the ‘rate of trajectory change’ discloses the ‘diverting’ ‘acceleration force’ acting upon the body with the ‘disclosed KE’. It’s a ‘back of an envelope’ calculation, but I think its good enough for our purpose (yes, centripetal force).
TBH, I’m not going to get into this argument. Whatever the ‘centripetal’ value, there ‘will be’ a degree of oblateness to a spheroid ‘mass object’ that spins. The ‘subject’ of my post is that we can’t observe ‘mass action’ in the case of stellar observation because ‘plasma’ gets in the way of our observation and leaves us with ‘observations based on the actions of plasma’. This requires ‘interpolation’ and I believe the means of ‘interpolation’ should be via MHD.
Best regards, Ray.