


This is a guest post from talkshop contributor Ed Caryl. It is an expanded version of an article he had posted on Pierre Gosselin’s excellent ‘notrickszone’ website a while ago. I think this needs wider exposure. I’m not an expert in radiative physics, but I’d welcome the views of those who are in response to this interesting piece. If Ed is right, there’s some serious ‘splainin’ to do on the part of the atmospheric physicists. I’m not sure widened ‘wings’ on absorption frequencies are going to cover it. – TB.
UPDATE 22-9-2012: The latest version of Ed’s Article is here. He has rerun the online MODTRAN model with the ‘water vapour scale parameter modified in line with suggestions made in comments, and added some other further material and analysis.
Analyzing the Earth’s Heat Radiation Using MODTRAN
By Ed Caryl
The Climate Team has always claimed that a doubling of CO2 would add 3.7 Watts/m2 to the global climate budget and thus this would fry us all. This fate is their religion’s version of Hell, except we will all suffer this rather than just the “sinners,” thus giving them leverage to force us to do their will. Many bloggers, and some others, notably even the Berkley Earth Surface Temperature (BEST) study,[i] have pointed out that there are many locations that are cooling rather than warming. The warmists would have us believe that these cooling stations are just due to local phenomenon, such as albedo change, land use, site moves, or other changes, and that the warming stations are not due to UHI.
The greenhouse effect is described as an increase in downward infrared radiation due to water vapor, carbon dioxide, methane, ozone, and CFC’s in the atmosphere. But strangely, there are very few measurements of this radiation in the only way that tells us if this is true, measuring the spectrum. Each of the above gases absorbs and re-emits radiation at specific wavelengths. These emission lines should change when the mixture of gases changes. A Spectrometer designed to operate at these wavelengths will tell us if this is true.
MODTRAN is a computer program that was initially developed by the US Air Force in the late 1980’s that does a line-by-line analysis of the IR
spectrum transmitted by the atmosphere. An on-line version is available at the University of Chicago, here.[ii]
In the 24 year history of MODTRAN, the US Air Force and many other organizations, including climate scientists, have validated the software for their own purposes. The best way to prove that it is valid for climate studies, is to show comparable spectra from other sources.
Infrared astronomers are quite familiar with the problem of atmospheric IR. IR astronomy is not easily done on the earth’s surface because the lower atmosphere is nearly opaque to IR because of moisture in the air. Consequently IR astronomy is done at high altitudes, at very cold, or at very dry locations, or all three. The Atacama Desert in Chile, the top of Mauna Kea in Hawaii, the south pole, airborne observatories, or satellites are the favored locations.

Figure 1a is from Petty (2006), found at skepticalscience here.[iii] 1b is from MODTRAN. The scaling is slightly different, the resolution is not as high, the shape is very nearly the same.

Figure 2a from South Pole station here.[iv] The bottom trace is 1 standard deviation. figure 2b is from MODTRAN.
The web was searched for any image of the back radiation spectrum. None were found for any temperate or tropical zone. The only spectra found are from the Arctic at -10°C, and the south pole at -30°C. From the spectral shape, it appears that the Arctic data was taken at Summit Camp on the Greenland ice sheet. Those are the next figures with the MODTRAN version for comparison.

Over most of the earth, figure 3 is the spectrum seen by a spectrometer looking at the sky. Only at very cold, very dry, and/or very high locations will any features be seen in the spectra. The available literature use either figure 1a or 2a over and over, as if those spectra represent the whole globe. They do not.
From the top of the atmosphere we have a similar situation. The available spectra are taken over deserts. The following figure is from the University of Chicago web site here,[v] and is a comparison of the IRIS Satellite spectra with MODTRAN set for desert conditions. IF MODTRAN hat been set for the exactly the same temperature and humidity as the satellite observed, the match would have been nearly exact.

Why CO2 Does Nothing
When I first began exploring MODTRAN, the numbers it produced for downward radiation at the surface, the “back radiation”, seemed to make no sense. It nearly always produced the same number, and I thought that part of the program was broken. On reflection, it became clear that the numbers were correct and that I had fallen into the warmist trap of believing that CO2 really does something to the Greenhouse effect. When the numbers in the very low humidities were charted, all became clear.
Here is what Modtran says about downward or “back” radiation at the earth’s surface for values of humidity from 0 to 90% and CO2 from 0 to 1000 ppm. The IPCC agreed translation of a change in radiation to a change in temperature is a change of 1 W/m2 = a change of 1°C.

Figure 6: You should notice that the legend cites six traces, but you see only five. That is because the 50, and 90% humidity traces are superimposed. There is very little change in the downward radiation for any humidity from 10% and above and for any CO2 concentration from zero to 1000 ppm, or indeed for any concentration of CO2 up to 10,000 ppm.
Here are the Excel numbers copied from MODTRAN used to draw the above table.

Figure 7
As you can see, only in the driest desert on earth will increasing CO2 increase the “back” radiation. Water vapor is by far the strongest greenhouse gas, but it is nearly saturated at 10% humidity. At 10% humidity and above, no amount of CO2 does anything. Most of the humidity on earth is in that area on the right where doubling CO2 will do nothing to increase the long-wave radiation from the sky. Yet another CAGW fail.
Why the Earth is Cooling
Here is the result of calculating the outbound long-wave radiation (OLR) at the top of the atmosphere (TOA) , or as it is labeled in MODTRAN, I out. The settings used were: CH4 – 1.8 pmm, Tropical Ozone 800 ppb, Strat. Ozone 1, Ground T offset – 0°C, hold water vapor – Relative Humidity, Water Vapor Scale – at 0, 10, 50, and 90 percent, Locality – 1976 U. S. Standard Atmosphere, No Clouds or Rain, Sensor altitude 100 km, Looking Down. These values are the best at representing a global average. The default temperature the program uses is 15°C. This produced the following table and chart for various CO2 and water vapor values. Lesser values mean less heat escapes the earth and the earth warms. This is the “greenhouse effect”.

Figure 8: TOA OLR for CO2 values from 0 to 1000 ppm and RH at 0, 10, 50, and 90%.
 Figure 9: A chart of the previous table, MODTRAN output for 0, 10, 50, and 90% humidity, and CO2 from 0 to 1000 ppm. The radiation (vertical) scale has been inverted so that increasing greenhouse warming is upward. Note that both CO2and water vapor forcing are logarithmic; increasing amounts have decreasing effect.With humidity set to zero, the doubling of CO2 figure actually goes to 3.265 W/m2. Any reasonable humidity value drops that number drastically. At 50% humidity, and our current CO2 value, we get a tiny 0.345 W/m2, far, far below the IPCC favored value. Of course humidity doesn’t stay constant. In the tropics, 90% is more typical. In that case, doubling CO2 gets us 0.126 W/m2. This is all before the additional factors of clouds and rain, which will drop the value even further, into the negative territory that Willis Eschenbach noticed here.[vi] The blue triangle in the chart and the blue value in the table are the current values with today’s CO2and global average humidity.Given the data, MODTRAN can compute the real outbound radiation over time. The humidity at 600 mbars and the Mauna Loa CO2 values were applied through MODTRAN to result in figure 93. This is a “zoom in” on the blue triangle in figure 10, adding the time dimension. The 600 mbar level for humidity seemed a good compromise, as only one humidity figure could be entered.

Figure 10: A chart of the outbound radiation increase since 1948. There has been a more than 1 Watt/m2 increase in outbound radiation in that interval, despite rising CO2.
Humidity has been decreasing in the upper atmosphere over the last 60 years. That offsets the rising CO2. We saw the cooling in the 70’s but increased solar radiation along with ocean cycles held off the cooling over the last 20 years. That period has now come to an end.
None of the charts and graphs you will see in the climate literature touting global warming caused by CO2 will include considerations that atmospheric water vapor might change as well. If they do consider water vapor, the warmists believe that a warmer climate caused by CO2 will increase water vapor. First, it isn’t warming. Second, humidity is decreasing.
Mother Earth has an excellent thermostat system. Even if somehow average humidity should increase to 50% and CO2 goes to 1000 ppm, only about 0.55 Watts/m2 will be added. This is unlikely in the extreme, and might add a 0.5°C to warming. No one would notice. A more likely scenario is that humidity will fall further or stay the same, resulting in no warming or a rise of less than 0.4°C.
In light of figure 10, why have we not seen global cooling? We did in the period up to 1980. Since then, the answer is clouds and the sun (and constant temperature record adjustments by GHCN, GISS, UEA, etc.). If falling humidity at nearly all levels in the atmosphere, there are less clouds. This allows more solar radiation to reach the surface, compensating for the radiation leaving the TOA. It all balances out. A link to more reading on this, here.[vii]
My question is: Why have the professional “Climatologists” not done the simple work that I did on a lazy Saturday afternoon with my laptop? They must know that water vapor nearly wipes out CO2 in warming the earth, and that cloud and albedo changes do the rest. What’s their excuse for this massive “oversight”?
[i] http://berkeleyearth.org/pdf/uhi-revised-june-26.pdf
[ii] http://forecast.uchicago.edu/Projects/modtran.html
[iii] http://www.skepticalscience.com/print.php?r=92
[iv] http://journals.ametsoc.org/doi/pdf/10.1175/JCLI3525.1
[v] http://forecast.uchicago.edu/Projects/modtran.doc.html
[vi] http://wattsupwiththat.com/2012/06/19/a-demonstration-of-negative-climate-sensitivity/
[vii] http://wattsupwiththat.com/2012/04/04/spencers-posited-1-2-cloud-cover-variation-found/
Biography
Edward B. Caryl worked in high technology for 50 years, as an Electronics Technician, Applications Engineer, Script Writer/Producer, and Product Marketing Manager. Ed started his career in the U. S. Air Force. During part of that time he maintained the weather instrumentation on Typhoon/Hurricane Hunter aircraft in the Pacific. He also worked as an Electronics Technician at Boeing Aircraft and for RCA Service Company at Thule Air Base in Greenland. Ed then majored in physics at the University of Washington for two years, also taking courses in math, chemistry, anthropology, sociology, economics, and creative writing. Ed spent the last 40 years of his career in research, product support, and marketing at Tektronix, Inc., a worldwide manufacturer of electronic test and measurement equipment. His work required understanding the measurement needs of a wide range of customers in the scientific community and assisting those customers in making and analyzing measurements. He has had a life-long interest in the sciences, reading on a wide range of subjects. He and his wife are now retired and living in New Mexico. His hobbies are woodworking, writing, and astronomy.

CO2 didn’t do much for the 350 years of June (CET) temperatures.
http://www.vukcevic.talktalk.net/CET-Jun.htm
Small voice from taxpayer (Soon to become a clamouring roar):
“If Mr Caryl is right, can we have our money back please.”
Excellent article, Ed. Thanks for posting.
I’m interested in Ed’s OLR since 1948 graph at fig 10
Is this from the NCEP reanalysis?
This seems to be a clear and detailed analysis that supports the very simple analysis that is done here;
http://theendofthemystery.blogspot.com.au/2010/11/venus-no-greenhouse-effect.html
The composition of the atmosphere has no effect on atmospheric temperature and vapour (water vapour for Earth, methane vapour for Venus) has a measurable effect because vapour is much more dense than gas. This takes all of the oxygen away from the radiative effect argument.
http://climaterealists.com/index.php?id=4245
“Greenhouse gases can cause cooling !” October 26th 2009
“Could an increase in greenhouse gases actually have a cooling effect over water by speeding up the rate of evaporation from the oceans thereby extracting energy faster from the oceans, speeding up the hydrological cycle and pushing energy faster to space ?”
Despite the rhetorical title I think the net effect of more CO2 is indistinguishable from zero as per Ed’s conclusions because the increase in evaporation from more GHGs is self limiting such that when the additional energy in the air has all been used up in the evaporative process there is no further increase in the rate of evaporation.
The increase in OLR is likely a consequence of that increased evaporation and a faster hydrological cycle with one of the side effects being reduced humidity higher up to offset the thermal characteristics of any more non condensing GHGs such as CO2.
Such a change in the air circulation is required to ensure that energy out equals energy in despite the fact that more GHGs retain energy in the air a little longer by bouncing it about within the system more times than does a non GHG atmosphere.
As Ed says, it all balances out.
However I do think that most of the changes observed were a consequence of warmer ocean surfaces leading to a faster water cycle anyway with more natural CO2 outgassing and human CO2 emissions only contributing a tiny unmeasurable fraction to the observed changes.
Three points.
1)The Milankovich orbital variables giving maximum insolation in the Northern hemisphere Winter.
2)AIRS and ground data both show the highest overall CO2 levels occuring in the Northern hemisphere and the Arctic in Winter and Spring.
3) Your post shows a strong correlation between low humidity and the effectiveness of CO2 temperature forcing.
Put them together and you get a good explaination of the tendency for the maximum rates of climate warming to occur in the higher Northern hemisphere latitudes..
http://data.giss.nasa.gov/cgi-bin/gistemp/do_nmap.py?year_last=2012&month_last=8&sat=4&sst=1&type=anoms&mean_gen=0112&year1=2000&year2=2011&base1=1951&base2=1980&radius=1200&pol=reg
Tallbloke,
Yes, the humidity input to that calculation is from the NCEP reanalysis.
Stephen Wilde,
Willis Eschenbach’s article (Note vi.) supports that idea. Especially over the tropical ocean, where he finds that the climate sensitivity goes negative.
I have suspected as much. As we discussed on the CO2 thread, it is quite apparent from the data that increasing temperature causes increasing CO2. If increasing CO2 in turn causes substantial temperature increase, we have a classic positive feedback dynamic which should have roasted the Earth eons ago.
As I discussed here:
I made the off-hand suggestion that cloud cover could be the reason for mitigation of the positive feedback effect. It appears even more so that humidity is. But, whatever the source, the positive sensitivity of CO2 to temperature argues that temperature cannot be particularly sensitive to CO2, because if it were, the Earth would never have evolved to its present state.
Great work, Ed. Thanks for bringing it to light, Rog.
Are the humidity numbers relative or specific humidity?
Talking of outbound radiation and professional climatologists, NOAA publishes OLR estimates for the period since 1974, and here they are:
There’s not much of a trend in the NOAA data, but the amplitude of the short-term fluctuations is much higher that what MODTRAN shows in Figure 10 and NOAA also gives much higher absolute w/m2 values. Any explanation for this?
Roger,
It is relative humidity.
It is interesting that the measured OLR has the same general shape as the MODTRAN model. It is a pity that the data doesn’t go back further than 1975. I will download the data and do a comparison. The real world is, of course, much more complicated than the simple(?) MODTRAN model, with changing humidity over time and altitude, clouds, convection, precipitation, etc. but I think the MODTRAN model gives us a good clue about what is going on.
edcaryl says:
September 16, 2012 at 1:21 am
Tallbloke,
Yes, the humidity input to that calculation is from the NCEP reanalysis.
Thanks Ed. I ask because I came across this NCEP OLR graph on the net which shows a much bigger increase.
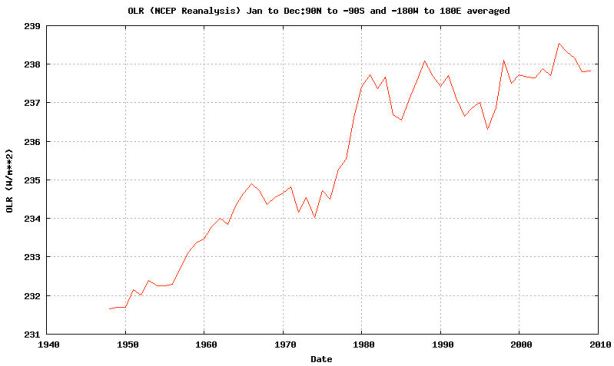
I’m not sure what to make of the discrepancy. Unfortunately, there’s no indication of the altitude. ~5W/m^2 is a lot, but then, if cloud amount reduced after 1960 as much as the new papers from Spain and China say, then going on Spencer’s estimate of the forcing from reduced albedo, it is conceivable that much extra energy had to leave to balance the energy coming in. The difference could explain the warming.
Bart says:
September 16, 2012 at 2:58 am
I have suspected as much. As we discussed on the CO2 thread, it is quite apparent from the data that increasing temperature causes increasing CO2. If increasing CO2 in turn causes substantial temperature increase, we have a classic positive feedback dynamic which should have roasted the Earth eons ago.
Bart: please see Roger Andrews comment on the co2 thread at
It seems he may have arrived at your 5% Anthro 95% natural via a different route. Time for you two to put your heads together and write the talkshop position paper maybe. 🙂
edcaryl says:
September 16, 2012 at 5:12 am
Roger,
It is relative humidity.
It is interesting that the measured OLR has the same general shape as the MODTRAN model. It is a pity that the data doesn’t go back further than 1975. I will download the data and do a comparison. The real world is, of course, much more complicated than the simple(?) MODTRAN model, with changing humidity over time and altitude, clouds, convection, precipitation, etc. but I think the MODTRAN model gives us a good clue about what is going on.
And in the main article:
Since then, the answer is clouds and the sun (and constant temperature record adjustments by GHCN, GISS, UEA, etc.). If falling humidity at nearly all levels in the atmosphere, there are less clouds. This allows more solar radiation to reach the surface, compensating for the radiation leaving the TOA. It all balances out.
Interestingly, falling specific humidity at the 300mb level, near the tropopause correlates with solar activity levels remarkably well. This is what first led me to realise that the radiosonde data isn’t as bad as some people make out:
Maybe the departure after the ’98 El Nino is what kept the atmosphere warm after the sun got sleepy?
“it is conceivable that much extra energy had to leave to balance the energy coming in. The difference cold explain the warming.”
Note that the big increase coincides with the so called ‘great climate shift’ of 1976/ 8:
http://www.appinsys.com/GlobalWarming/The1976-78ClimateShift.htm
So the big increase in outgoing OLR occurred contemporaneously with the start of the poleward drift of the jets and the start of the period of decreasing cloudiness.
Which in turn coincided with the resumption of high solar activity after the weaker cycle 20 and the trend towards a cooling stratosphere.
So, when the sun is more active it intensifies the polar vortices thereby pulling the jets and climate zones poleward. That reduces cloudiness to allow more energy into the oceans but that is matched by an increase in OLR because there is also less insulation from clouds.
However, due to the thermal lag of the oceans and the internal ocean cycles there is a build up of energy in the oceans because the increase in outgoing OLR is slightly less than the extra incoming.
It takes a decade or so (maybe 15 years as per Bart’s suggestion) for a new equilibrium to be achieved but in the meantime the solar effect changes further or goes into reverse so actual equilibrium is never achieved.
Whenever the sun tries to alter the system energy budget by changing the vertical temperature profile of the atmosphere via ozone chemistry the system tries to respond instantly by adjusting OLR but the oceans introduce a lag because a large part of the change in solar input goes past the evaporative layer and gets moved around latitudinally over time.
What we have here is a forced variation (via changes in cloudiness) in insolation reaching the ocean surface and a negative system response (seeking to eliminate the thermal effect of that change) reconfiguring the air circulation in order to compensate for the delay introduced by the thermal inertia of the oceans.
Ultimately, the system energy content is kept stable over time but at the expense of ever shifting climate zones.
Lots of bits are slotting into place.
MODTRAN deliver the intensities of radiation at predetermined temperatures and gas concentrations. A check of the balance of the energy does not take place.
Insofar MODTRAN is indeed a tool – but not suitable to draw any conclusions on climate sensitivity.
Also missing the importance of convection: the properties of gases in the troposphere enforce a vertical circulation and thereby a certain temperature gradient. There is also assured by the steam radiation. Insofar as the radiation have from water vapor and CO2 in the troposphere does not an effect on the climate sensitivity.
TB:
Re your comment of 7.02 am.
A couple of days ago on the CO2 thread you took me to task for cherry-picking.
Well, shame on you too. 😉
Well Roger A:
The residence time of 5 years seems better supported than I originally realised, by many different sources, so I’m coming around to it. 🙂
There’s still plenty of wiggle room for both sides of the argument it seems.
I never could understand how any one looking at the spectrum which shows no back radiation could say there was back radiation. It makes me doubt if those people really understand what they are looking at.
Truthseeker says:
September 15, 2012 at 11:42 pm
…
The composition of the atmosphere has no effect on atmospheric temperature and vapour (water vapour for Earth, methane vapour for Venus) has a measurable effect because vapour is much more dense than gas.
Say what? Under what definition is vapour distinct from gas?
Tallbloke says
September 16 at 6:53 AM
I found albedo numbers that are about the same amplitude as those OLR numbers. They go in the same direction. Could you give me the link to that data? I found OLR on that site, but can’t make the numbers agree.
Here’s the albedo.
https://dl.dropbox.com/u/101944119/albedo.doc
“Only at very cold, very dry, and/or very high locations will any features be seen in the spectra. The available literature use either figure 1a or 2a over and over, as if those spectra represent the whole globe. They do not.
From the top of the atmosphere we have a similar situation. The available spectra are taken over deserts.”
That’s the problem right there. First, there is no such thing as “global temperature.” And second, there is no such thing as a global blue sky where the co2 has appreciable back radiation. Water vapor is the greenhouse gas.
“water vapor scale” is a multiplying number not the relative humidity you are increasing the water vapor in the atmosphere by a factor of 10,50,90, no doubt that carbon dioxide doesn’t cause any change with such a ridiculous amount of water vapor.
The original modtran variable to specify water vapor scaling factor is H2OSTR this is what is found in the modtran manual:
“Otherwise, a positive value is interpreted as a scaling factor for the water column (e.g., 2.0 doubles the default water vapor column).”
ftp://ftp.pmodwrc.ch/pub/Claus/Vorlesung2009/ModtranDaten_etc/MODTRAN(R)5.2.0.0.pdf
“water vapor scale” is from the university of chicago web plotter so you should ask David Archer for a confirmation or just look at the output file…with the values specified above and 90 as a scaling factor the atmosphere hold ~66.000 cm/Km of water vapor (at standard temperature and pressure) near the surface and 2350 cm/km in the upper troposphere(8km).
aaa: welcome and thank you for your comment. The author of this article is going to rerun the computations to see how the results differ. I will update the article with the outcome.
There has been no reply as yet to a request for clarification sent to “realclimate” contributing scientist David Archer regarding the undocumented “water vapour scale” input selection on his online MODTRAN model.
To cover all the bases, Ed Caryl has now rerun the calculation with the “water vapour scale” varying from 0.01 to 0.9 in line with the comment from ‘aaa’ and found that apart from the absolute values falling more into line with observations, the lack of signal from co2 where humidity is at more common and prevalent real world values is about unchanged. We will be updating the graphs and re-writing the relevant text for an update on Friday.
Post updated, see link to new version of the article at the top of the headline post or download at this link.
https://tallbloke.files.wordpress.com/2012/09/analyzing-earths-w-modtran-update-1.doc
Ed has chosen the clear sky which appears to be the one case in which CO2 does make a difference.
Instead of changing humidity, I suggest Ed looks at various conditions of cloud. When you add cloud, CO2 appears to make no difference at all between 0 and 1000ppm. Try Stratus Cloud Base .33km, in mid latitude summer. Cloud of course dramatically increases the downwelling radiation, but if it became permanently cloudy with Stratus Cloud Base .33km, I’m inclined to think the earth underneath it would cool. That seems to me a rough sort of argument for negative cloud feedback. The trick is what happens when it’s half way in between.
So, it turns out I was right after all. I’ll have to admit it is difficult for me to accept anything now when the obvious error I pointed out months ago was defended. Too much confirmation bias.
Now you claim we had “global cooling” until 1995? Sorry, but I’m not aware of any temperature data, including satellite data, that supports that claim. Once again I can’t see anyone taking this analysis seriously with statements like that.
I have done a very similar analysis (with a presentation in power point) with very similar results. I would like to post it on this site for comparison purposes. To what address can I send it for possible posting?
Thanks
[Reply] Check your inbox – TB
Hello, anybody here?
I wonder why we are using relative humidity to measure water vapor content of the air re: back radiation. I would think relative humidity not to be relevant here. I mean, 50% relative humidity at the equator has 1000000000000000 more water vapor than 80% at the south pole.
[moderator] I don’t recall the details of the article but yes absolute is apt. Not so simple though, the wavelengths are temperature dependent. Doubt there is a simple answer.
Looking at your web site, you’ve been busy.
Thanks for the reply tchannon. I just saw the comment above by aaa and tallblokes comment, and looked at the recalculation. My bad, I should learn to read before I post.
Thanks, I’m glad you like my web site. Because of this thread I ordered a book on infrared astronomy and can’t wait to read it.
Read through the corrected paper.
“Water vapor is by far the strongest greenhouse gas, but it is nearly saturated above 10% humidity. At 10% humidity and above, no amount of CO2 does very much.”
He’s using 0 C as a standard temp, and 10% relative humidity at 0 C is very dry air. If this report is true, then this changes everything we know….or think we know.
Are you sure you chose “sensor looking up” in figure 3 and 4?
It looks like the blackbody radiation you get with “looking down” from 0 km.