


My thanks again to Roy Martin who has done a substantial re-write of the paper he presented here a fortnight ago in response to the feedback he received here at the Talkshop.
How do the planets affect the Sun ?
By Roy Martin Jan 5, 2013
Revised March 17, 2013
“Knowledge is about as durable as green cheese.” anon.
The barycentric motion of the Sun and the tidal forces acting on the Sun are both caused by the motion of the orbiting planets. This note was written to illustrate the differences between the combination of gravitational forces that cause the barycentric motion of the sun and the tidal forces believed to act principally on it’s surface layers. The first section was to be part of the introduction to a report about further work done on the tidal influence of the planets on solar activity, however it led to a few interesting, but quite unrelated observations about the synodic relationships between the planets and the José cycle, which would have been out of context there, so I have put them into this stand-alone note. As far as I know there is nothing fundamentally new here, just a somewhat different perspective on some older knowledge.
There is an intricate overlapping of features in the two phenomena, and yet they create distinctly different landscapes. This note aims to describe the differences and similarities relevant to my own studies, but they are possibly relevant to other on-going investigations and discussions surrounding the mechanisms by which the planets may effect both the solar cycle and the motion of the Sun about the barycentre.
There is significant scope for confusion between the potential effects of the two causes. At least since the publication of José’s 1965 paper: ”Sun’s Motion and Sunspots”, barycentric motion, or solar inertial motion (SIM), has been studied extensively. Many apparent correlations with events on earth and human activity have been identified, but most of those I have examined in any detail have failed to satisfy close scrutiny. The absence of any provable mechanism by which SIM caused by the planets can affect solar activity remains a major objection. SIM is fundamentally a whole-of-body effect, and as such none of the accelerations imposed on the Sun while orbiting the barycentre can differentially affect separate regions. Theories based on spin-orbit coupling appear to come up against the same objections.
During the same period, the possibility that tidal effects could affect solar activity was rejected and largely ignored, but in the last few years increased attention is being directed to this possibility. There is active reseach into suggested mechanisms, and in my own work I have identified close correlations between planetary induced tidal forces and the solar cycle. I now suspect that many of the correlations previously attributed to presumed SIM effects may be due to tidal effects occurring simultaneously.
We need to look at how each individual planet plays quite a different role in relation to SIM compared with tidal forces that may influence solar activity.
Figure 1. below is presented to show the relative effects of the major and minor planets, due to both the gravitational forces that cause barycentric motion, and the tidal effects which many are coming to believe are more likely to affect solar activity. The data plotted is from very simple physics, calculated using the basic formulae for gravitional and tidal forces. It is possible, even likely, that orbital eccentricity and inclination affect both to some extent, but are omitted from this analysis. I reason that if either gravitational or tidal effects are involved in modifying solar activity, it will first have to be shown and proved that the major primary forces due to one or the other are the principal cause. The individual bars represent the percentages of the total of the fully aligned planets.

Figure 1.
It can be seen from Fig.1 and Table 1. that the planets may be viewed as two overlapping groups:

Table 1.
The gravitational group includes Saturn but not Mercury. The tidal group includes Mercury but not Saturn.
The relative magnitudes show the basic differences between the two groups. Jupiter and Saturn dominate the gravitational group, and Jupiter alone accounts for 74% of the total. How these two combine with Uranus and Neptune to create SIM will be looked at a more closely further on. Mercury, Venus, Earth and Jupiter cause 97.8% of the tidal forces, but the component from Jupiter is only 34.7%, which is nearly matched by Venus at 33%. The relative role of Mercury changes from 2.3% to 14.6%, almost equal to that of Earth, and thus has the potential to be a significant influence on tidal effects. The tidal group will be studied in much more detail in another note.
We should observe here that the planets do not exist in isolation. It is far too easy to become fixated on one of them as the sole or principal cause of an observed phenomena. Jupiter is a prime candidate for such attention because the orbital period is so close to that of the solar cycle, and it does play a big part in both sets, but in real life it is “…just a player in a rock and roll band.”
But we need to look at the basic forces in conjunction with the synodic periods between the various planets. Table 2. lists the relevant relationships, and we are immediately confronted by the problem that the network of interconnections between the gravitational and tidal planets is so complex that it can lead to the illusion that one is the cause of observed effects, when it is really the other.
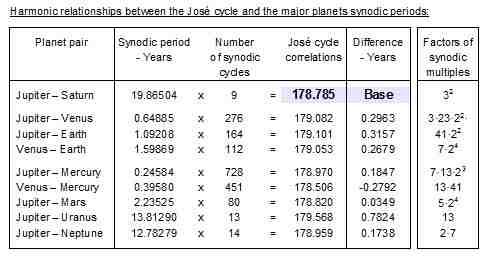
Table 2.
In the gravitational group, the dominant synodic period is between Jupiter and Saturn, with a period of 19.8650 years. The 19.8650 x 9 = 178.7853 year multiple is of primary importance, because it appears to be the nominal period underlying the José cycle. I have therefore used it as a base period for comparisons. As shown in the table, the synodic periods of the major planets are all harmonically connected to the nominal 178.8 year period, the consequences of which can lead to endless discussion. Note the small differences between the 178.785 year nominal José cycle length and the nearest multiples for J-V, J-E and V-E.
The gravitational forces from Mercury, Mars, Uranus and Neptune are relatively small, but are included to show that their orbits also appear to be harmonically linked to the José cycle.
I tend to scepticism when claims are made that because a value is ‘close to’ another it implies justification for causation, but here the José cycle correlations for all of the significant planets except Uranus are within +/- 0.2%, and it seems to me this is too close to ignore.
Similarly, we need to be cautious about numbers like the multiples of the synodic periods, because a given number can often be factored in different ways. Should these numbers be accepted as meaningful at all? In this case the factors are all about primes and Fibonacci numbers. We have six of the early primes: 2;3;5;7;11;13, the sum of which is 41, and 2;3;5;13 are also Fibonacci numbers. The sum of the alternate primes 3;7;13 is 23. Within the solar system, such relationships are often observed, and support other observations of the exquisite mathematical balance between planetary orbitital periods. I believe they can be taken seriously.
(Note: The multiple for Mercury could also be taken as 452, with factors 113 x 22, giving the product 178.902 years. Take your pick, the difference matters little here.)
The harmonics of the Venus and Earth synodics are found to form a cycle 22.38 years long, which is very close indeed to one eighth of the José cycle. The derivation of the 22.38 year cycle is shown in Table 3. which further extends the relationships between the synodic periods. These relationships appear as important in studies of the possible effects of planetary tidal forces on the Sun:-

Table 3.
With regard to Ref.1.), by reference back to the multiples in Table 2., we find that for Jupiter-Venus, 276/8 = 34.5; for Jupiter-Earth, 164/8 = 20.5, and the difference between them is 14, the multiple for Venus-Earth. And just for the fun of it, from the set of factors: (3×23)/2 = 34.5, 41/2 = 20.5, and 34.5x(2/3) = 21. The half cycle difference plus and minus from a Fibonnaci number emerges as relevant in the plots of tidal forces on the Sun.
With regard to Ref.2.), the multiple differs very slightly from 11.0. The small adjustment was necessary to reconcile the 12.0037 year cycle period with the value derived from two separate studies on tidal effects. (The precise period is 0.648846 x (37/2) = 12.00365.)
In the context of the orbit of the Sun around the barycentre, the most important observation is one of the simplest, that nine J-S synodic periods are the dominant cause of the variation of the radius, as can be seen clearly in a plot of radius vs. time in Fig.2. This type of plot is a rather flat-earth way of presenting solar motion, but it shows the longer term temporal relationships much better than multiple polar plots. The J-U and J-N synodics combine to modulate both the amplitude of the radius and the peak-to-peak timing of the nine waves within each José cycle of 178.8 years. The pattern is very close to an exact repeat within the two cycles plotted here, and the near repetition is also seen in the previous three full cycles.

Figure 2.
While Figure 1. illustrates the relative forces acting between each planet and the Sun, that does not reveal the actual effect each planet has on the movement of the Sun about the barycentre: The relationships in a simple two body system of rotating bodies in space is given by the expression: Mp x Rp = M sx Rs, where Mp & Ms are the masses of the planet and Sun, and Rp & Rs are their respective radii from the common barycentre. As a means of illustrating the potential effect of each planet, the barycentric radius of the Sun has been calculated for each separate planet – Sun combination. These are shown in Figure 3.:
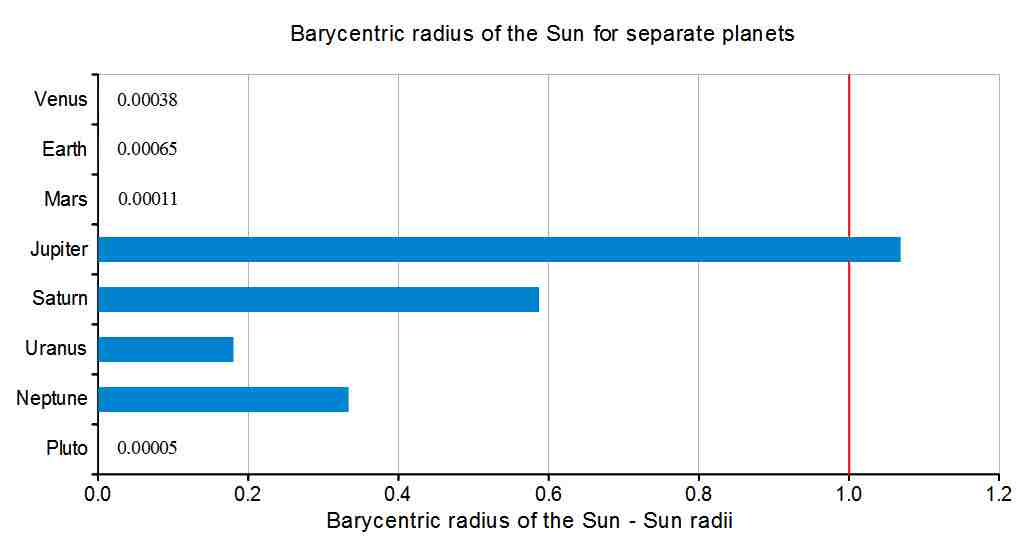
Figure 3.
The dominant effect of Jupiter and Saturn is quite clear, but the effect of Uranus and Neptune is much greater than the gravitational forces acting would indicate. This is because of their very large orbital radii. The figures also show that the planets Venus, Earth, Mars, Pluto (and Mercury), can have only a very small effect on the barycentric motion of the Sun.
Figure 4. was drawn to illustrate the combining of three sine waves: the basic 19.865 year period J-S synodic cycle, plus the 13.813 year period J-U synodic cycle and the 12.783 year period J-N synodic cycle, phased as close as possible to the times of observed conjunctions, and scaled in approximately the same ratio as the separate planets barycentric radii shown above. This plot is disarmingly simple, yet it almost matches the plot of actual solar radii for the 1722 to 1901 period in Figure 2.above. Note that it is not possible to reproduce the plot exactly with simple sine waves because of the way the Sun actually orbits the barycentre.

Figure 4.
During the three cycles centred on the start and end dates at 1722 and 1901 the Sun traces successive orbits at a relatively large radius from the barycentre, then every second cycle during the middle six periods the Sun moves through tight loops passing close to the barycentre. The movement of the Sun during the middle six is thus somewhat different. The motion in tight loops causing the Sun to move almost radially to the barycentre, which is why the effect cannot be simulated with simple sine waves.
However, Figure 4. serves to emphasize the main point of this note; that there is a clear distinction between the effect on the Sun of the ‘gravitational’ outer planets, and the ‘tidal’ inner planets, Mercury, Venus, and Earth, noting however, that Jupiter plays a significant role in both.
To summarize: the synodic periods between the planets are shared between their gravitational and tidal influences on the Sun, but whereas the Jupiter-Saturn relationship dominates SIM, Venus-Earth-Jupiter relationships dominate the solar cycle scale tidal effects, with Mercury influencing some shorter term effects. Although some solar and terrestrial phenomena appear to correlate with SIM, the correlations are only partial and, to the best of my understanding, have no known physical connection.
I intend to cover the tidal influences more fully in later notes. They are proving to be a much more productive area of study. Suffice to say briefly in conclusion here; that tidal influences appear to correlate very closely with solar phenomena and with consequent effects on terrestrial phenomena.
As a footnote: In the work on the tidal theory there is a very significant cycle of 110.3 years. It is interesting to note that 110.3 x 1.61803(phi) = 178.48 years, within 0.31 years of the nominal José cycle period as derived above from the Jupiter – Saturn synodic.
It should also be mentioned that the work done in preparing the notes on the barycentric motion of the Sun may help us to clarify what rotates about what in the solar system.
__________________________________________________________________-
Credit: Figure 2.) was plotted using the ephemeris derived from JPL data by Carl Smith, available at http://landscheidt.wordpress.com/

It’s good to see Roy’s new Fig 4 is substantially in agreement with the SSB-Radial-Distance grey curve on my plot presented here some time ago:

The Blue curve is the Z-axis motion of the Solar system barycenter relative to the solar equatorial plane smoothed and lagged by 2xJupiter orbital period. It seems to bear a relationship to solar activity levels (orange curve) represented by sunspot numbers smoothed over the solar cycle length. The black tick marks indicate where reversals in the radial distance occur close to the solar surface (orange band represents +/- 0.1 solar radii) causing the SSB to remain close to the solar surface for a number of years. This coincides with downturns in solar activity levels (causal mechanism unknown).
“It’s good to see Roy’s new Fig 4 is substantially in agreement with the SSB-Radial-Distance grey curve on my plot presented here some time ago:”
Readers should note that the grey SSB curve on Roger’s graph is actually the same as that in my Figure 2., which I expect was plotted from the same JPL based data. As highlighted in my note, the constructed curve in Figure 4. does indeed match the ephemeris data very closely, which is what I set out to demonstrate. That can be seen very clearly if the two curves are printed to the same scale and overlaid.
“The Blue curve is the Z-axis motion of the Solar system barycenter relative to the solar equatorial plane smoothed and lagged by 2xJupiter orbital period.”
This is a bit off topic, but it looks as if the Z-axis motion of the Sun is also synchronized to the Jose cycle period of 178.8 years. The one major cycle visible is apparently that long, and there are six smaller superimposed cycles per 178.8 years, giving an average period of 178.785/6 = 29.798 years. The synodic period of Jupiter-Saturn x 3/2 = 19.86504 x 3/2 = 29.798 years!
Roy: Amazing! Thank you! I’d been thinking Jose/6 wasn’t close enough to the Saturn orbital at 29.45yr and missed the prominent 3/2 relationship with the J-S synodic.
Anyway, apologies for moving ‘off topic’, but I think a consideration of Z-axis alongside radial distance will be fruitful. However we should investigate your update first.
Roy: the constructed curve in Figure 4. does indeed match the ephemeris data very closely, which is what I set out to demonstrate. That can be seen very clearly if the two curves are printed to the same scale and overlaid.
Indeed it does, and this is a good demonstration that the planets revolve about their own planet-Sun barycentres, with the sum of vectors producing the motion of the Sun relative to the Solar System Barycentre (SSB).
However, I just did a quick and dirty overlay plot (not good enough to post here), and although the match is good, there are noticeable differences, particularly around the periods when the SSB reverses in a double wiggle near the solar surface. As I mentioned in my initial comment, this tends to be coincident with downturns and recoveries in solar activity levels.
So the question of why the discrepancy is arising could be important. Any ideas?
Great work Roy – you have explained the main points well and produced a conclusion that
completely supports the postings at my blog site.
Your conclusion:
To summarize: the synodic periods between the planets are shared between their gravitational and tidal influences on the Sun, but whereas the Jupiter-Saturn relationship dominates SIM, Venus-Earth-Jupiter relationships dominate the solar cycle scale tidal effects, with Mercury influencing some shorter term effects. Although some solar and terrestrial phenomena appear to correlate with SIM, the correlations are only partial and, to the best of my understanding, have no known physical connection.
My blog site:
http://astroclimateconnection.blogspot.com.au/2012/03/planetary-spin-orbit-coupling-model-for.html
In this posting from 2012, along with my published paper:
Wilson, I.R.G., Carter, B.D., and Waite, I.A., 2008,
Does a Spin-Orbit Coupling Between the Sun and the
Jovian Planets Govern the Solar Cycle?,
Publications of the Astronomical Society of Australia,
2008, 25, 85 – 93.
http://www.publish.csiro.au/paper/AS06018.htm
http://eprints.usq.edu.au/4795/
and other postings at my blog site.
Set out below is a general general description of the evolution of my ideas on this topic of the last eight years. Note: If you are kind enough to read the following in full you might want to do so in light of the fact that at every revelation, twist and turn along my journey of discovery, I found that there were others before me who had independently come to the same or similar realizations and/or conclusions.
THE EARLY YEARS – Linking SIM and Solar Activity [2005 – 2007]
In 2005-6, when I first started this research, I believed that solar activity was (some how) being
modulated/influenced by the Sun’s SIM (i.e. Barycentric) motion. Since, the Sun’s Barycentric motion is primary controlled by the Jovian planets (dominated by Jupiter and Saturn), I argued
that there was a link between the orbital motion of the Sun (represented by the moment-arm of Jupiter upon the Sun as it moved about the Barycentre) about the rotation rate of the outer layers of the Sun. We called this link a SPIN-ORBIT COUPLING because it appeared that the rotation rate of the surface layers of the Sun [i.e. the SPIN] was linked the orbital motion of the Sun about the Barycentre [i.e the ORBIT]. Unfortunately we could not provide a valid physical mechanism to explain this link. All we had was an observational link [see figure 8] but this was enough for our paper to get through peer-review, after a messy two year battle with the editors of three different journals.
ITS HAS GOT BE THE TIDES [2008 – 2010]
It soon became apparent to me (around 2008) that there was no viable physical mechanism
to directly link SIM with changes in the level of solar activity. Einsteins Principle of Equivalence
had to be violated if there was such a connection.
However, I still firmly believed that there must be a connection between the planets and the level of solar activity. This meant that it must have something to do with the planetary tides – even there weakness made them an unlikely candidate.
This created a dilemma. The strongest planetary tides acting upon the Sun were those of Jupiter, Venus and the Earth. While the dominant direct gravitational influence on the Sun’s SIM was that produced by Jupiter and Saturn.
Given that I knew that there was an observation link between the rotation rate of the surface layers of the Sun and the SIM of the Sun, and I believed that it was the changes in solar rotation that were moderating the level of solar activity – I could come to only one conclusion.
The tidal forces of the planets [i.e. Jupiter, Venus, and Earth] which were most likely responsible for the changes in the Sun’s rotation rate via tidal torquing had to be somehow linked with the gravitational forces that were producing the Sun’s SIM [i.e. Jupiter and Saturn].
This is when I discovered the linkage between the synodic and orbital periods of the Terrestrial planets were link through a remarkable series of near resonances. [Note: while the discovery was made independently, there were others who had already gone down this path]:
Wilson, I.R.G., 2011, Are Changes in the Earth’s Rotation
Rate Externally Driven and Do They Affect Climate?
The General Science Journal, Dec 2011, 3811. [first published in 2010]
http://gsjournal.net/Science-Journals/Essays/View/3811
To me this explained the APPARENT link between the Sun’s orbital motion about the Barycentre (i.e SIM) to it’s equatorial rotation rate. The train of logic went something like this:
Orbital Periods of Jovian Planets —> SIM
Orbital Periods of Jovian Planets —-> Orbital Periods of Terrestrial Planets —> Solar Tides —> Tidal Torquing —> Equatorial Solar Rotation Rate —> Level of Solar Activity
I published this idea in:
Wilson, I.R.G., 2011, Do Periodic peaks in the Planetary Tidal
Forces Acting Upon the Sun Influence the Sunspot Cycle?
The General Science Journal, Dec 2011, 3812. [first published in 2010]
http://gsjournal.net/Science-Journals/Essays/View/3812
Although I did not fully appreciate the role of tidal-torquing in this model, preferring to believe that it was peaks in the strength of the planetary tides caused by alignments between Jupiter, Venus and the Earth that were responsible for modulating solar activity.
THE VEJ TIDAL-TORQUING MODEL [2011-2013]
Some time in 2011, I finally realized that in order to produce large enough changes in the rotation rate of the outer (equatorial) layers of the Sun, you need to have the strongest gravitational force acting upon the Sun [i.e. Jupiter] acting the biggest possible tidal bulge that could be produced by the remaining planets [i.e. alignments of Venus and the Earth].
This slowing down and speeding up of the outer layers of the Sun’s Convective Zone could only be accomplished by a TIDAL-TORQUING mechanism similar to the mechanism by which the Moon slowed down the Earth’s Rotation through its GRAVITATIONAL action upon the Earth’s oceans via the TIDAL BULGES.
However, in the case of the Sun Jupiter provides the GRAVITATIONAL FORCE that slows and speeds up the Sun’s rotation rate, while alignments of VENUS and EARTH produced the tidal bulges.
This VEJ TIDAL-TORQUING MODEL would modify the train of logic so that it would now become:
Orbital Periods of Jovian Planets —> SIM
Orbital Periods of Jovian Planets (Primarily Jupiter) —-> Orbital Periods of Terrestrial Planets (Primarily Venus and Earth) —> Solar Tides in the base of the Convective Zone of the Sun —> Tidal Torquing (via the VEJ TIDAL TORQUING MODEL) —> Equatorial Solar Rotation Rate —> Level of Solar Activity
So, from about 2008, on-wards, I have been arguing that the connection between SIM and
solar activity is an ILLUSION.
It wasn’t until 2011, that I finally realized that this ILLUSION was created by the logic train cited directly above.
So, as you can see Roy, you are doing every one a great service by pointing out the possible underlying planetary mechanism [i.e. GRAVITATIONAL and TIDAL] that could affect or influence the general level of solar activity.
However, eventually you must provide a context or model through which these forces act. I believe that I have provide one possible MODEL which does just that:
The VEJ TIDAL-TORQUING MDOEL
Ninderthana: Although some solar and terrestrial phenomena appear to correlate with SIM, the correlations are only partial and, to the best of my understanding, have no known physical connection….eventually you must provide a context or model through which these forces act. I believe that I have provided one possible MODEL which does just that:
The VEJ TIDAL-TORQUING MODEL
I think the correlation between changes in Earth’s LOD and the Solar Inertial Motion (SIM) is an indication that there are forces transmitted via the interplanetary magnetic field and ‘flux tubes’ (T.M. NASA), modulated by solar activity levels, which in turn are modulated by planetary motion. It’s a complex cybernetic feedback system, and simple cause and effect operating by simple F=MA type relationships will not be found. The Solar Inertial Motion is a proxy for something else. I’m sure gravitational tides are part of it, but I think electromagnetic ‘tides’ are playing an important part too.
Tallbloke,
You might be right but right now I believe the simplest explanation is that the Moon
(i.e. the Solar/Lunar tides) provides the mechanism that links changes in LOD to those in SIM.
See:
http://astroclimateconnection.blogspot.com.au/2013/02/do-you-think-that-moon-might-have.html
and
http://astroclimateconnection.blogspot.com.au/2010/03/synchronization-between-solar-inertial.html
Though I agree with you that the jury is still out on this one.
Tallbloke,
Paul Vaughan has always reminded me that the influences of the Luna Tides governs the variance (i.e. it limits the maximum and minimum variation in climate variables and the LOD) but not necessarily changes in the mean of these parameters. I think what he is saying is that the Lunar tides are modulating changes that are being driven by the Sun.
If the helio-spheric current sheet plays a role in producing long-term in the Earth’s LOD
you might expect that the changes in the Earth’s LOD would be associated with long-term changes in the Sun’s activity that effect the strength or tilt of the current sheet at the Earth. These could be:
a) Changes in the equatorial rotation rate of the Sun – which could influence changes in the overall level of solar activity
b) Changes which affect the polar magnetic field strength which provide the magnetic flux that is en-trained in the solar wind.
c) Asymmetries between the level of solar activity in the two hemispheres of the Sun which may affect the tilt of the helio-spheric current sheet at the Earth.
I am just throwing a few ideas out to see if anyone runs with them.
[Of course – there are factors which affect long-term changes in the strength of the Earth’s magnetic field as well.}
This is a bit OT for this thread but relevant to a pet theory of mine that tidal effects may play a direct role in the earth’s climate by influencing ocean currents. The mechanism would involve the tidal bulge impinging on shorelines and ocean bottoms at various angles depending on earth/solar/lunar orbital parameters and possibly other gravitational or magnetic effects as well.
The graph plots the difference between the northern extratropic ocean temperature and the southern extratropic ocean temperature on the theory that it reflects the distribution of tropical ocean surface currents either to the northern or the southern hemispheres. Return flows would be cold deep ocean water. The temperature difference (blue) has a 13 month smooth to eliminate seasonality. Since I imagined that I could see a direct effect of ENSO lagged by several years, I took the correlation coefficient between ENSO and Temp Diff at various lag times. The maximum correlation efficient was 0.11 at a lag of 36 months and the coefficient went negative on either side of that value. I attribute this small correlation to the direct effect of TSI as it is the same time lag that I found in a previous exercise where I investigated the lagged effects of solar activity on global surface temperatures. The correlation coefficient for PDO is negative for the same time lag, but it may become positive over multidecadal intervals, not enough data to be sure.
It’s been said that ENSO affects northern hemisphere temperatures after a lag of 7? years, but the correlation coefficient I found was negative for that interval as well.
This suggests that an external agency may be affecting the distribution of tropical ocean currents between the northern and the southern hemispheres.
references:
http://www.nsstc.uah.edu/data/msu/t2lt/uahncdc.lt
http://www.cpc.ncep.noaa.gov/products/analysis_monitoring/ensostuff/ensoyears.shtml
http://jisao.washington.edu/pdo/PDO.latest
This is OT
Asteroid (or comet) skimming through the solar atmosphere
Re: Lunar Tide effects @Ninderthana, @pochas
What would you say when you are shown that you can tow away a 12m x 80m x 2m cargo ship with 1250 tons on board (of course behind the port gates 😉 There are several methods, the one for school children is this: every time the ship begins to float a bit away from you, fasten the mooring line at a bollard (when it floats towards you, let it go). Wait, rinse and repeat often, the ship is always moving in favor of you, your investment is incomparable to the achieved effect. If you have no cargo ship, you can practice with a yacht (take care of wind).
This is what I think happens due to lunar tides and their impact on oceans, always just a little bit (e.g incomplete ebb followed by an earlier flood, etc, similar but more complex in the atmosphere). But the causal moment in time is difficult for us to measure, we can only see that current became strong or weak. I haven’t found that lunar intervals (and seasons) are of much help for assessing possible effects, there are many more signals which overlap.
Roy, here is a link to some related work I did a couple of years ago. I don’t know whether you saw it, but was discussed here at that time.
Ths zip file contains a pdf of the paper as well as spreadsheets I used to do the calculations. Caution: BIG spreadsheets.
http://www.mediafire.com/?6gtej4v2aw3vggb
ENSO’s code’s crackable.
Central Limit Theorem empowers us to illuminate attractors:
~60 Year Cycle of ~27 Day Terracentric Solar Rotation
Ninderthana,
A simple empirical fact that’s usually overlooked is that solar asymmetry is strongly related to solar activity.
I encourage you to condense your tidal torquing theory onto 1 page.
While heliospheric structure cycles in ~11 years, heliospheric rotation frequency cycles in ~22 years.
The constraint governing the ~22 year angular momentum cycles of Earth & Venus relative to the Sun is defined by the harmonic mean of the periods of the highest & lowest frequency Jovian planets, Jupiter & Neptune.
Regards.
To Rog.
“However, I just did a quick and dirty overlay plot (not good enough to post here), and although the match is good, there are noticeable differences, particularly around the periods when the SSB reverses in a double wiggle near the solar surface……
So the question of why the discrepancy is arising could be important. Any ideas?”
Those small deviations from a match are just another manifestation of the actual geometry of the barycentric motion we see in the contemporary polar plots vs the use of true sine waves on a uniform time base. In reality the angular rate of rotation of the Sun about the barycentre varies quite considerably, which is why sine waves cannot reproduce the actual motion in the periods of tight looping close to the barycentre. In the periods of inflection you have marked, the situation is rather the opposite: the angular velocity is relatively constant but the barycentre passes out and back through the surface of the Sun over a relatively short period.
It should be possible to get the match a little better than I presented here. However, producing the plot required making small manual adjustments to the parameters generating the sine waves. There is only so much time one can spend fiddling with nine variables!
The principal value in the plot is that it shows how the barycentric motion is obviously the result of the synchronized motion of the four planets. I believe it does that well enough, but it can never be made good enough to send a spaceship to Mars!
Roger, in response to a comment by Ninderthana you said:
“I think the correlation between changes in Earth’s LOD and the Solar Inertial Motion (SIM) is an indication that there are forces transmitted via the interplanetary magnetic field and ‘flux tubes’ (T.M. NASA), modulated by solar activity levels, which in turn are modulated by planetary motion. ……….. The Solar Inertial Motion is a proxy for something else. I’m sure gravitational tides are part of it, but I think electromagnetic ‘tides’ are playing an important part too.”
Can I draw your attention to the following comments by Standish & Williams in relation to the Fundamental Ephemerides DE405/LE405 from JPL:-
“8.3 Equations of Motion
Equations of motion describe the forces upon the planets, Sun and Moon which affect their motions and torques upon the Moon which affect its orientation. It is believed that the equations described here are correct and complete to the level of accuracy of the observational data. I.e., given the accuracy of the observation, there is nothing to suggest that other forces or different forces are present in the solar system. The uncertainties existing in the planet’s and Moon’s motions are certainly explainable, considering the uncertainties in the observations and in the fitted initial conditions and dynamical constants.”
This does not necessarily contradict the possibility of correlations between Earth’s LOD and SIM, but it does appear to argue strongly against an effect on LOD of any form of extra-terrestrial electromagnetic phenomena. If such did exist, one would expect them to show up somewhere else in the construction of the ephemeris. As far as I can see, Standish & Williams make no direct reference to LOD variations, but the effect could be buried and hidden deep in the calculations.
(Disclaimer: I am aware of the considerable discussion around the possible causes and effects of LOD variations, but I have not followed them closely and very little about the details.)
Roy, thanks for the further info on the sine-wave construction. You’ve demonstrated that it is possible to approximate SIM with sufficient accuracy for some useful purposes using remarkably simple equations. This is brilliant!
Regarding the ‘no room for other forces’ logic of the Ephemeris construction. I’m still entertaining the possibility that Miles Mathis is correct and that a foundational repulsive E/M force opposing gravity has been hidden in Newtons gravitational law all along. The sums work out just as they always did, except Mathis demonstrates that his tiny force can account for the problems in orbital calculations with the ‘innate force’ decreasing and increasing during orbits. One of his readers has also discovered a pushing force buried in Lagrange’s calculations.
I think what is being overlooked here is the inductive effects of the solar plasma sheet being modulated by the strength of sun’s magnetic fields, the magnetic poles of the sun are tilted ~12 degrees off of axis of rotation. The declinational extent of the solar neutral plasma sheet is modulated by the balance of the magnetic fields of the outer planets above or below the solar equator.
The Earth Moon system is driven in its declinational movement as a counterbalance leveraged over the barycenter of the earth/moon system, that is also trying to stay centered on the solar equator but has residual N/S effects due to the relative moving positions of the other planets on the solar Z axis.
Over time the increases and decreases of the total solar system magnetic flux and orientation to the center of the galaxy greater magnetic field patterns, shifts the angle of the tilt of the solar magnetic poles.
The N/S lunar declinational component of the tidal effects on the atmosphere and seas, as it shifts through its nodes may be a lot of what drives the ENSO patterns, with consideration of the inductive effects of the synod conjunctions with the Earth as the tidal forces modulate together with the “sun angle phase shifting” tidal forces to made the madden Julian oscillation move as it does, also force the trades to weaken and strengthen along with the combined tidal effects acting upon the sea water circulation via tidal harmonics that keep shifting in response to changes in solar wind strength and magnetic field flux, as the 18.6 year culmination angle processes.
I think that at times when the solar system is further from the spiral arms of the compressional waves passing through the galaxy the solar magnetic field angle relative to the axis of rotation decreases to nearly the same orientation. This would then allow the solar wind magnetic neutral sheet to become stable closer to flat with regards the solar equator. The magnetic induction forces that drive the lunar declination off of the ecliptic would disappear and the moon would loose declinational angle due to tidal loading as the driver mechanism fades.
A couple of things would occur if that happened, the declinational tides in the seas and atmosphere would behave like they do during the short periods that they are the same in the current regime, large blocking highs, and synchronized meridional flows would make for constant La Ninos, and produce large standing waves in the atmosphere that will very effectively push equatorial heat and moisture to the pole constantly.
I think this is the dominate global circulation and reason for the long duration of the ice age glacial periods. The effect of the flipping of the magnetic pole orientation of the sun following the same dynamics that is used in MRI scans. Saturated magnetic fields align most spinning atoms then they snap back to their molecular required spin axis when the fields are dropped.
Once the lunar declination was very close to the same as the ecliptic there would be solar eclipses at most New moons and lunar eclipses at most full moons. Much very old folk lore from periods before the Holocene started are rife with horror stories concerning eclipses (probably for this reason).
At the present time the homopolar inductive forces into the solar system from the greater galactic fields are greater between the sun and the galactic center, as the solar system moves tangentially through its orbital eccentric and declinational movements differential electromotive forces are induced into the angular momentum of the planets, greater in both Z axis and orbital rotational speed (through spin orbit couplings between the whole system) further confounding the short term periods.
This is most noticeable with the Jupiter Saturn synod progression with the enhancement of the stronger/weaker ~60 year patterns strongest when the Synod conjunction is closest to the line between the sun and the center of the galaxy. I would expect to see the same type of effect with the Uranus/Neptune Synods but I lack data as to how their progression relative to the galactic center goes. But on April 20th, 1993 there was a synod conjunction of Uranus and Neptune which the earth had a Synod conjunction with on July 12th, 1993.
It is my contention that this pair of outer planets that persisted in the NH summer until 2009-2010 when it was joined by Jupiter as it was first synod with Neptune on September 19th 2009 then synod with Uranus on September 24th, 2010, has lead to the pulse of “global warming” the team are blaming on CO2. I think that all of these outer planet synods at this juncture enhanced the # of CME’s and electro-scavenaged ions out of the cloud forming regions of the atmosphere and allowed more solar insolation to reach the seas.
Just some thoughts I have been having lately, Richard
Recently Ulric Lyons suggested the ~9a solar asymmetry was due to SEV.
I checked his assertion and a generalized extension of it by deriving the following average periods (in years):
JEV = 11.05497059
SEV = 9.015953522
UEV = 5.024072375
NEV = 4.496950409
It’s trivial exercise to further derive from these periods all of the following:
2.6, 3.8, 9.3, 3, 6, 8.85, 18.6, 2.37, 4.75, 9.5, 3.2, 6.4, 12.8, 44, ~1800.
I trust that Ninderthana will recognize some of these and reconsider the term “fossil” (when referring to solar system – Earth-Moon resonances).
When we derive such periods, we’re not making new discoveries. Rather, we’re independently rediscovering simple ancient knowledge.
Point of clarification: Above where I refer to an ~11 year cycle in heliospheric structure, I mean in amplitude. The amplitude cycle is ~11 years while the frequency cycle is ~22 years.
All of this is consistent with Ninderthana’s tidal torquing theory, which I suggest be condensed onto a single page in order to guarantee efficient transmission to as large a pool of bright (but potentially overextended) thinkers as possible.
Ninderthana, re comment on March 21, 2013 at 12:35 pm:
I appreciate your extensive comment. My own experience with SIM goes back somewhat further. I have gone around the subject in several areas since about 1995, But by probably about the same time as you I had just about decided that correlations with solar activity in particular were just not close enough to be definitive. I became interested in the ideas about possible tidal effects after reading the NASA report by Hung. The note we are looking at here is really a summary of some of my conclusions drawn from many sources over recent times, including my own doodling.
That includes some ideas and information absorbed from the papers on your website, which I have been visiting on and off since not long after you set it up. I have appreciated much of your work because we seemed to have moved on to the same page, and that is quite reassuring.
As you have been so complimentary in affirming, one of the key messages here is the existence of so many synchronous linkages throughout the whole system, and the intricate interaction between gravitational and tidal forces.
The processes by which tidal forces act is still a vexed question. Your tidal torquing model may very well be a part of the answer.
“The relative role of Mercury changes from 2.3% to 14.6%,”
Well that’s something that Hung could have easily tested for, and it appears that it does not really matter whether Mercury is at perihelion or not. Both Mars and Ceres have a strong role in flare events, I can’t see what that has to do with tidal effects.
In fact Hung is a perfect example of what happens when one limits the study to the bodies that fit the *preferred* mechanism. You miss all the big events that involve Mars and Ceres, like the Carrington event.
The only effect there can be is tidal. There are no gravitational effects due to motion of the barycenter.
Why? Because to the degree that gravitational forces are constant, they act on every part of a body exactly the same. Hence, there is no differential stress induced in the body, and no net reaction. The body is in “free fall”. Skydivers can tell you, you don’t feel any sensation of motion when you are in free fall. At least, not until you hit the ground, which arrests that state of motion.
So, the only thing which can produce any dynamical change is the difference in gravity acting on one part of the body versus how it is acting on another, i.e., the tidal forces.
“The only effect there can be is tidal.”
That Mars and Ceres have strong effects, says that there must be another mechanism at play.
@ Ulric Lyons, 7:59 pm
If it was not aready mention in the forum, Steve Holmes made an analysis of Ceres the playball of Jupiter
http://www.steveholmes.net/jbaa
Mucho diagrams, enjoy 🙂
@ Chaeremon, 7:47 am
Yes I did. Very nicely done.
Jupiter has a lot to answer for.
@ Chaeremon
More to the point is if the Sun shows a response at say Jupiter-Ceres syzygies.
Ulric Lyons says:
March 22, 2013 at 7:59 pm
“That Mars and Ceres have strong effects, says that there must be another mechanism at play.”
Maybe there is. Maybe it causes motion of the planets and Sun which tends to either bring the Earth into the path of, or shield it from, galactic cosmic rays. Or, something. But, it has to be a secondary effect like that which is unrelated directly to motion relative to the barycenter, because gravity does not work like a centrifugal force.
A body in orbit feels no differential stresses at all apart from the variation in gravity over the extent of the body, i.e., the tidal forces, even in a highly elliptical orbit when whipping around the periapsis. The evidence for this in 60 odd years of spaceflight is overwhelming, and it is consistent with the theories of gravity from Newton to Einstein.
The root cause of 9 year solar asymmetry could be the beat of the harmonic mean of the periods of the highest & lowest frequency Jovian orbits (2*(J+N) ~= Hale) with absolute solar barycentric radial acceleration ((J-N)/2 ~= 6.4a) or a confounded variable (such as those which captured the attention of the Mayans).
(22.13934389)*(6.393249363) / (22.13934389 – 6.393249363)
= 8.989044617 years
The boundaries of this timing framework are determined solely by the highest & lowest frequency Jovian orbits (J & N).
With this in mind, I encourage everyone to review the timing framework outlined in this landmark paper:
Dickey, J.O.; & Keppenne, C.L. (1997). Interannual length-of-day variations and the ENSO phenomenon: insights via singular spectral analysis.
Click to access 97-1286.pdf
J, N, & the terrestrial year can very simply account for all of the clearly illustrated beats & envelopes.
There’s more to say when time & opportunity permit…
Bart says:
“Maybe it causes motion of the planets and Sun which tends to either bring the Earth into the path of, or shield it from, galactic cosmic rays. Or, something.”
Ceres is too small to do that, and it’s the solar activity that changes, not Earth’s orbit.
@Paul Vaughan
I know the Ne-Ju nodal cycle is very close to the average sunspot cycle, but there is nothing meaningful going on regularly between the gas giant’s angular placement at that frequency,
Ulric, it’s just a perceptual choice between proximate & distal framing in the hierarchy. J & N set the boundary conditions of the whole system. Nothing in the system is free of those constraints. The approximate periods of everything in the system can be derived from J & N. For example, here’s what I was holding in reserve:
It’s a simple exercise to reframe to JEV & EVMa:
(22.10994117)*(6.359889012) / (22.10994117 – 6.359889012)
= 8.928019443 years
Tim Channon suggests the sunspot asymmetry period is ~8.9a. I hope he’ll soon have more to say, as the time is looking ripe.
Any clock that works will do for keeping time. If you prefer SEV, that’s fine by me. There’s a reason why I’m provoking an alternative view, but the time isn’t yet right to expand.
looks to me like the relation (s) between the planets and the sun are that of an electric motor – gravity holds it together but electro magnetic waves give the opposing spins of the “armature” V.S. the “Fields”
While not always required, the solar system has the option of “acting like” this:
http://wki.answers.com/What-is-a-make-or-break-engine
[Moderation note] URL broken
@Paul Vaughan
Unless there is a direct and continuous positional correlation, as with JEV and the sunspot cycle, you have not got your finger on the pulse. Wandering off into the field of approximate resonance does not address the question of the physical nature of what is occurring at syzygies etc, which is the topic at hand.
Ulric, are you suggesting that negative sidebands are physically meaningless?
@Paul Vaughan
I can’t see anything that is not directly related to synodic periods, showing up regularly in the solar data. (And I meant axial period earlier, not nodal cycle)
As per Paul’s suggestion, I have put up a short explanation of the VEJ Tidal-Torquing Model as well as some of the physical features of the long-term solar activity that could be explained by this model.
http://astroclimateconnection.blogspot.com.au/2013/03/thevenus-earth-jupiter-vej-tidal.html
Hello, I find figure 7 in the referenced paper “Do Periodic Peaks … Influence …” the most exciting, it shows “the heliocentric latitude of Venus (solid curve) and the mean distance of Jupiter from the Sun in astronomical units (dashed curve), between the years 1000 and 2100 A.D.”
But I seem not to understand 1 word: (max distance + min distance) / N = arithmetic mean distance, and this 1 resultant distance cannot vary with time (but in the plot it does) ?
@Ninderthana
Surely those two early minima in your article are so early, because they were both preceded by at least two strong cycles?
Re. the footnote…
‘As a footnote: In the work on the tidal theory there is a very significant cycle of 110.3 years. It is interesting to note that 110.3 x 1.61803(phi) = 178.48 years, within 0.31 years of the nominal José cycle period as derived above from the Jupiter – Saturn synodic.’
The Jose cycle can be viewed as two periods of 89 years, each consisting of 8 solar cycles lasting 89/8 years each.
If the 110 year cycle is seen as 2 periods of 55 years, the Jose pattern could be: 34 / 55 / 55 / 34.
The solar cycle split would be 3 / 5 / 5 / 3. Apart from 110 itself these are all Fibonacci numbers.
May I suggest a few possible alternatives to Table 2, column ‘Factors of synodic multiples’?
J-V 276: 5 x 55 = 275
J-Me 728: 2 x 3³ = 729
V-Me 451: 2 x 3² x 5² = 450
J-U 13 + J-N 14 = 27 = 3³
(U+N are ‘twins’: same rotation rate in opposite directions, 1:2 orbital period ratio)
Maybe just a curiosity, but the J-Ma synodic period of 2.23525 is very close to the square root of 5 (2.236~).
Correction: ‘2 x 3³ = 729’ should read: 3³ x 3³ = 729
3 years ago I stopped working on this (JEV / JEVMe) problem, believing I had reached the (practical) limits of what I could do with my computing resources. I still have the exact same computing resources, but I’ve reconsidered.
Update on exploratory activities of past few days:
1. I theoretically derived Hung’s (2007) 7 year JEVMe cycle and then isolated it empirically from daily resolution NASA Horizons output.
2. I proceeded to check in detail the coherence of beats of JEVMe (~7.2a) & JEV (~11a) with sunspot asymmetry, solar global magnetic field, & ENSO. While the framework stays close on a timescale of ~2 decades, it keeps drifting steadily out of alignment on longer timescales. In contrast, a framework based on just J & N maintains long run multivariate coherence.
I’ll keep going wherever empirical exploration leads, sharing more details if/when time/resources permit.
update & cautionary note:
I found an error in one of the works I was consulting. It was a simple mismatch of year-labels with tick-marks on a graph at just one end of the graph but not the other.
This may sound like a minor detail, but it substantially affects my conclusions (March 30, 2013 comment immediately above).
Going back to double-check everything pays. I have to keep both candidate timing frameworks on the table in light of this development.
This is one tedious piece of work. It will probably be some time before I comment further.
Tip for anyone working with Venus & especially Mercury:
Use at least daily resolution data.