


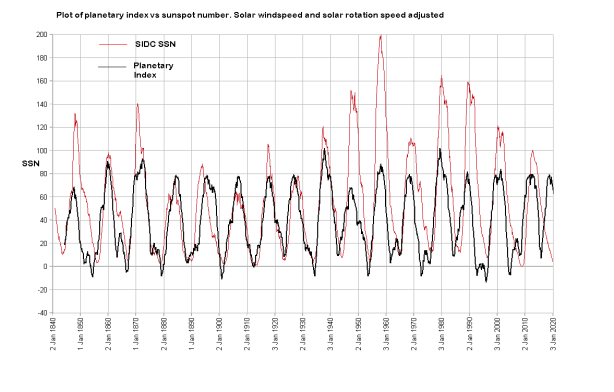
The Solar Cycle Clock
By Roy Martin
Revised April 16 2013
 Summary

Modern observations and research have given us a great deal of knowledge and understanding of the behaviour of the Sun and the underlying processes. [edit] And yet there is still no generally accepted explanation of why, even after sometimes significant excursions, the length of the SC has averaged close to eleven years over extended periods of time.
This note continues to argue that the long term timing of the solar cycle, or Schwabe cycle (SC), is controlled by the tidal influences of the planets Venus, Earth and Jupiter.
(A PDF of this article can be downloaded here. Click on plots to open full size. )
Introduction
In a previous study (1), it was found that the tidal effects of Venus, Earth and Jupiter produced a cycle with an average period of 11.03 years, which appeared to define the true long term SC. That conclusion was based on the analysis of calculations using the Index proposed by Hung (2009) (2), and while it seemed a valid result, was possibly questionable because it was based on a derived Index giving equal weight to the effect of each planet rather than direct calculations with correct weighting. Also, the conclusions were based primarily on detailed analysis of under two hundred years of data, with only spot checking of some earlier periods.
This study seeks to overcome those limitations using the simple first-principles methods described in the next section, including extending the period covered from 1500 to 2050. The primary objective is to establish if there is a strong enough correlation between the planetary tidal forces and observed solar activity to affirm the basic conclusions of the earlier study, and thus warrant acceptance as a hypothesis for further investigation.
Methods
The resultant tidal force vector (TFV) from the planets Venus. Earth and Jupiter was calculated from the basic tidal formula, for the period from 1500 to 2050. The mechanism or mechanisms by which the primary TFV may affect the Sun is assumed to be by modulating the velocity of the  horizontal flows on the surface of the Sun. However, while that concept is simple, analysis is expected to be very complex. This is referred to in more detail in the discussion below. In this study the resultant TFV is therefore considered to be a proxy for the final integrated effect. Although it is recognized that orbital eccentricities and inclination may also affect how tidal forces affect the Sun, it is assumed here that they are small enough to be initially disregarded. Mercury is not included at this stage. Although the tidal force caused by Mercury is about the same as that of the Earth, the short orbital period, and thus the shorter times for which it’s tidal force acts in one direction, is assumed to reduce the effect through the assumed mechanism.
The magnitude of the tidal force vector was plotted on a time scale from 1500 to 2050, in segments of fifty years. Smooth curves drawn through the high points spaced at 3.24422 year intervals appear as five sinusoidal curves, which are arbitrarily numbered 1-5 starting from the first peak after 1900.
Note that the orbital data used is given to at least eight significant digits, and the calculations were run to eight decimal places, but calculated values quoted here are generally rounded down to five or six digit accuracy. Consequently, small differences may occur between rounded values.
Observed SC data from 1700 to the present was obtained from SIDC. SC data for the period from 1500 to 1700 is not available from direct observation, but monthly data reconstructed from auroral observations and other sources was obtained from Letfus (1993) (3), for the 1500 to 1700 period. The monthly sunspot data with even numbered cycles reversed is plotted on the same time scales as the tidal plots.
The plots for the four fifty year periods from 1850 to 2050 are shown in Figures 1a to 1d. These are described and analysed in the following section.

Figure 1a

Figure 1b

Figure 1c

Figure 1d
Results
There are a number of fundamental characteristics of the TFV illustrated by Figures 1a to 1d, some of which appear to be highly significant:-
- The shortest cycles in the plot have a period of 0.64885 years, which is the synodic period of Venus and Jupiter
- The intermediate peaks forming the five long waves have a constant period of 3.24422 years, exactly five times the V-J synodic period.
- The five long waves all have a period of 110.304 years, which is exactly 34 x 3.24422
- The average spacing of the five long waves is 110.304/5 = 22.0608 years.
- There are ten periods marked out by the peaks of the 110 year waves and the points at which they cross, which are marked by red lines, hereafter referred to as nodes. These appear to vary very slightly in length (which may be an artefact of plotting), but over the full 1500 to 2050 time scale, covering 50 cycles, clearly have an average period of 11.0304 years.
- Close to each of the 110 yr. period nodes, there are characteristically symmetrical patterns in the 0.6488 periods. Those close to the long wave peaks are designated W and X, and those close to the cross over points Y and Z. The patterns tend to alternate, but sometimes occur in succession. Different sequences in the alignment of the planets occur at around each of these points.
- The periods between the nodes marked by the red lines are either 10.3815 or 12.0037 years long, designated q1 and q2 respectively.
We find that q1 = 16 x 0.64885; q2 = ~11 x 1.09208 yrs., the J-E synodic, and also q2 = (37/2) x 0.64885. (Note: ~11 => 10.9916) - Between 1500 and 2050, q1 and q2 occur in the ratio of 3:2, and mostly in groups of five such that 3 x q1 + 2 x q2 = 55.152 years, exactly half the long wave period. I have dubbed this grouping of periods a Quintet cycle. The average of the q1 and q2 periods, both in each Quintet group and over the full period, is also 11.0304 years. It is noted that the 3 x q1 and 2 x q2 periods do not occur in any particular sequence within the 55.152 year periods.
Assuming that the planetary tidal forces from V-E-J provide the primary timing for the SC, these calculations directly imply that the long term average length of the SC is 11.0304 years. Similarly the long term average of the Hale cycle becomes 22.0608 years.
The actual average SC length over the full set of observed and reconstructed periods, from cycles -22 to 23, covering 46 cycles from 1501.5 to 2008.9, is indeed 11.03 years. Also, analysis of the distribution of SC lengths over time shows prominent peaks in occurrence at 10.4 and 12.0 years.
This set of characteristic cycles in the tidal forces exerted on the Sun provide an accurate framework against which to assess possible correlations with the observed and reconstructed features of the SC.
We see from Figures 1a to 1d that all solar Rmax dates are aligned at or close to the nodal points of the 110.3 year waves. More particularly, all odd numbered positive Rmax dates are closely associated with the nodes at the high points of the waves, and all even numbered negative Rmax dates are closely associated with the nodes at the intermediate crossover. These associations are consistent back to 1500. They are particularly relevant as the most likely basis for the Gnevyshef-Ohl Rule, which states that the sum of the sunspots occurring within positive numbered cycles is mostly less than the sum in the following odd numbered cycle. Altogether, these observations are highly significant because they imply a correlation over the >500 year period covered of 100%, and so are analysed in more detail.

Figure 2
Figure 2. is a cross plot of the dates defined by the nodal points preceding each solar cycle, set at regular 11.0304 intervals, vs. the observed and reconstructed solar Rmin and Rmax dates. The R2 values of 0.9999 and 0.9998 respectively again demonstrate an almost perfect correlation of the observed dates with the regular 11.0304 year period in the resultant tidal forces from Venus, Earth and Jupiter. This is quite definitely not a matter of chance. With such close correlations, it is logical to assume we can now use the nodal dates from the full 1500 to 2050 plots as reference points for further analysis of the relationships between solar events within each cycle.
Figures 3.,& 5. show a number of these relationships.

Figure 3. Times at which solar minima and maxima occur after
the previous node date of the 110 year cycle.
The time of the tidal node before the SC under consideration has been used for the analysis in Figures 3. & 5.. This is consistent with a number of studies that show that solar activity in cycle n appears to be associated with events around the maximum of cycle n-1.
In Figure 3., the times of Rmin and Rmax are seen to fluctuate about a mean line by +3.12/-3.48 and +4.29/-4.74 respectively, with no visually detectable trend. (There may be small trends, but in such a short and irregular series, with higher start and lower end values, it is unlikely they would be reliable indicators.) They appear to vary at random in relation to the nodes, but the absence of any significant trend can be taken as further confirmation of the high correlation between observed or  reconstructed dates in relation to the timing reference dates shown in Figure 2. Another test of the validity of the correlation would be to assume that instead of using the tidal node timing dates, which average 11.03 years over the long term, we were to use node dates based on a regular 11.10 year period, which is around the most commonly accepted SC length. That would create a difference over the study period of 47 cycles of:(11.10 – 11.03) x 47 = 3.29 years, enough to introduce a significant trend, which seems inconsistent with observations.

Figure 4. Individual solar cycle rise times.
From 1700 until the present, the plot in Figure 4 is essentially the same as the many published plots of rise times. Inclusion of the reconstructed values from 1500 to1700 provides us with the opportunity to observe that the behaviour of the Sun in the twentieth century was very much like that in the sixteenth. Also, we can see the longer and slower rise times associated with the low solar activity in the seventeenth and early nineteenth centuries, during the Maunder and Dalton minimum periods respectively. Overall, this pattern again appears to be rather random. There do not appear to be regular continuing cyclic variations on any time scale.

Figure 5
Figure 5. Cross plots of solar cycle rise times vs. the times of Rmin and Rmax after the previous 110 year cycle node.
The individual solar cycle rise times shown in Figure 4. appear to roughly track the times of Rmin and Rmax in relation to the previous node, however Figure 5. reveals that there is no significant correlation between solar rise times and the time at which Rmin occurs after the tidal node. An R2 value of only 0.029 implies that the different rise times actually occur at random in relation to the 11.03 year periods. Hence the very irregular plot in Figure 4., which looks somewhat like a random walk. Thus solar rise times are not a direct function of the time by which the SC may occur earlier or later in relation to the timing reference dates, so we must conclude that rise times and the length of the solar cycle cannot be predicted simply by the timing of Rmin. On the other hand, with an R2 value of 0.283, the rise time does appear to correlate a little with the time of Rmax after the previous tidal node, implying some degree of influence from the tidal action of the planets on the rate of rise and hence the timing of Rmax. That would also be consistent with the conclusions from various studies that the magnitude of Rmax .in a cycle is a function of events shortly after Rmax in the preceding cycle.
Discussion and conclusions
We must observe two important caveats when discussing how planetary tides may affect solar activity. The first caveat is that planetary tidal tides are too weak in relation to the gravitational force at the surface to cause more than a few mm. vertical displacement of the surface. This acknowledged fact is the reason why suggestions that the planets could affect solar activity were flatly dismissed for so long. That thinking completely ignored the possible effects of horizontal components. The second caveat is that planetary tides do not directly affect the phenomena described by theories on the solar dynamo. The solar dynamo is clearly the primary driver of events in the Sun. However, evidence suggest that tidal effects can influence both the timing and magnitude of solar activity.
In the introduction, reference was made to the assumption that the mechanism by which the primary TFV can affect solar activity is a modulation of the velocity of the horizontal flows on the surface. There is an observed meridional flow on the surface from the equator towards the poles. Variations in the velocity of the meridional surface flow are observed to occur within SC’s and over the longer term. Velocities occurring in one SC are seen to correlate well with the number of sunspots in the following SC. Further, the horizontal components of the TFV are large enough to significantly affect the velocity of the meridional flow during the time of a SC. The solar dynamo and the sequence of events within a SC have been studied extensively and in great detail by many over the past few decades, and rather than try to make a brief summary here, I refer to work done by Katya Georgieva et.al.(4) (5), in particular: Solar dynamo and geomagnetic activity (2010) (4). These contain very clear explanations of the events in the SC giving rise to the meridional surface flow and the events leading to the variations in sunspot numbers, with extensive supporting references. The results derived here show that the occurrence of events in the Sun are closely synchronized with periodic variations in the tidal forces exerted on the Sun by the planets Venus, Earth and Jupiter. This synchronization will have taken millions of years to evolve and become firmly established in the present configuration, but appears to have been stable during the current era.
What can be regarded as the clock timing of the SC is seen to be maintained by the synodic periods of Jupiter-Venus and Jupiter-Earth, as detailed in Items 7. and 8. in the results section above. The 10.3815 an 12.0037 periods in the planetary tidal forces appear to be fundamental in controlling the length of the Schwabe and Hale cycles over periods of centuries. Figure 3. shows that the dates of Rmin and Rmax are, on at least century time scales, constrained in relation to the nodal dates defined by the tidal forces of V-E-J. The apparently random cycle-to-cycle variations in relation to the nodes can largely be attributed to accountable variations in the meridional velocity at the surface, and the prevailing level of diffusivity. It has also been shown that the alternating high and low nodes are the most likely driver of the differential between positive and negative numbered SCs described by the Gnevyshef-Ohl Rule.
Similar conclusions have also been reached by Wilson (6), using a different type of analysis based on the alignments of Venus, Earth and Jupiter, as distinct from the calculated tidal forces approach of the current study. In particular, that study identified different planetary alignments at odd and even solar maxima associated with the Gnevyshef-Ohl Rule. The findings of the current study complement and support Wilson’s observation, and together they present a strong case for a planetary cause of the long term timing of the solar cycle.
In another study, Wilson (7) proposed a tidal torquing model as the mechanism through which the planets control the synchronization with the timing of the SC. At the present time it is my opinion that this proposition is open to question, based on my understanding of the most likely variations in the distribution and timing of the tidal forces acting on the Sun.
While this study establishes the underlying forces causing the SC to be synchronized with the the motion of the planets, it does not provide us with an immediately obvious means of determining the actual times of Rmin or Rmax. Investigations into this deficiency are continuing, noting that in the previous study, based on the Hung Index(1), close correlations were found between elements of the tidal Index plot and the actual times of Rmin and Rmax.
Mercury plays a definite role in the planetary tidal effects on the Sun, but after a brief look at plots with Mercury included, it was decided to focus first on the effects of Venus, Earth and Jupiter, for direct comparison with the earlier work (1). The results of this current work will make it easier to understand and appreciate the particular and significant role played by Mercury when it is included.
While this study establishes the underlying forces causing the SC to be synchronized with the the motion of the planets, it does not provide us with any obvious means of determining the actual times of Rmin or Rmax.
Mercury plays a definite role in the planetary tidal effects on the Sun, but after a brief look at plots with Mercury included, it was decided to focus first on the effects of Venus, Earth and Jupiter, for direct comparison with the earlier work (1). The results of this current work will make it easier to understand and appreciate the particular and significant role played by Mercury when it is included.
References:-
- Martin, R., 2009. Relations Between Solar Activity and Solar Tides caused by the Planets
Defined, http://www.climatestop.com/SolarTidalInfluencesofVEJ_W01.pdf - Hung, Ching-Cheh, 2007. Apparent Relations Between Solar Activity and Solar Tides
Caused by the Planets, NASA/TM-2007-14817. - Letfus, V., Solar Activity in the Sixteenth and Seventeenth Centuries, Solar Physics 145:
377-388, 1993. - Georgieva, Katya, Kirov, Boian, 2010, Solar dynamo and geomagnetic activity,
arxiv:1003.2533 (pdf) - Georgieva, K., et al, Planetary tidal effects on solar activity,
http://www.climatestop.com/KGeorgieva_Pulkovo2009.pdf - Wilson, I.R.G., 2011, Do Periodic peaks in the Planetary Tidal
Forces Acting Upon the Sun Influence the Sunspot Cycle?
The General Science Journal, Dec 2011, 3812.
[first published and copy-righted online in 2010]
http://gsjournal.net/Science-Journals/Essays/View/3812 - Wilson, I.R.G., 2011, Why Does the Solar Cycle Keep Re-synchronizing Itself With the Gravitational Force of Jupiter
That is Tangentially Pushing and Pulling Upon the Venus-Earth Tidal Bulge in the Sun’s Convective Layer?
http://astroclimateconnection.blogspot.com.au/2012/04/why-does-solar-cycle-keep-re.html

Thanks for getting this formatted and posted Tim C. I’ve had a busy day with some great progress in conference with Oldbrew and Gray on the Phi/Fibonacci solar system work. I’ll read an comment here tonight. Thanks Roy for the paper.
“and mostly in groups of five such that 3 x q1 + 2 x q2 = 55.152 years, exactly half the long wave period. I have dubbed this grouping of periods a Quintet cycle”
Landscheidt was quite keen on groups of five if memory serves me right.
JM: I think Landscheidt identified periods of ~36 years in groups of five, which adds up to the Jose ‘cycle’ of ~179 years. But these were overlayed fractal style with other five-groupings at other timescales, which precipitated ‘phase shifts’ in the sub-cycles under certain conditions.
The first sentence of the post, killed it.
Never read past it 😦
Just sayin’.
[co-mod: the author, who is in a very different time zone realised this on seeing the article published, hindsight effect on oops. So he agrees with you. I’ve changed the line but tried to acknowledge the fact it has changed clear without making a visual mess at the start. –Tim]
I would like to study the graphs, but the dates are invisible (and this isn’t intended as sarcasm).
u.k.(us) said:
“The first sentence of the post, killed it.
Never read past it”
Please re-read first sentence as:
‘Modern observations and research have given us a great deal of knowledge and understanding of the behavior of the Sun and the underlying processes.’
Then please do read on…
Paul Vaughan said:
“I would like to study the graphs, but the dates are invisible.”
Paul, readability may depend on screen resolution; try clicking on them to see full scale.
Roy,
The work that you are doing on the Hung/Wilson VEJ Tidal model is very impressive
as it brings up a number of areas of study that need to be followed up. I would greatly
encourage you to follow up on the interesting ideas that you are finding.
Having said this, however, I must ask that you properly cite the contributions
that I have made to this area of study. Many of the results that you are finding
have already been published by me in copy-righted on-line posts and published
peer and non-peer reviewed journals. All I ask is that when you make a conclusion
from your work, you check to see if others [including myself] have made
similar conclusions before yours.
[Note: I have moved on from the simple VEJ tidal model as believe that
a VEJ tidal torquing model is much more physically plausible.]
Here are a few comments on your post:
1. The work you have done expands on the Hung/Wilson VEJ tidal model:
References:
Wilson, I.R.G., 2011, Do Periodic peaks in the Planetary Tidal
Forces Acting Upon the Sun Influence the Sunspot Cycle?
The General Science Journal, Dec 2011, 3812.
[first published and copy-righted online in 2010]
http://gsjournal.net/Science-Journals/Essays/View/3812
Both of Hung and I developed this model independently of each other
in 2008 and both of us have published our work in [non-peer reviewed]
copy-righted publications online. I would appreciate it if you would
acknowledge both of our publications when referring to the tidal model.
2. Roy said:
“Assuming that the planetary tidal forces from V-E-J provide the primary timing for the SC, these calculations directly imply that the long term average length of the SC is 11.0304 years. Similarly the long term average of the Hale cycle becomes 22.0608 years.”
This is essentially what I said at my site about the VEJ Tidal toquing model
on March 2012:
http://astroclimateconnection.blogspot.com.au/2012/03/planetary-spin-orbit-coupling-model-for.html
My blog says:
“All together there will be four periods of 11.07 years, with
the gravitational force of Jupiter, increasing the Sun’s rotation
rate over the first and third periods of 11.07 years, and
decreasing the Sun’s rotation rate over the second and fourth
periods of 11.07 years.
Hence, the basic unit of change in the Sun’s rotation rate (i.e.
and increase followed by a decrease) is 2 x 11.07 years =
22.14 years. This is essentially equal to the mean length of the
Hale magnetic sunspot cycle of the Sun which is 22.1 +/- 2.0 yrs)”
3. Roy says:
“More particularly, all odd numbered positive Rmax dates are closely associated with the nodes at the high points of the waves, and all even numbered negative Rmax dates are closely associated with the nodes at the intermediate crossover. These associations are consistent back to 1500. They are particularly relevant as the most likely basis for the Gnevyshef-Ohl Rule, which states that the sum of the sunspots occurring within positive numbered cycles is mostly less than the sum in the following odd numbered cycle.”
This is just a restatement of the conclusions that I made of my 2010 paper:
Wilson, I.R.G., 2011, Do Periodic peaks in the Planetary Tidal
Forces Acting Upon the Sun Influence the Sunspot Cycle?
The General Science Journal, Dec 2011, 3812.
[first published and copy-righted online in 2010]
http://gsjournal.net/Science-Journals/Essays/View/3812
and subsequently on my blog site:
See pages 9 to 12 and figure 2a and 2b
The concept you discuss is also included in figure 8 of my earlier
publication which relates the relative orbital positions of Jupiter
and Saturn with the changes in the rotation of rate of the Sun
and odd and even sunspot cycles:
Wilson, I.R.G., Carter, B.D., and Waite, I.A., 2008,
Does a Spin-Orbit Coupling Between the Sun and the
Jovian Planets Govern the Solar Cycle?,
Publications of the Astronomical Society of Australia,
2008, 25, 85 – 93.
http://www.publish.csiro.au/paper/AS06018.htm
Again, I would really appreciate it if you would cite my papers.
4. Roy said:
“In Figure 3., the times of Rmin and Rmax are seen to fluctuate about a mean line by +3.12/-3.48 and +4.29/-4.74 respectively, with no visually detectable trend. (There may be small trends, but in such a short and irregular series, with higher start and lower end values, it is unlikely they would be reliable indicators.) They appear to vary at random in relation to the nodes, but the absence of any significant trend can be taken as further confirmation of the high correlation between observed or  reconstructed dates in relation to the timing reference dates shown in Figure 2.”
This is essentially what I have published on my blog at:
http://astroclimateconnection.blogspot.com.au/2012/04/why-does-solar-cycle-keep-re.html
Why Does the Solar Cycle Keep Re-synchronizing Itself With the Gravitational Force of Jupiter That is Tangentially Pushing and Pulling Upon the Venus-Earth Tidal Bulge in the Sun’s Convective Layer?
where I said:
“In all but two cases between 1750 and 2030, the time of a solar minimum is tightly synchronized
with time that the change in the gravitational force of Jupiter, acting tangentially on the Venus-Earth tidal bulge, is a minimum.”
“Remarkably, if the first minimum of Solar Cycle 25 occurs in 2021 ± 2 years, it will indicate a re-synchronization of the solar minima with a VEJ cycle length of 11.07 +/- 0.05 years over a 410 year period [6].”
Again, I would appreciate if you would cite my published [and copy-righted] work.
Cheers,
Ian Wilson
Normally I would have written an introduction to Roy’s post which would have included a mention for the other contributors to the field, including Ian WIlson and also Ray Tomes, who calculated the same VEJ relationships back in the 1980’s. Regretfully I was busy yesterday and asked Tim C to format and post the article. I think it’s generally a good idea for anyone working in this field to acknowledge the work of others directly in their articles. However I’m sure Roy didn’t intend anyone to think he was proposing entirely novel knowledge here. That said his approach is significantly different to that taken by others, and he can hardly be blamed for arriving at a similar (though not identical) solar cycle length to that found by other researchers.
The fact Roy’s scl result is so close to that found by others a via different method should be regarded as a useful confirmation and replication.
Roy, yes I can see the dates when I zoom in. I’ll see if I can derive 110a from beat envelope theory when I get a chance.
Meanwhile here’s something to think about:

Ian: I’m e-mailing you version 2 of the article I’m drafting:
“7-9-11 Jupiter-Earth-Venus-Mercury Timing Framework and Solar Activity”
Tallbloke,
I am sorry but your explanation does not wash in this case. Roy is stating conclusion that almost identical to the ones that are found in my work and not attributing me with the discovery of these conclusions.
If he was just writing a general blog article with no cited references at the end, it would not be a problem provided he specifically stated that his conclusions were just confirming previous results. However, you have allowed a post to appear on your site that specifically includes conclusions that were discovered by me and then published in on-line copy-righted posts, non-peer reviewed journals and peer-reviewed journals. At least three of Roy’s conclusions were not discovered by not Ray Tomes back in the 1980’s, they were discovered by me. At the barest minimum, Roy needs to specifically state that his conclusions are confirming previously established results. However, academic integrity requires him to cite my prior research if he is going to make attributions at the end of his article.
As an example, take the conclusion by Roy about the Gnevyshef-Ohl Rule applying
the the Sun and the VEJ Tidal model over the last 500 years. How is this conclusion different to my showing that the Gnevyshef-Ohl Rule applies to the Sun and the VEJ tidal model over the last 300 years? I have published this conclusion in the General Science Journal (2010). I ask you to read pages 9 to 12 of this paper and look at figures 2a and 2b and then re-read Roy’s results on this topic. Scientifically, there is absolutely no difference between these two conclusions.
I believe that Roy is an honorable person and so I think that Roy would agree that he should:
a) modify his post to indicate that his conclusions are confirming previous results.
b) Include the following two references:
Wilson, I.R.G., 2011, Do Periodic peaks in the Planetary Tidal
Forces Acting Upon the Sun Influence the Sunspot Cycle?
The General Science Journal, Dec 2011, 3812.
http://gsjournal.net/Science-Journals/Essays/View/3812
http://astroclimateconnection.blogspot.com.au/2012/04/why-does-solar-cycle-keep-re.html
citing the conclusions that I have highlighted in my previous blog post above.
This is a serious matter Rog and I am trying to be as accommodating as possible.
I do not want to discourage Roy from continue his excellent research efforts, as we all benefit from his wonderful contributions. However, if he makes a major conclusion, he needs to cite prior results that have been published and copy-righted, otherwise he is in violation of international copy-right.
One further note that might indicate why I think that it is important to cite other people’s PUBLISHED work.
I discovered Hung’s 2008 NASA (non-peer-reviewed) publication on the VEJ Tidal model two weeks prior to submitting my research to the (peer-reviewed) New Astronomy Journal at the beginning of 2009. At this point, I was not aware of Ray Tomes work in the 1980’s, nor Ulrich
Lyons more recent work. I was aware of Desmoulins, J. P., (Desmoulins, J. P., 1989, http://pagesperso-orange.fr/jpdesm/sunspots/sun.html) unpublished work and so I cited him in my paper. I would have cited Ulrich’s and Ray’s work if I had known about it at the time.
Academic integrity required that I modify my paper to acknowledge Hung’s non-peer-reviewed NASA publication [October 2008].
If you read my paper:
Wilson, I.R.G., 2011, Do Periodic peaks in the Planetary Tidal
Forces Acting Upon the Sun Influence the Sunspot Cycle?
The General Science Journal, Dec 2011, 3812.
http://gsjournal.net/Science-Journals/Essays/View/3812
you will see that I modified my paper to acknowledge Hung’s work (even though it had not appeared in a peer-reviewed scientific journal).
Rather than just letting the VEJ tidal model appear in a non-peer reviewed NASA publication, I chose to take on the difficult task of trying to get a paper on the VEJ model published in a peer-reviewed scientific journal.
Having spend the good part of a year [2008] writing the paper, I spent the next year [2009] trying to get it published in two peer reviewed scientific journals.
New Astronomy [editor Willie Soon] rejected the article because one of the reviewers claimed that planetary tides could have no significant influence upon the Sun (I believe that the reviewer barely read the abstract before coming to this spurious conclusion).
Despite my deep disappointment, I re-submitted a much modified version of the paper to the Publications of the Astronomical Society of Australia (CSIRO) and was hopeful of a fair review given that I had published another solar paper in this journal in 2008. Unfortunately, the journal had changed editors, and the new editor rejected on the grounds that his Journal did not publish solar papers. I quietly pointed out to him that I had published a solar paper in his journal just one year earlier but this did not have any effect.
In desperation, I finally published the paper in the [non-peer-reviewed] General Science Journal in 2010. At the end of 2010, this Journal changed its revenue model. It removed all published papers up to that point and offered to place them back up on-line for a fee. This is why the paper is cited as being published in 2011 rather than the actual date of publication in 2010.
As you can see, I have literally put in at least two years of work to get the VEJ tidal model into the peer-reviewed press. Unfortunately, I failed in my attempt. I believe, however, that the work I have put in should be recognized by Roy Martin, particularly since he is citing references in his posted blog entries.
Hi Ian,
I fully understand your position now, and have emailed Roy for a response so we can resolve the issue quickly and amicably.
Cheers – Rog
Ian & Roger, re your respective preceding comments:
It appears that in this context I may have been remiss of not acknowledging the similarity of some of the conclusions previously published by Ian. I apologize if it seemed I was unmindful of that work. In 2010 I became aware of Ian’s paper: “Do periodic peaks in the planetary tidal forces acting upon the Sun influence the sunspot cycle?”, shortly after it was published on line. The following comment was added to my website:
“I. R. G. Wilson has also investigated the effect on the sun of the tidal forces caused by the alignments of Venus, Earth and Jupiter. He used another variation of the analysis, but his work added still further evidence that those planets are a cause of the timing and level of solar activity. A .pdf copy of his paper: ‘Do periodic peaks in the planetary tidal forces acting upon the Sun influence the sunspot cycle?’, may be found here.”
It should be noted that my Reference 1., dated April 29, 2009, was first published on my website in mid 2009. It was published on the Talkshop in August 2010, including a note claiming copyright. Ian & I had been working quite independently during 2008-9, using different methodologies, but we both concluded that the results provided further supporting evidence for the proposition put forward by Hung (2007), that planetary tidal forces on the Sun could affect the solar cycle.
I originally drafted the present paper without references, but found that in addressing the proposed mechanism it would be more relevant, explanatory and expedient to refer to the work of Georgieva, plus the other relevant references. Up to that stage I had contemplated putting rather more into the discussion, which may have included some reference to your periodic peaks paper. But I formed the opinion that because the methods and results in my paper were developed from basic data and first principle calculations, it could, and should, stand on it’s own, with a relatively succinct discussion.
However Ian’s stand is well taken, that the end point converges to some of the same conclusions as in his work. So in good faith I will add a section to the discussion referring relevant earlier conclusions, and add the reference to the paper: Do periodic peaks in the planetary tidal forces acting upon the Sun influence the sunspot cycle? However, I will demur on Ian’s request to include the second reference. Around mid 2012 I did a preliminary analysis on where and how the tidal forces can act, and to this point I have not been able to reconcile the findings there with the torquing model proposed. In any case, in the preparation of my paper I can affirm that I definitely did not draw on that work in any way.
All that said, I do want emphasize most strongly that to the best of my knowledge the methodology and the very precise results derived in my paper are original. They were developed from basic planetary and solar data, together with fundamental physical relationships, as an evolutionary step from my own previous work using the Hung Index.
Regards to you both,
Roy M.
Roger, Firefox crashed half way through sending that comment and somehow sort of doubled it.
Can you delete it and I will resubmit it.
[Reply] Roy, I’ve fixed it, but if you want to add anything, just resubmit the new version and I’ll remove the old one. Thanks for your prompt attention to Ian’s concerns. I’ll add a citation to the headline article today. – Rog
Roy,
I am very great full that you are willing to recognize prior work done by me. I am willing to recognize that you have done a large amount of work on this important topic and that you are
expanding our knowledge on some the more important findings of the VEJ Tidal model.
In future posts and publications, I will do my level best to ensure that your important work is properly recognized. Your post above tells me that you are willing reciprocate.
However, I must again appeal to you to recognize the second reference, since it was published on Roger’s site on April 22nd 2012. I am wiling to believe that you were not aware of the blog posting at my site. However, it is hard to believe that you missed it on Tallbloke’s site, as well.
Never-the-less it is possible that this migt have been the case.
You are claiming a synchronization between SSN and the “nodes” that you define in the cyclical changes in the VEJ tides. This conclusion is essentially the same as that made by me in the second reference I am asking you to cite.
I no long think that the VEJ tidal model (in its purest form) is a viable physical model for explaining solar activity since a force (provided by Jupiter) acting an spherical asymmetry in the convective layer of the Sun (where the Sun magnetic field is formed) produces tangential motions on the surface of the Sun that are orders magnitude greater than the tidal forces of Jupiter acting alone. The reason why you may be getting results that are similar to the tidal torquing model is that is the differential force of Jupiter gravity, acting on the aligned tidal-bulges of Venus and Earth, that are located on opposite sides of the Sun, that are producing the net torques that speed up or slow down the rotation rate of surface layers of the Sun.
Note: I mistakenly placed Hung’s NASA publication [non-peer reviewed] as being published in October 2008. It should have been July 2007. I submitted my paper to the New Astronomy Journal
in January 2008, not January 2009.
Roy,
I went back and looked at your March 29, 2009 manuscript posted on Tallbloke’s blog site. It is primarily concerned with a comparison between your VEJ tidal index and SSN. In this manuscript you say:
“The lack of a closer phase relationships between the actual sunspot cycles and the calculated
tidal influences is a major obstacle to full acceptance of the suggestion of a possible cause and
effect relationship between them.”
However, you do not mention anything about a remarkable synchronization between the times of SSN minima and the VEJ tidal model. I make a particular mention of this re-synchronization in April 2012 on my blog site. It is a minor point but this is why I am asking that you at least acknowledge my second reference.
That said, I have looked at your work that you posted on Tallbloke’s site as far back as August 2010 and it is quiet impressive.
I know that you were probably not aware of it, but by March 2009, I had already attempted to publish my paper in peer-reviewed journal twice and failed. I was very despondent as I thought I would never be able to publish my work in a scientific Journal. It was only in early 2010 that I was eventually able to get my paper published in The General Science Journal.
Bob Tisdale (April 15, 2013 at 1:55 am) wrote a comment in his recent WUWT article “A different perspective of the equatorial Pacific and ENSO events” that’s noteworthy in the context of our current discussion:
“ENSO adds heat to the oceans at depth. The ocean heat content data for the tropical Pacific and the tropics indicate that the 3-year La Nina events of 1954-57, 1973-76 and 1998-01, along with the freakish 1995/96 La Nina, are responsible for the warming there. Without the 1973-76 and 1995/96 La Ninas, the tropical Pacific would cool over the long term […] Refer to the negative trends between the 3-year La Ninas […]”
Note that this appears related to Hale (~22a) cycle heliosphere geometry variations, indicated by alternating neutron count rate Schwabe cycle (~11a) shapes here:

All of this is coincident with the timing of climate index network synchronizations in the Tsonis+ (2007) framework, as I’ve previously illustrated.
I may disagree ever so slightly with a few of her interpretations, but overall I have to say that Hiroko Miyahara is making some very noteworthy contributions that I am sure Talkshop readers will appreciate:
Video: Hiroko Miyahara: Solar Activity and Climate
Miyahara, H. (2011). Decadal variations of solar magnetic field, heliosphere and the cosmic rays, and their impact on climate change.
Click to access 2k_Miyahara_SORCE_brief.pdf
Miyahara, H.; Yokoyama, Y.; Yamaguchi, Y.T.; & Nakatsuka, T. (2012). Tracing the response of climate to galactic cosmic rays.
Click to access PAGESnews_2012_280-81_Miyahara.pdf
Takahashi, Y.; Okazaki, Y.; Sato, M.; Miyahara, H.; Sakanoi, K.; Hong, P.K.; & Hoshino, N. (2010). 27-day variation in cloud amount in the Western Pacific warm pool region and relationship to the solar cycle. Atmospheric Chemistry and Physics 10, 1577-1584.
Click to access acp-10-1577-2010.pdf
____
I may have more to say about Roy’s graphs later in the week (not enough free time early in the weeks…)
There are several items in recent comments to which I need to respond, but it is getting late and I have an early start in the morning. I will return to the thread after midday Aust. EST.
Ninderthana (aka Ian Wilson) said:
April 15, 2013 at 12:00 pm:
“I went back and looked at your March 29, 2009 manuscript posted on Tallbloke’s blog site. It is primarily concerned with a comparison between your VEJ tidal index and SSN. In this manuscript you say:
“The lack of a closer phase relationships between the actual sunspot cycles and the calculated
tidal influences is a major obstacle to full acceptance of the suggestion of a possible cause and
effect relationship between them.” ”
The quoted comment relates only to the indifferent match of the curve synthesized by the method described in that paper and observed sunspot data. It is a very poor match to reality, even after a lot of small trial and error adjustments to the cut off level to isolate the top part of the plot; even small variations destroyed the match. I concluded that the procedure was fairly arbitrary producing only a very rough approximation to observed data, and with no logical way of improving it.
On the other hand, the April 29th.,2009 paper, (Ref. (1) here), approached the use of the Hung Index in quite a different manner. It is very specific in identifying and describing the close timing between the node points defined by 10.381 and 12.004 year intervals and the observed times of Rmin in particular, and to a slightly lesser extent Rmax. It was concluded from the demonstrated synchronization that the timing of solar activity is closely related to periodic variation in the planetary tidal forces from Venus, Earth and Jupiter.
Beautiful looking orrery. A very appropriate decoration to the topic.
What is the background: where is, when made, who by and for what special reason?
Roy, I don’t know, I just grabbed the image in a hurry and didn’t click through to the page from the google image search. I’ll see if I can find it again.
Roy,
Thank you for referencing my work at your site. I will put a reference to your work at my site in the coming week.
I have looked at your March 23rd paper, and it refers to a April 29th paper as private correspondence. There must be an interesting story as to how you had a private correspondence with yourself one month into the future on March 23rd 2009.
That said, I see that you established the remarkable close correspondence between Rmin
and the cross-over points of the VEJ tidal cycles in 2009 and so I will reference your paper whenever I refer to this topic as the original discover of this aspect of the VEJ tidal model.
It would appear that according to a gentleman at the BBC that you have been at least aware of my January 2008 paper on the JEV Tidal model as early as Apr 15th 2011 (almost exactly 3 years ago). Here is the comment he posted in his BBC profile that indicated that you had a copy of my paper posted at your site:
“27. At 00:12 15th Apr 2011, paulcottingham wrote:
The scientific papers used by members of the Space Special interest group of Mensa for these conclusions include.
Length of the Solar Cycle: http://friendsofscience.org/assets/files/documents/Solar%20Cycle%20-%20Friis-Chr_Lassen-.pdf
Astronomical origins of the climate oscillations: http://arxiv.org/PS_cache/arxiv/pdf/1003/1003.1554v1.pdf
The effect of planetary tides on the Length of the Solar cycle:
Click to access NASA_TM-2007-214817.pdf
Click to access Reconstruction_of_Hung_Fig4_01.pdf
Click to access SolarTidalInfluencesofVEJ_W01.pdf
http://www.climatestop.com/Ian_Wilson_Syzygy.pdf”
Ian Wilson
Dear Roy,
And here is a post of yours to Tallbloke’s Workshop on August 18th 2010 that shows that you were aware of my work in 2010:
Roy Martin says:
August 18, 2010 at 9:08 am
Gray, thanks for what appears to be a well considered and supportive response.
I did start to look at which alignments were associated with the significant events, but it is a fairly tedious task to examine so many points in time, even with the aid of a computer. Part of the answer may be found in a paper by Ian Wilson, who also worked on from the Hung paper. He has presented data which provides some insights into the alignments associated with solar maxima and minima. If you do not already have it, there is a pdf on my website at http://www.climatestop.com . Of particular relevance are his Fig.2a and 2b. Fig.2a shows that the alignment of Jupiter relative to Earth and Venus is at opposite phases in odd and even solar cycles. Fig.2b appears to be consistent with my observations that the minima are distributed roughly equally +/- from the mid low points of the 55 year waves.
The calculated data already extends to 2050. However, the 2000 to 2025 plot has already entered the period which many speculate will become much cooler, almost to the likely date of SC25 Rmax, without looking in any way unusual. I will plot 2000-2025 for interest.
The index as Hung defined it, and which I have used here, cuts a few corners. One obvious improvement is to include the influences of JEV at their correct relative values in the ratio of about 2:1:2, instead of 1:1:1. I have already done that over a part of the period. It does not alter any of the basic observations as regards timing, but at first sight it does improve the apparent relevance of the smaller intermediate waves at Rmax. The other is of course to look at the effect of Mercury, which is observed to be implicated in the formation of flares.
More on you other points and questions later.
Roy and Tallbloke,
Here is a on-line reference to my paper in December 2nd 2008 by Geoff Sharp at his Landscheidt Cycles Research blog site:
DEC
2
2008
Ian Wilson’s Theory on the Planetary Influence on Grand Minima.
Ian Wilson, highly respected Australian scientist working in the area of planetary influence on solar activity has provided us with his paper outlining his theory on some possible drivers of solar grand minima. This area of science seems to be on the fringe where no matter what funds are available no real knowledge can claim with total confidence how the next cycle will pan out, let alone when the next Maunder type minimum might happen, its an open arena waiting for a credible explanation.
Landscheidt Cycles welcomes Ian’s paper which can be accessed through this link:http://plasmaresources.com/ozwx/wilson/Syzygy.pdf
Below is a graph from Ian’s paper showing the heliocentric latitude of Venus (solid line) and the mean distance of Jupiter from the Sun in astronomical units (dashed line), we welcome constructive debate.
&&&&&&&&&&&&&&&&&&&&&&&&&&&&&&&
Here is a comment by Geoff at the time:
gsharp
DECEMBER 4, 2008 @ 2:12 PM
Thanks Elling, it seems a lot of scientists right off “tide theory” because of the minute tide that is calculated, but as you and Ian and Hung suggest it may not need a lot of gravity or change in spin momentum to cause much bigger events, I also wonder how something magnetic like plasma is affected by gravity or other planets magnetic fields. If you have any links on the iron core and Soho data please feel free to post.
&&&&&&&&&&&&&&&&&&&&&&&&&&&&&&&
and here is my response to Geoff’s article about my paper that I submitted to New Astronomy in January 2008. It shows that I was toying with the VEJ Tidal torquing before December 2008:
Ian Wilson
DECEMBER 5, 2008 @ 11:36 PM
I don’t know about “highly respected Australian scientist..”. About the only one who shows me any respect around here is my dog.
The plot that is shown in this post, highlights the fact that the major “maunder minimum” cooling events seem to take place at Jupiter-Venus-Earth alignments that have Jupiter furthest from the Sun and Venus is at its largest positive inclination with respect to the ecliptic. In other words, when the alignments of Earth-Venus-Sun are weakest and net gravitational force of Jupiter is weakest.
If you take a purely gravitational/tidal approach, the dominant tidal
influences on the Sun are those of Venus and Jupiter, with Earth in third place. However the dominant gravitational influence on the Sun, by far, is that of Jupiter.
[I acknowledge that a simple gravitational/tidal picture is too simplistic]
I believe that if you are going to use a tidal/gravitational model to try and explain the influence of the planets on the level of solar activity It would be one that involves Venus-Earth alignments for tidal “pull” at the surface at the Sun, coupled with Jupiter’s gravity tugging at 90 degrees to these tidal alignments.
This would the only way that you could get a reasonable tidal torque acting on the Sun to produce a spin-orbit coupling.
UNFORTUNATELY, and it is a big unfortunately, the net change in spin that can be produced by this mechanism is orders of magnitude short of what is needed to have any significant effect.
At this stage, we have to admit that we do not have a viable physical mechanism for explaining the spin orbit coupling.
But this should not stop us for trying to look for a viable mechanism as the synchronicity between the planetary motions and the solar cycle are so good that there must be a connection there somewhere.
&&&&&&&&&&&&&&&&&&&&&&&&
Roy and Rog,
Here is a email letter that I set Richard Black at the BBC in England back when I still naively believed that he was open to scientific discussion.
The MS Word .doc file is dated the 8th of April 2008.
The letter shows that I had made the transition from a model that proposed that SIM was directly responsible for changes in the level of solar activity [i.e. as per our 2008 PASP paper that was originally written in 2005 – 2006] to my November 2007 VEJ tidal model paper [that was revised to take into account Hung’s July 2007 paper and then submitted to New Astronomy in January – February 2008] that proposed that VE & J were responsible for changes in the level of solar activity:
&&&&&&&&&&&&&&&&&&&&&&&&&&&&
Richard Black,
I am currently in a race to get my latest work published in New Astronomy. This work proposes a “mouse-trap” model to explain the long-term variations that we see in the solar sunspot cycle. I believe that a small force (i.e. planetary tides caused by periodic alignments of Jupiter, Venus and Earth) is leading to the release large amounts of energy on the solar surface (i.e. solar flares and CME events) and it is these abrupt releases of energy that play an important part in driving the sunspot cycle.
An American researcher at the NASA Glenn Research centre in Cleveland Ohio has independently come up with the same result. He has only been able to publish two NASA reports, none of which he has been able to get past peer review. He has tried Nature and Science, to no avail. The work we are trying to get out is just too far outside the box.
I have one manuscript on the Solar cycle and the motion of the Sun about the centre of mass of the Solar System (often referred to as Solar Inertial Motion or SIM) that has been accepted for publication in PASA – Publication of the Astronomical Society of Australia. While this paper has past peer review, it main results have been superseded.
Over the years, many researchers have shown that changes in the SIM closely match those of variations seen in the level of solar sunspot activity. The correlation between these two phenomenon is so good that suggests that there is an underlying physical mechanism that links the two. The problem is that no one has been able to come up with a viable mechanism. I now believe that the reason for this is that there isn’t one.
The correlation between the motion of the Sun about the centre of mass of the solar system and the level of solar activity is a false correlation. The only reason the two phenomenon appear to be correlated is the fact that they share a common underlying causal mechanism.
Periodicities in the orbital motion of the Jovian planets are reflected in the motion of the Sun about the centre of mass of the Solar system.
The dominant periodicities of these orbital motions are all submultiples of the Jose cycle of 178 years i.e. 11.15 years (Schwabe cycle), 22.3 years (Hale Cycle), 44.5 years (1/2 Gleissberg cycle), 89 years (Gleissberg cycle) and 178 years (Jose cycle).
The point that many people have been missing is that their appear to be natural periodicities in the orbital motion of the inner planets that match those seen in the Jovian planets. The alignments of Jupiter at the times of superior and inferior conjunctions of Venus and Earth have natural periodicities at sub-multiples of 44.77 years, i.e. 22.38 (Hale cycle) and 11.19 years (Schwabe cycle).
I have another large manuscript that shows that on Lunar tides and the…..
Ninderthana (aka Ian Wilson) said:
April 16, 2013 at 1:25 pm
“I have looked at your March 23rd paper, and it refers to a April 29th paper as private correspondence. There must be an interesting story as to how you had a private correspondence with yourself one month into the future on March 23rd 2009.”
Maybe, I don’t know, but here is a bit of the tale:
I first became aware of the Hung (2007) report from Geoff Sharp’s blog on Nov 6th, 2008, but for some time prior to that I had been playing around with calculations of the tidal forces. It was immediately obvious that Hung had already produced results similar to what I had been trying to do, so I began working on the reconstruction of his Fig.4. sunspot cycle graph, and concurrently, an analysis of the long term tidal graphs for V-E-J. On Feb.26, 2009 I wrote to Ching-Cheh Hung:-
” Having read much of the IPCC TAR and AR4, and become aware of significant contradictory opinion, I have since undertaken to study far and wide to see if I could come to my own better understanding of the past and present processes involved in the generation of the Earth’s climate. As well as reading as many original references as possible I have obtained copies of some of the excellent databases available from NASA, NOAA and elsewhere to do some charting and basic statistical studies of my own. I am still not altogether convinced that the IPCC have a really solid foundation for the currently held position that our generation of CO2 plays such a dominant role in the climate system. I am, however, of the view that the IPCC has seriously discounted the direct and indirect role that the Sun has, both in the historic past and at present, played in control of the climate on Earth. There is a huge effort underway to improve our knowledge and understanding of the Sun and how it affects us on earth. There is obviously much yet to be learned.
I only became aware of the subject report mid last year. I have subsequently studied it and, based on the concept of the Planet Alignment Index presented, done further detailed analyses of the data. The significant correlation between Sunspots and the Alignment Index presented in the Fig.4 has been reproduced, although for convenience in the subsequent analysis I employed a slightly different methodology. From that point of departure I have discovered much more to support and consolidate the argument for the influence of the planetary induced tides on the timing of the sunspot cycles and the temporal variation in the number of sunspots. As a non-professional in any related field of study I have been somewhat reticent about the likely significance and acceptance of this work, however I have spent enough time combing through it and known related published material to believe that it is indeed a potentially useful contribution, and should be exposed to some level of critical scrutiny.
I am therefore asking you as the author of the paper on which my work is based if you would be good enough to scan some of the material for an opinion if I forward it to you? This project is still very much work in progress, but there is enough sufficiently complete to put together an outline to illustrate the methodology used in the analysis, together with some quite detailed illustrations of what are almost certainly cause and effect relationships.
I would also be interested to know what response there was to the Draft Report, and if it eventually went to publication.
Thank you and regards,
Roy Martin”
To which I received no reply, but it documents where I was at at the time.
I my log on Jan.21, 2009, I first listed the sequence of intervals that define the Quintet cycle, with an initial estimate of 55.25 years, comprising (10.40 x 3) + (12.025 x 2)
At the end notes for March 5, 2009, I made the comment:
”What is abundantly clear is that the sunspot cycle length is linked to the now defined 11.05 yr. ave. pattern of waves peaks and cusps, but actual SSN minima & maxima occur at intervals before or after the turning points, often at the 1.625 intervals, or a multiple thereof. Added to that are fractions of the 1.625 cycle that, for reasons not yet clear, become dominant.” (Numbers refined to 11.0307 yr. and 1.622 yr. prior to publication.)
By the time I finished the March 23rd paper, the main body of the April 29th paper had already been drafted, and my log shows that on March 18th I wrote to Timo Niroma with a brief synopsis of what I had concluded to date. Hence the reference to: “In private correspondence.” Work between then and completion on April 29 was mainly editorial, filling out some sections of the text, and the addition of the Appendices. Tedious business formatting charts full of detail.
Ian,
This is to correct the reference to the date when I first saw your periodic peaks paper. I noted in my journal that I downloaded it on or about June 17th, 2009; not sure where from. The note and link referring to it was added to my website on July 16th.
@ Roy Martin
Are you able to give any more details of the 1.622 / 1.625 period within the solar cycle mentioned above e.g. could you confirm that it relates to this:
‘The magnitude of the tidal force vector was plotted on a time scale from 1500 to 2050, in segments of fifty years. Smooth curves drawn through the high points spaced at 3.24422 year intervals appear as five sinusoidal curves, which are arbitrarily numbered 1-5 starting from the first peak after 1900.’
(3.24422 / 2 = 1.62211)
Many thanks.
111a:
As I suspected, its super-simple once given a few minutes of due focus. It’s simply the beat of the lowest nearly-common subharmonics of (V-E)/2 & (V-J)/2.
Paul,
Yes, simple: J-V synodic 0.648847 x (5/2) = 1.62212
Roy said:
“This is to correct the reference to the date when I first saw your periodic peaks paper. I noted in my journal that I downloaded it on or about June 17th, 2009; not sure where from. The note and link referring to it was added to my website on July 16th.”
It looks as though we were both stumbling around in the dark back then. It’s good that you stuck with the problem and got the word out.
Interestingly, in my letter to Richard Black, I mention that Hung had tried to publish his paper in Nature and Science – I can’t remember how I got that information since, like you, I don’t remember Hung ever replying to any of my communications.
(1.622018794)*(1.598563486)
/ (1.622018794 – 1.598563486)
= 110.5464062 years
Simple indeed Roy.
All the best.
[…] Paul Vaughan on Roy Martin: The Solar Cycle… […]
Paul,
@18th., 3:59 am
110.546 years is deceptively close, but it is not 110.304.
Will explain tomorrow.
Roy, your calculations are based on different orbital elements. That is the source of the discrepancy between your numbers and the ones I’ve shared, which are based on J2000. Most of the readers here will realize that these numbers are just averages (of osculating (not to be confused with oscillating) elements) over some fairly arbitrary intervals. Regards.
Paul Vaughan said:
April 18, 2013 at 3:59 am
“(1.622018794)*(1.598563486)
/ (1.622018794 – 1.598563486)
= 110.5464062 years”
As described in the head paper, the study runs from ~1500 to 2050. Only the plots from 1850 to 2050 are shown, but similar plots were made back to the beginning. Care was taken with the data used to generate the database to ensure best possible dating accuracy throughout, bearing in mind that it is derived from average orbital period data. The periods stated in items 1 to 8 in the results were derived from a close manual scan covering the full length of the plot; pages joined making a nice long scroll.
Over the full study period there are 50 nodal periods, 30 q1 periods of 10.3812 yrs, and 20 q2 periods of 12.0032 yrs. The nodal periods are both multiples of the JVsyn period of 0.64884655, as developed in Item 7. Then we can get the following:
(0.64884655 x 16 x 30) + (0.64884655 x (37/2) x 20) = 551.5195675 years
551.5195675/50 = 11.03039, say 11.0304 years, as the average length of the SC marker period.
Regarding slightly different input data for the JVsyn, I used data from the JPL Planet Physical Parameters table, accessed in Sept 28, 2012. If I substitute the data from J2000, that gives us a JVsyn of 0.64880752, but it only changes the above calculation to yield 11.0297, say 11.030 years for the SC.
The calculation posted by Paul V. yields a SC length of 11.055 years. Although close, in my opinion it does not quite correctly reflect the sequence of what has actually happened during the study period. The methodology in the head paper embraces the effects of a synodic events.
…a synodic events should be: …all synodic events.
More specifically, the calculations I’ve shown are for:
J2000 3000BC-3000AD
http://ssd.jpl.nasa.gov/txt/p_elem_t2.txt
Since orbital elements osculate, other intervals will show different average periods.
For example:
J2000 1800AD-2050AD
http://ssd.jpl.nasa.gov/txt/p_elem_t1.txt
6V-10E+4J = 1 / 11.09132402 years
None of these windowed averages are accurate over all contained shorter time-intervals. NASA JPL Horizons can output osculating elements as a function of time, so calculation of osculating JEV period is feasible.
Regards
Paul,
Re post @
April 20, 2013 at 3:21 pm
The database on which this study is based was created in the full understanding of variations due to osculating elements. The use of J2000 as a source of data was considered , but the implication was a rather larger and more involved table for only a marginal improvement in interim values. Possible errors appeared to be below the threshold of significance, so I opted for the much simpler approach of an incrementally built up data base, ensuring that there were no significant cumulative temporal errors. As far as I can tell, that decision is still justifiable within the context of the study.
I have checked the differences that might arise from using orbital periods derived from both the 1800 to 2050 and -3000 to 3000 periods data, compared with that from the JPL Planet Physical Parameters table. All calculations again to eight decimal places. They both yielded an estimated length of the SC of 11.0304 years. Therefore, the SC length of 11.0304 years established in this study still stands. The result shows that the difference between 11.0304 and the SC length you estimate from the 6V-10E+4J expression is definitely not caused by the use of a different data source.
I also checked inserting the different orbital data in the 6V-10E+4J expression, which gave:-
11.0697 years – From J2000, – 3000 to 3000
11.0675 years – From J2000, – 1800 to 2050
11.0696 years – From JPL planets physical parameters table
Again there are only extremely small differences in the results from the three sets of orbital data. Using data from shorter slices of the J2000 data may show variations due to osculating values, but significant variations appear unlikely. On the other hand, the number calculated by this method for what is supposed to be the length of the SC is obviously not 11.0304 years, indicating that there is a fundamental difference in method when compared with the head study.
At the moment I cannot see any reason for doubting the methodology I used in preparing the paper.
Re this comment: ‘110.546 years is deceptively close, but it is not 110.304’
Take the Jose cycle: Jupiter-Saturn synodic period 19.86 years x 9 = 178.74 years
178.74 / Phi (1.618034) = 110.4674
110.546 x Phi = 178.867
110.304 x Phi = 178.476
Coincidence or not?
oldbrew said:
April 24, 2013 at 8:28 am
“110.546 x Phi = 178.867
110.304 x Phi = 178.476
Coincidence or not?”
I had already raised this possible connection as a footnote at the end of a previous post: “How do the planets affect the Sun ?”, and no, I don’t believe it is a coincidence.
Phi relationships are ubiquitous in both the gravitational-SIM studies and the JEV tidal studies. Jupiter plays a major role in SIM, and the J-V synodic of 0.64885 years is the basic ‘tick’ period in the tidal solar clock hypothesis. At least part of the answer seems to be in the harmonics:-
0.64885 x 5 = 3.24423; => 3.24423 x 34 = 110.304 years. 5 & 34 both Fibonacci numbers.
0.64885 x 5/2 =1.62212, which is within 0.25% of Phi.
0.64885 x 16 = 10.38115 years, which is one of the nodal periods that repeats as illustrated in Figs.1a. to 1d. in the head paper, and is a component factor in the 110.304 year period cycles.
What are the values for maximum alignment for VEJ between 1900-2013…even if “alignment” is non-existent…per year? This then is correlated to solar storm (sunspot) number…1900…1902…2013 as a function of VEJ combined tidal forces. Do you have a data base with past alignment values?
Hi Clifford.
I used Roy Martin’s model based on the JEV alignment index to produce this:
More info here:
[…] probably notice that this period is close to five solar cycles, Roy Martin’s planetary motion 55.15 year cycle and the lunar ‘triple saros’ cycle […]
Never found the orrery again, but did find this nice vid on building your own solar system.