


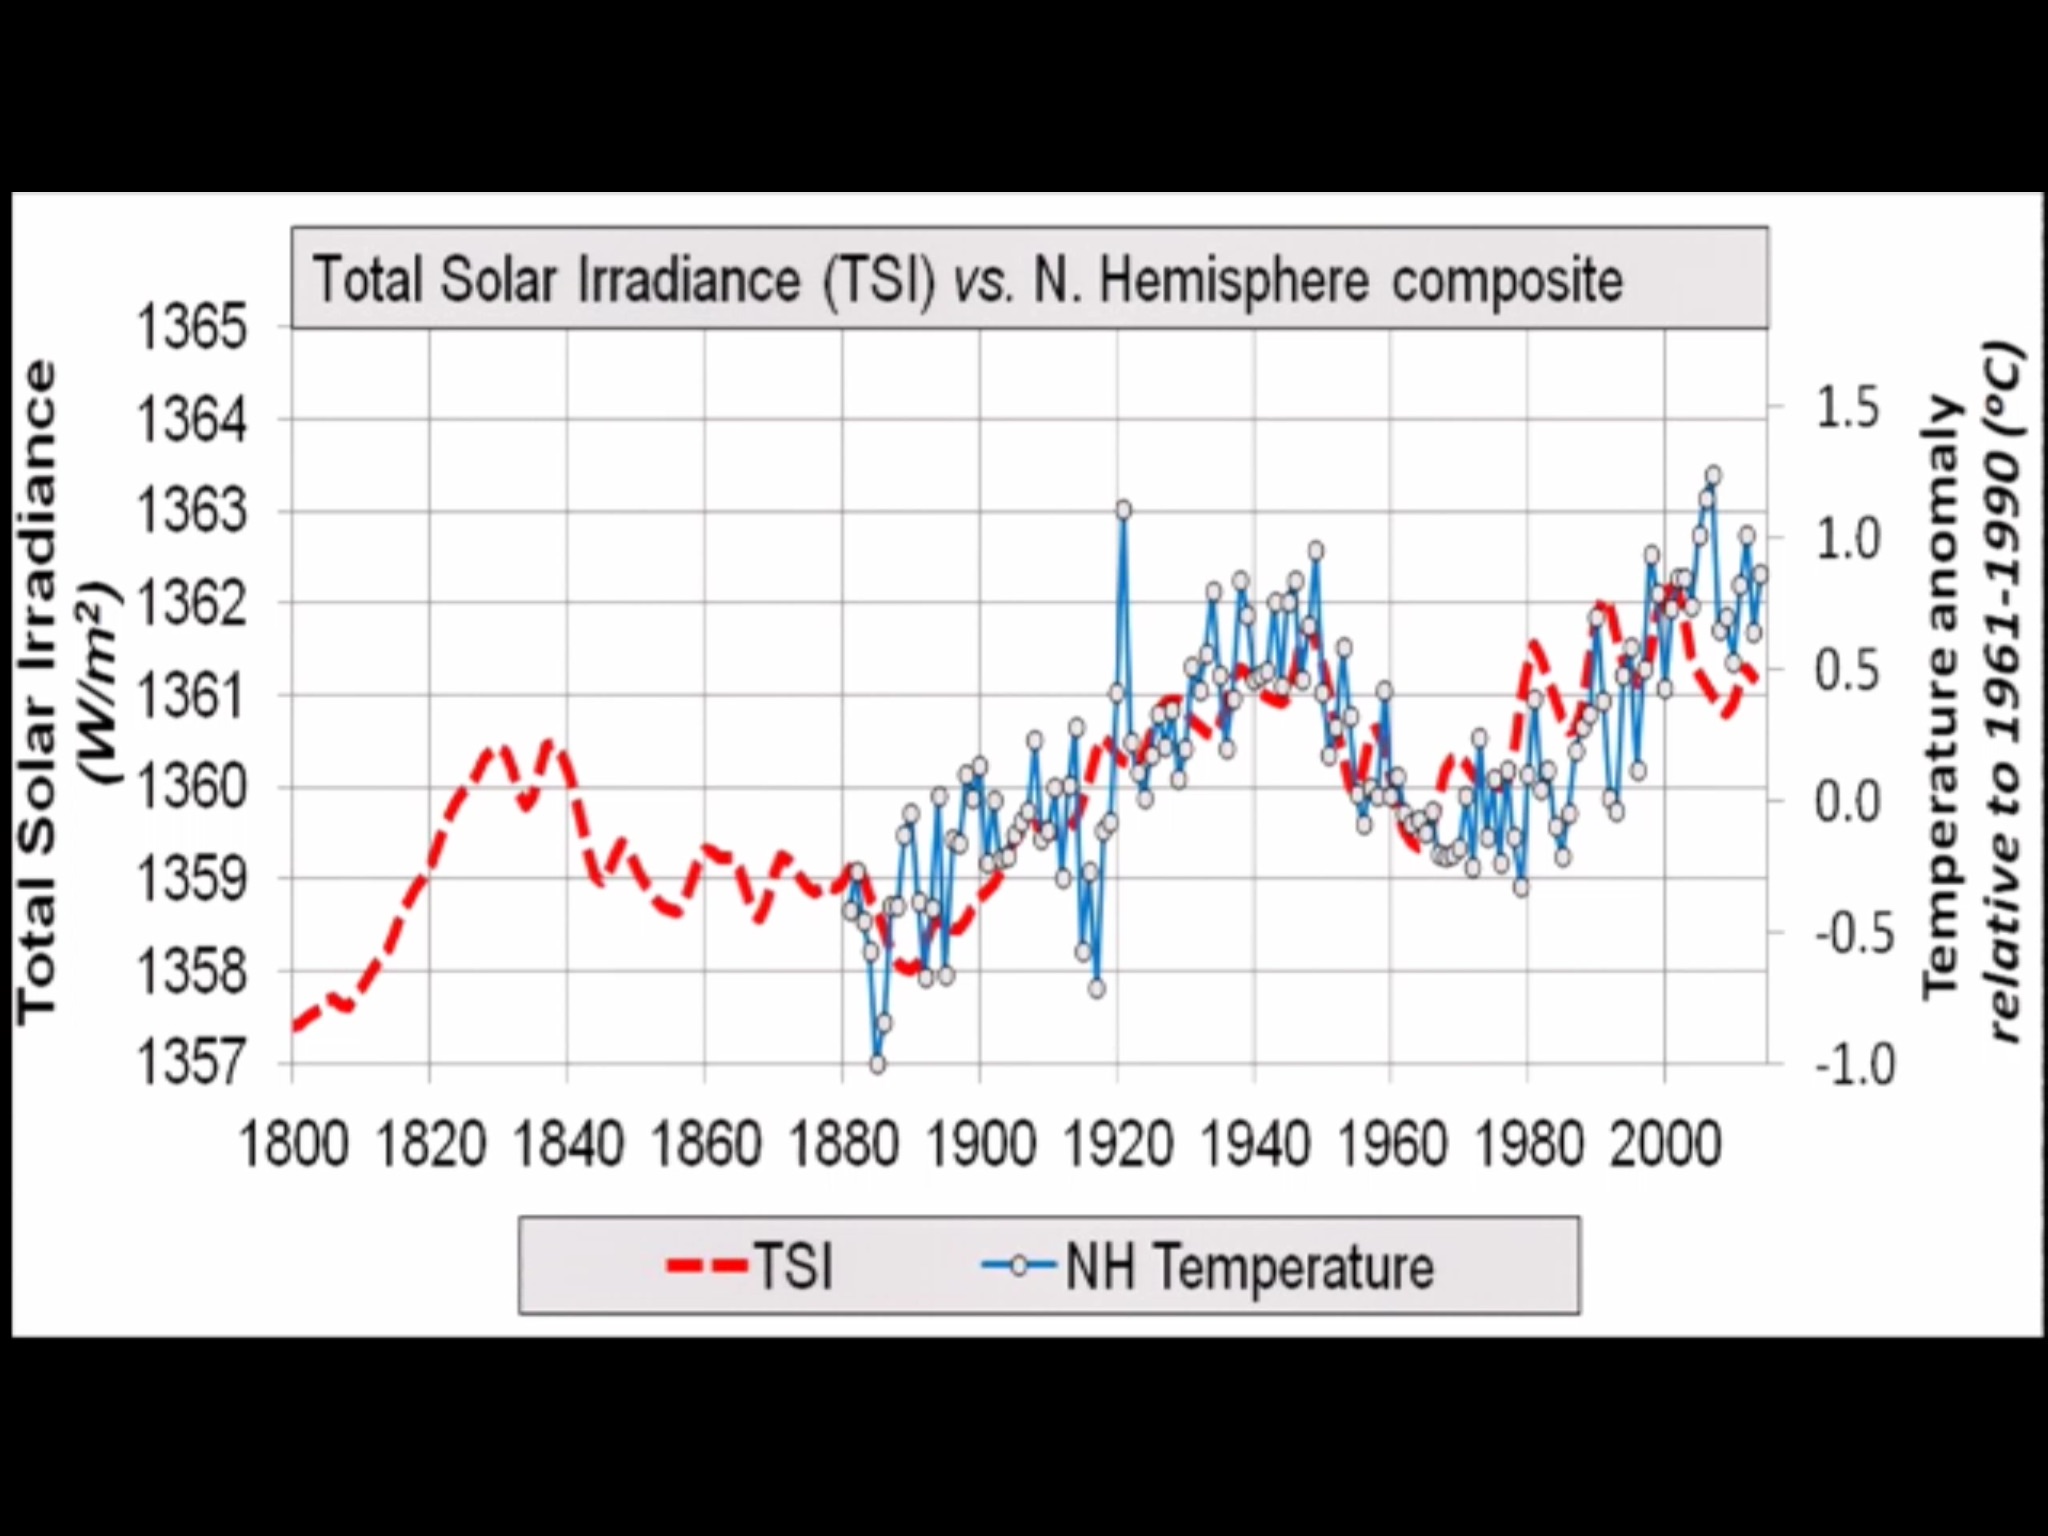
 Willie Soon, Ronan Connolly & Michael Connolly have reviewed the ongoing solar variability debate, constructed and assessed a new Northern Hemisphere rural temperature trend and find a close match with the Scafetta & Wilson update to the Hoyte & Schatten TSI reconstruction.
ABSRACT
Debate over what influence (if any) solar variability has had on surface air temperature trends since the 19th century has been controversial. In this paper, we consider two factors which may have contributed to this controversy:
1.
Several different solar variability datasets exist. While each of these datasets is constructed on plausible grounds, they often imply contradictory estimates for the trends in solar activity since the 19th century.
2.
Although attempts have been made to account for non-climatic biases in previous estimates of surface air temperature trends, recent research by two of the authors has shown that current estimates are likely still affected by non-climatic biases, particularly urbanization bias.
With these points in mind, we first review the debate over solar variability. We summarize the points of general agreement between most groups and the aspects which still remain controversial. We discuss possible future research which may help resolve the controversy of these aspects. Then, in order to account for the problem of urbanization bias, we compile a new estimate of Northern Hemisphere surface air temperature trends since 1881, using records from predominantly rural stations in the monthly Global Historical Climatology Network dataset. Like previous weather station-based estimates, our new estimate suggests that surface air temperatures warmed during the 1880s-1940s and 1980s-2000s. However, this new estimate suggests these two warming periods were separated by a pronounced cooling period during the 1950s-1970s and that the relative warmth of the mid-20th century warm period was comparable to the recent warm period.
We then compare our weather station-based temperature trend estimate to several other independent estimates. This new record is found to be consistent with estimates of Northern Hemisphere Sea Surface Temperature (SST) trends, as well as temperature proxy-based estimates derived from glacier length records and from tree ring widths. However, the multi-model means of the recent Coupled Model Intercomparison Project Phase 5 (CMIP5) climate model hindcasts were unable to adequately reproduce the new estimate – although the modelling of certain volcanic eruptions did seem to be reasonably well reproduced.
Finally, we compare our new composite to one of the solar variability datasets not considered by the CMIP5 climate models, i.e., Scafetta and Willson, 2014’s update to the Hoyt and Schatten, 1993 dataset. A strong correlation is found between these two datasets, implying that solar variability has been the dominant influence on Northern Hemisphere temperature trends since at least 1881. We discuss the significance of this apparent correlation, and its implications for previous studies which have instead suggested that increasing atmospheric carbon dioxide has been the dominant influence.
The paper (pre-print)

That’s a very interesting paper.
I can probably add detail about Valentia but not now.
The nice thing is people who not only realise but do actual legwork, the only way to unravel history. Robots never will hack it, province of the armchair brigade.
Reblogged this on WeatherAction News.
Okay up and down packet people, what’s this ““through-mass” mechanical energy transmission is actually a very rapid mechanism for transmitting energy throughout the atmosphere”, page 43
It is great to know that people like Willy Soon and Nicola Scafetta are still out there.
I never heard of those Connolly’s but I wish them a smooth road and a following wind (fat chance of that when Climate Alarmists rool).
1. primitive method for measuring solar cycle length …and no mention of it’s derivatives — clarifies inadequate competence to play judge.
2. totally ignores what’s geometrically proven about zonal wind redistribution by observations constrained by laws of large numbers & conservation of angular momentum = straight-up hard fail.
3. mistaken false assumptions about sun-climate relations remarkably similar to those promoted by Wyatt & Curry (arouses suspicions…)
overall:
• intolerably poorly informed
• decisively untrustworthy
Frankly I believe this is accidental or deliberate sabotage that (either way) has the effect of strongly supporting the lukewarmist messaging campaign.
I suspect the strategy is misrepresentation of sun-climate relations to build a straw man that will make an easy target for the militant lukewarmist though-police since real sun-climate relations are unassailable.
gallopingcamel says: September 5, 2015 at 3:54 am
“It is great to know that people like Willy Soon and Nicola Scafetta are still out there. I never heard of those Connolly’s but I wish them a smooth road and a following wind (fat chance of that when Climate Alarmists rool).”
Peter,
They have been around a while. Mostly reproducing the Ferenc Miskolczi work. I still think the Miskolczi
Virial theorem to the stratosphere better.
http://globalwarmingsolved.com
tchannon says: September 5, 2015 at 2:08 am
“Okay up and down packet people, what’s this ““through-mass” mechanical energy transmission is actually a very rapid mechanism for transmitting energy throughout the atmosphere”, page 43”
Tim,
Please, I am not one of THEM, 🙂 , but I have been through the Connolly’s three other papers. There seems to be a coupling between thermo and strato-spheres that is to rapid for any known heat transfer mechanism save for EMR, and that doesn’t resolve the amount, either, Guesses are sound transfer, or that gravity really, really, insists on the lapse rate that it wants! The appearance of strato-multi-mers as the Connollys call them, may be part of this, an aggregation of molecules that really screws up gas laws. I still think that the Miskolczi, “they are in orbit dummy”, is more correct.
All the best! -will-
Looks like a timely, useful, meticulous and very thorough re-visitation of the solar vs. temperature controversy. Expect the mainstream climate science community to completely ignore it or denigrate it if pushed!
[…] Source: Re-valuating the role of solar variability on the Norhern Hemisphere temperature trends since the 19… […]
Ronan Connolly has done some detailed work on how the main surface datasets fail to adequately for UHI.
Sorry about the gobbledegook at 9.40am; the re-blog button seems to have disappeared!
Jaime, the reblog button has disappeared from other wordpress sites too. I’ll investigate. Maybe you have to opt-in now.
Edit to add: Hmmm, well the ‘show reblog button on posts’ is selected, so dunno, wordpress glitch of some sort.
Paul V: “intolerably poorly informed”
That’s harsh. 😦
“I believe this is accidental or deliberate sabotage”
And that’s verging on paranoid. Relax. Willie Soon and the Connolly’s are definitely not out to sabotage good science. Willie Soon has been doing similar work for years. E.g. :-
Cheers Rog, WordPress does tend to be rather ‘buggy’ in my experience.
TB, my apologies for being a little harsh.
Let me try to put it another way…
Judges have to be fair to administer justice.
The the part of the picture confronting Willie Soon & Marcia Wyatt:
If they make time to learn how to carefully measure and sensibly interpret nonstationary cyclic volatility in daily-resolution earth rotation records, they’ll lucidly recognize narratives demanding violation of the laws of large numbers and/or conservation of angular momentum.
This is about sensibly interpreting aggregate constraints on zonal wind redistribution.
I’ve geometrically proven (proof in the mathematical sense presented algebraically so this cannot be dismissed) that all terrestrial cycles — no matter their length and regularity or lack thereof — beat with the solar cycle to give that pattern …so the lack of acknowledgement from Marcia & Willie is of course arousing suspicion. There’s no sensible reason to ignore laws and algebraic proofs.
I’m here voluntarily to help the judges learn how to become more fair …if they’re willing and able …but I have to be honest: I am thoroughly (readers can imagine that underscored in bold capitals) unimpressed with the indefensible lengthy delays.
Nonetheless, restraint always remains feasible …but obviously it comes with a cold war feel….
Best Regards
Insolation is zero in the polar night regardless of solar cycle phase.
Equator-pole gradients drive circulation.
Even clumsy raking yields r^2 = 70%:
https://tallbloke.wordpress.com/2015/08/11/niv-shaviv-nice-one-the-sun-still-is/comment-page-1/#comment-106028 (cyclic volatility of zonal wind redistribution constrained by laws of large numbers & conservation of angular momentum)
The North Atlantic is special in that it can set up an amplifying (turbulent) feedback since the western boundary thermohaline stream reaches all the way to the ice margin where the lion’s share of downwelling occurs.
Neither solar cycle length nor it’s derivatives belong in a formula for reconstructing TSI.
Where they belong is in more sensible conceptualization of changing lengths of turbulent thermohaline pulse trains up the special Atlantic western boundary to the ice margin where the lion’s share of downwelling occurs.
This is a hard constraint that cannot sensibly be ignored.
The cost of enduring ignorance and procrastination is $trillions and growing. Best to do corrections before something important snaps. At this stage personnel changes appear more than necessary. I advise a stronger sense of expedience and stakes. Our “leaders” have miscalculated severely and if we don’t do corrections now it’s going to cost us more later.
Figure 2 in the new Svensmark paper is noteworthy:
Earth liveliness matches Milky Way spatiotemporal pattern:
Click to access epn2015462p26.pdf
Paul V, the caption at the side of Fig 2 says in part:
“The colored band indicates climatic periods: warm periods (red),
cold periods (blue), glacial periods (white and blue hatched bars)
and finally peak glaciations (black and white hatched bars)”
But all I can see is grey dots and a red line.
???
Paul Vaughan says: September 5, 2015 at 9:03 pm
“TB, my apologies for being a little harsh Let me try to put it another way…
Judges have to be fair to administer justice.”
You have found gross and apparently intentional errors.
What and who is being judged? Who ordered the intentional errors?
“I’m here voluntarily to help the judges learn how to become more fair …if they’re willing and able …but I have to be honest: I am thoroughly (readers can imagine that underscored in bold capitals) unimpressed with the indefensible lengthy delays.”
What about your and my indefensible lengthy delays in not recognising the BS and culpability sooner?
I find this paper to be a fair presentation of what can be presented in the current political situation.
“Nonetheless, restraint always remains feasible …but obviously it comes with a cold war feel….”
I know the feeling! 😦
TB there appears to be some mash-up of figures 17 & 22 from the 2012 paper:
Evidence of nearby supernovae affecting life on Earth
http://mnras.oxfordjournals.org/content/423/2/1234.short
Ah! Thanks!
Will, simplifying it comes down to this:
It’s not TSI.
Is it a composite measure of solar activity?
Yes …but it’s not TSI.
— – —
TB, related to Svensmark:
Shaviv’s classic:
http://www.sciencebits.com/sights-field-trip-milky-way
Paul Vaughan says: September 6, 2015 at 8:32 am
“Will, simplifying it comes down to this: It’s not TSI.”
“Is it a composite measure of solar activity? Yes …but it’s not TSI.”
I know! But for that kind of blasphemy, you can get your own self drawn and quartered! We must have fear and hate each other for them to succeed! Obama is a true embarrassment for the blacks in the US. Speak softly, and carry a large stickl. I remain a curmudgeon with a cudgel 😦
They need to take solar activity in the context of all the solar parameters and in the context of the arctic iris effect, milankovitch cycles, initial state of the climate-ice dynamic, geo magnetic field strength,land /ocean arrangements, before they can come up with a proper assessment on what impact solar activity might have had upon the climate.
An example is the solar wind associated with the solar lull of 2008-2010 was said to be ringing as far as resulting earth impacts in comparison to the solar minimum of 1996.
Upshot is all solar minimum are not alike and solar parameters in their totality have to be evaluated when it comes not only to solar activity but the climatic impacts they may have.
SDP, correction #1 on the path to climate justice is elimination of the false uniformity assumption.
…for example as if the ferocious Southern Ocean winds caused by the steep equator-pole gradient over the open ocean ring around Antarctica are just going to stop (!) in obedient submission to lukewarmist financial planning fantasies:
http://notrickszone.com/2015/09/03/sea-level-analyst-not-possible-to-torture-coastal-tide-gauge-data-into-yielding-a-sea-level-rise-anywhere-near-3-3-mmyr/comment-page-1/#comment-1037308
Will, there has possibly/probably been some misunderstanding. What I meant was that the time series Wyatt & Soon call “TSI” is not something I would ever recognize as TSI. That “TSI” is a composite measure of things the sun is doing …but for example the notion that solar cycle length is a useful predictor of TSI (not to be confused with “TSI”) is crazy. TSI does not peak in the 1940s, but “TSI” does. So this is only about semantics. The simplest thing to do would be to give “TSI” a different name to distinguish it from TSI. Both may have value, but they’re not one and the same. When I get a minute I’ll find a TSI time series and check the correlation with SCL. It’s going to be something totally ridiculously low. It’s not even worth measuring …but I’ll do it out of curiosity about how low it actually is. A similar issue is coming up with SAM & “SAM”. Results in misunderstandings for sure.
Paul V, Scafetta and Willson did an update on the original Hoyt-Schatten TSI-SCL paper last year I think.
TB on the topic of your famous z-axis LOD graph you’ll notice I’ve done something unusual: I commented on the “atmospheric convection” thread. My guess is that you will have an answer!
Soon et al (Re-evaluating the role of solar variability on Northern Hemisphere temperature trends since the 19th century) rely upon the Scafetta & Wilson 2014 update to the 1993 Hoyt & Schatten TSI dataset. But Scafetta and Wilson 2014 does not correct the Hoyt & Schatten known errors. It merely uses ‘Mike’s Nature Trick’ to append the ACRIM data to the end of the H&S dataset.
Given that H&S 1993 has known errors, relying upon this as your dataset seems more than dodgy. Especially since the corrected data wouldn’t support their conclusions.