


My thanks to Clive Best for offering this analysis from Ken Gregory as a repost here at the talkshop. There’s already an active discussion of it on WUWT, but we’ll run it anyway, as its importance is high.
Water Vapor Decline Cools the Earth – NASA Satellite Data
Original article at http://www.friendsofscience.org/index.php?id=483
An analysis of NASA satellite data shows that water vapor, the most important greenhouse gas, has declined in the upper atmosphere causing a cooling effect that is 16 times greater than the warming effect from man-made greenhouse gas emissions during the period 1990 to 2001.
The world has spent over $ 1 trillion on climate change mitigation based on climate models that don’t work. They are notoriously poor at simulating the 20th century warming because they do not include natural causes of climate change – mainly due to the changing sun – and they grossly exaggerate the feedback effects of greenhouse gas emissions.
Most scientists agree that doubling the amount of carbon dioxide (CO2) in the atmosphere, which takes about 150 years, would theoretical warm the earth by one degree Celsius if there were no change in evaporation, the amount or distribution of water vapor and clouds. Climate models amplify the initial CO2 effect by a factor of three by assuming positive feedbacks from water vapor and clouds, for which there is little direct evidence. Most of the amplification by the climate models is due to an increase in upper atmosphere water vapor.
The Satellite Data
The NASA water vapor project (NVAP) uses multiple satellite sensors to create a standard climate dataset to measure long-term variability of global water vapor. NASA recently released the Heritage NVAP data which gives water vapor measurement from 1988 to 2001 on a 1 degree by 1 degree grid, in three vertical layers.1 The NVAP-M project, which is not yet available, extends the analysis to 2009 and gives five vertical layers. Water vapor content of an atmospheric layer is represented by the height in millimeters (mm) that would result from precipitating all the water vapor in a vertical column to liquid water. The near-surface layer is from the surface to where the atmospheric pressure is 700 millibar (mb), or about 3 km altitude. The middle layer is from 700 mb to 500 mb air pressure, or from 3 km to 6 km attitude. The upper layer is from 500 mb to 300 mb air pressure, or from 6 km to 10 km altitude.
The global annual average precipitable water vapor by atmospheric layer and by hemisphere from 1988 to 2001 is shown in Figure 1.
The graph is presented on a logarithmic scale so the vertical change of the curves approximately represents the forcing effect of the change. For a steady earth temperature, the amount of incoming solar energy absorbed by the climate system must be balanced by an equal amount of outgoing longwave radiation (OLR) at the top of the atmosphere. An increase of water vapor in the upper atmosphere would temporarily reduce the OLR, creating a forcing of more incoming than outgoing energy, which raises the temperature of the atmosphere until the balance is restored.

Figure 1. Precipitable water vapor by layer, global and by hemisphere.
The graph shows a significant percentage decline in upper and middle layer water vapor from 1995 to 2001. The near-surface layer shows a smaller percentage increase, but a larger absolute increase in water vapor than the other layers. The upper and middle layer water vapor decreases are greater in the Southern Hemisphere than in the Northern Hemisphere.
Table 1 below shows the precipitable water vapor for the three layers of the Heritage NVAP and the CO2 content for the years 1990 and 2001, and the change.
| Layer | L1 near-surface | L2 middle | L3 upper | Sum | CO2 |
| 1013-700 | 700-500 | 500-300 | |||
| mm | mm | mm | mm | ppmv | |
| 1990 | 18.99 | 4.6 | 1.49 | 25.08 | 354.16 |
| 2001 | 20.72 | 4.03 | 0.94 | 25.69 | 371.07 |
| change | 1.73 | -0.57 | -0.55 | 0.61 | 16.91 |
Table 1. Heritage NVAP 1990 and 2001 water vapour and CO2.
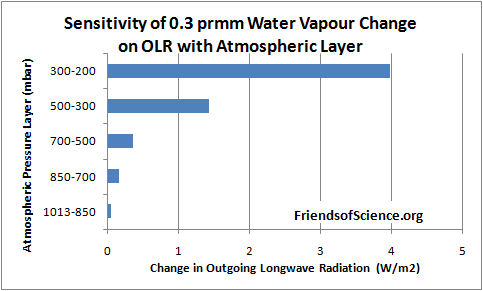
Dr. Ferenc Miskolczi performed computations using the HARTCODE line-by-line radiative code to determine the sensitivity of OLR to a 0.3 mm change in precipitable water vapor in each of 5 layers of the NVAP-M project. The program uses thousands of measured absorption lines and is capable of doing accurate radiative flux calculations. Figure 2 shows the effect on OLR of a change of 0.3 mm in each layer.
The results show that a water vapor change in the 500-300 mb layer has 29 times the effect on OLR than the same change in the 1013-850 mb near-surface layer. A water vapor change in the 300-200 mb layer has 81 times the effect on OLR than the same change in the 1013-850 mb near-surface layer.

Figure 2. Sensitivity of 0.3 mm precipitable water vapor change on outgoing longwave radiation by atmospheric layer.
Table 2 below shows the change in OLR per change in water vapor in each layer, and the change in OLR from 1990 to 2001 due to the change in precipitable water vapor (PWV).
| L1 | L2 | L3 | Sum | CO2 | ||
| OLR/PWV | W/m2/mm | -0.329 | -1.192 | -4.75 | ||
| OLR/CO2 | W/m2/ppmv | -0.0101 | ||||
| OLR change | W/m2 | -0.569 | 0.679 | 2.613 | 2.723 | -0.171 |
Table 2. Change of OLR by layer from water vapor and from CO2 from 1990 to 2001.
The calculations show that the cooling effect of the water vapor changes on OLR is 16 times greater than the warming effect of CO2 during this 11-year period. The cooling effect of the two upper layers is 5.8 times greater than the warming effect of the lowest layer.
These results highlight the fact that changes in the total water vapor column, from surface to the top of the atmosphere, is of little relevance to climate change because the sensitivity of OLR to water vapor changes in the upper atmosphere overwhelms changes in the lower atmosphere.
The precipitable water vapour by layer versus latitude by one degree bands for the year 1991 is shown in Figure 3. The North Pole is at the right side of the figure. The water vapor amount in the Arctic in the 500 to 300 mb layer goes to a minimum of 0.53 mm at 68.5 degrees North, then increases to 0.94 mm near the North Pole.

Figure 3. Precipitable water vapor by layer in 1991.
The NVAP-M project extends the analysis to 2009 and reprocesses the Heritage NVAP data. This layered data is not publicly available. The total precipitable water (TPW) data is shown in Figure 4, reproduced from the paper Vonder Haar et al (2012) here. There is no evidence of increasing water vapor to enhance the small warming effect from CO2.

Figure 4. Global month total precipitable water vapor NVAP-M.
The Radiosonde Data
Water vapor humidity data is measured by radiosonde (on weather balloons) and by satellites. The radiosonde humidity data is from the NOAA Earth System Research Laboratory here.

Figure 5. Global relative humidity, middle and upper atmosphere, from radiosonde data, NOAA Earth System Research Laboratory.
A graph of the global average annual relative humidity (RH) from 300 mb to 700 mb is shown in Figure 5. The specific humidity in g/kg of moist air at 400 mb (8 km) is shown in Figure 6. It shows that specific humidity has declined by 14% since 1948 using the best fit line.

Figure 6. Specific humidity at 400 mb pressure level
In contrast, climate models all show RH staying constant, implying that specific humidity is forecast to increase with warming. So climate models show positive feedback and rising specific humidity with warming in the upper troposphere, but the data shows falling specific humidity and negative feedback.
Many climate scientists dismiss the radiosonde data because of changing instrumentation and the declining humidity conflicts with the climate model simulations. However, the radiosonde instruments were calibrated and the data corrected for changes in response times. The data before 1960 should be regarded as unreliable due to poor global coverage and inferior instruments. The near surface radiosonde measurements from 1960 to date show no change in relative humidity which is consistent with theory. Both the satellite and radiosonde data shows declining upper atmosphere humidity, so there is no reason to dismiss the radiosonde data. The radiosonde data only measures humidity over land stations, so it is interesting to compare to the satellite measurements which have global coverage.
Comparison Between Radiosonde and Satellite Data
The specific humidity radiosonde data was converted to precipitable water vapor for comparison with the satellite data. Figure 7 compares the satellite data to the radiosonde data for the years 1988 to 2001.

Figure 7. Comparison between NOAA radiosonde and NVAP satellite derived precipitable water vapor.
The NOAA and NVAP data compares very well for the period 1988 to 1995. The NVAP satellite data shows less water vapor in the upper and middle layers than the NOAA data. In 2000 and 2001 the NVAP data shows more water vapor in the near-surface layer than the NOAA data. The vertical change on the logarithmic graph is roughly equal to the forcing effect of each layer, so the NVAP data shows water vapor has a greater cooling effect than the radiosonde data.
The Tropical Hot Spot
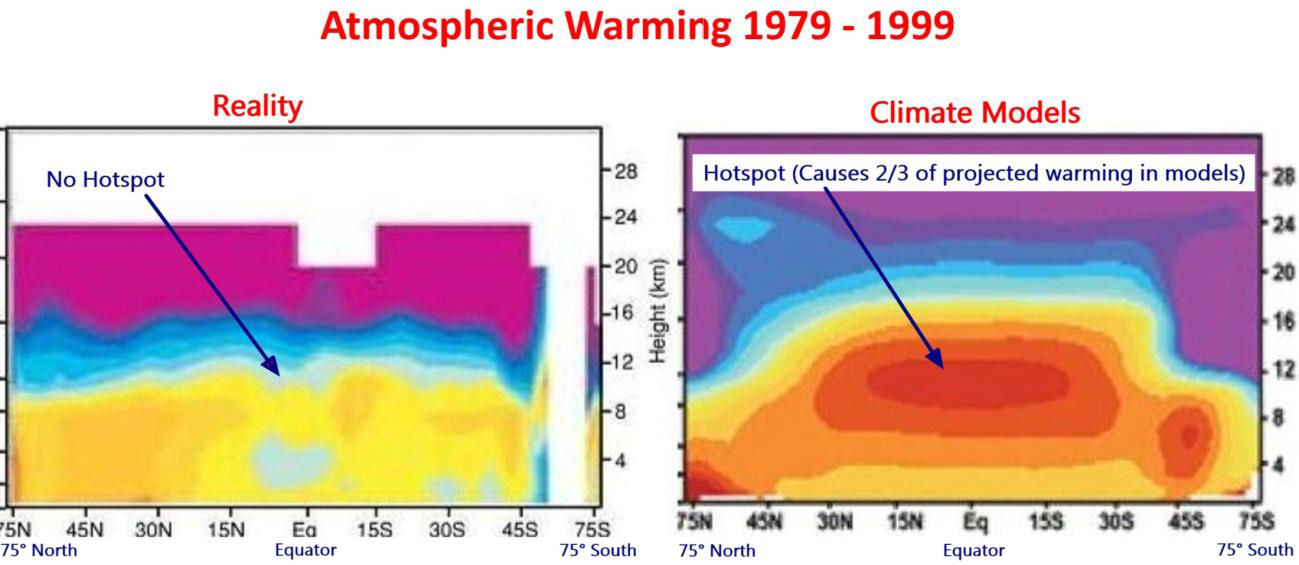
The models predict a distinctive pattern of warming – a “hot-spot” of enhanced warming in the upper atmosphere at 8 km to 13 km over the tropics, shown as the large red spot in Figure 8. The temperature at this “hot-spot” is projected to increase at a rate of two to three times faster than at the surface. However, the Hadley Centre’s real-world plot of radiosonde temperature observations from weather balloons shown below does not show the projected hot-spot at all. The predicted hot-spot is entirely absent from the observational record. If it was there it would have been easily detected.
The hot-spot is forecast in climate models due to the theory that the water vapor profile in the tropics is dominated by the moist adiabatic lapse rate, which requires that water vapor increases in the upper atmosphere with warming. The moist adiabatic lapse rate describes how the temperature of a parcel of water-saturated air changes as it move up in the atmosphere by convection such as within a thunder cloud. A graph here shows two lapse rate profiles with a larger temperature difference in the upper atmosphere than at the surface. The projected water vapor increase creates the hot-spot and is responsible for half to two-thirds of the surface warming in the IPCC climate models.

Figure 8. Climate models predict a hot spot of enhanced warming rate in the tropics, 8 km to 13 km altitude. Radiosonde data shows the hot spot does not exist. Red indicates the fastest warming rate. Source: http://joannenova.com.au
The projected upper atmosphere water vapor trends and temperature amplification at the hot-spot are intricately linked in the IPCC climate theory. The declining upper atmosphere humidity is consistent with the lack of a tropical hot spot, and both observations prove that the IPCC climate theory is wrong.
A recent technical paper Po-Chedley and Fu (2012) here compares the temperature trends of the lower and upper troposphere in the tropics from satellite data to the climate model projections from the period 1981 to 2008.2 The upper troposphere is the part of the atmosphere where the pressure ranges from 500 mb to 100 mb, or from about 6 km to 15 km. The paper reports that the warming trend during 1981 to 2008 in the upper troposphere simulated by climate models is 1.19 times the simulated warming trend of the lower atmosphere in the tropics. (Note this comparison is to the lower atmosphere, not the surface, and includes 10 years of no warming to 2008.) Using the most current version (5.5) of the satellite temperature data from the University of Alabama in Huntsville (UAH), the warming trend of the upper troposphere is only 0.973 of the lower troposphere in the tropics for the same period. This is different from that reported in the paper because the authors used an obsolete version (5.4) of the data. The satellite data shows not only a lack of a hot-spot, it shows a cold-spot just where a hot-spot was predicted.
Conclusion
Climate models predict upper atmosphere moistening which triples the greenhouse effect from man-made carbon dioxide emissions. The new satellite data from the NASA water vapor project shows declining upper atmosphere water vapor during the period 1988 to 2001. It is the best available data for water vapor because it has global coverage. Calculations by a line-by-line radiative code show that upper atmosphere water vapor changes at 500 mb to 300 mb have 29 times greater effect on OLR and temperatures than the same change near the surface. The cooling effect of the water vapor changes on OLR is 16 times greater than the warming effect of CO2 during the 1990 to 2001 period. Radiosonde data shows that upper atmosphere water vapor declines with warming. The IPCC dismisses the radiosonde data as the decline is inconsistent with theory. During the 1990 to 2001 period, upper atmosphere water vapor from satellite data declines more than that from radiosonde data, so there is no reason to dismiss the radiosonde data. Changes in water vapor are linked to temperature trends in the upper atmosphere. Both satellite data and radiosonde data confirm the absence of any tropical upper atmosphere temperature amplification, contrary to IPCC theory. Four independent data sets demonstrate that the IPCC theory is wrong. CO2 does not cause significant global warming.
Note 1. The NVAP data in Excel format is here.
Note 2. The lower troposphere data is: http://www.nsstc.uah.edu/public/msu/t2lt/uahncdc.lt
The upper troposphere data is calculated as 1.1 x middle troposphere – 0.1 x lower stratosphere; where middle troposphere is: http://www.nsstc.uah.edu/public/msu/t2/uahncdc.mt and the lower stratosphere is:http://www.nsstc.uah.edu/public/msu/t4/uahncdc.ls

I wonder why, in Fig1, NASA choose to display the ground level data at the top, and the top of the atmosphere data at the bottom. 😉
OK, it makes the log Y axis run with values increasing upwards, but it turns the atmosphere upside down visually.
The paper it refers to backs up Dr. Ferenc Miskolczi’s and Prof. Garth Paltridge’s work.
As far as I can tell, it pretty much ends the debate on catastrophic anthropogenic global warming.
We still need to see the data from 2001 to 2009 before it becomes a near dead certainty.
I believe that CAGW is a dead parrot!
Now that’s what I call a dead parrot.
This parrot is definitely deceased.
This parrot wouldn’t voooom if I put 4000 volts through it.
It’s bleeding demised.
It’s not pining it’s passed on.
This parrot is no more! It has ceased to be!!
It’s expired and gone to meet its maker.
This is a late parrot!
It’s a stiff! Bereft of life it rests in peace.
If it hadn’t been nailed to the perch it would be pushing up the daisies.
Its’ run down the curtain and joined the choir invisible.
This is an ex-parrot!!
(if you want to get anything done in this country you’ve
got to complain until you are blue in the mouth)
Well that’s interesting… because a reduction of 0.1 g of water vapour per kg of dry air would yield about 0.2⁰C in (dry air) temperature increase; at the same level of specific heat for the air. i.e. dry air is at a higher temperature for the same amount of heat. Our pleasant planet has a gaseous envelope; gases (including “greenhouse gases”) have “no” surface so they are very poor radiators of heat compared to liquid and solid surfaces; which is why we have a warm atmosphere. Well; substantially warmer than cold space outside of the atmosphere.
I discussed the minor topic of psychrometrics at Joanne Nova’s blog.
The initial “result” of drier air is that the surface remains “hotter”, radiating more heat directly to space.
One of the dirty tricks used with airconditioning systems is to only deal with dry air and to keep it as dry as possible (OH&S be damned). But if you want to cool stuff with air (like computers or expensive machinery), you ramp up the water vapour to between 60% and 80% RH, which provides a much greater specific heat capacity, a lower operating temperature in the same ambient temperature and a substantial “buffer” in case the cooling system fails. There are no significant savings in cooling because you still have to remove the plant heat at the cooling system.
The major bonus of high relative humidity with a lot of machinery is that is suppresses the development of static electricity. Thinking about that; it also appears to suppress dust and airborne particulate in nature… so there’s another unmodelled climate effect. 🙂
Thanks TB,
What this demonstrates is that the net “greenhouse” effect is all determined by what happens up above ~6 km in altitude . It doesn’t matter whether CO2 doubles at the surface. The CO2 radiative forcing at the TOA can be offset by relatively small decreases in water vapour increasing radiative losses.
The other “known unknown” H2O feedback is clouds. A 2% increase in low clouds would reduce insolation at the surface enough to offset a doubling of CO2.
The oldest saying in computing still holds: garbage in, garbage out.
Sorry, I just can’t get my head around the conclusion that less water and therefore less cloud makes it colder.
I know at night and in the height of winter cloud cover means a bit warmer, but cloud cover on a hot summers day can mean 10-15 degrees colder, especially after a few days in a row.
So can you have much more water in the atmosphere without clouds?
“The NVAP-M project, which is not yet available, extends the analysis to 2009 and gives five vertical layers.”
Although not available yet, it is already understood: the data beyond 2001 has, in somebody’s computer, been added to the program that produced the earlier profiles. It is only the desire to have greater detail and certainty of results that has stopped the new data from being released.
If the new data contradicted the older data, that would have been put in a press release. The silence tells you that the new data is not supportive of CAGW.
People like Hansen and Gore already know about stuff like this. It is in their career, persona and financial interests to be aware of whatever is happening that might aid or detract from their positions.
ACO: Less water vapour at high altitude is the issue here. Cloud has been increasing at low level, along with water vapour since 1998 according to the ISCCP and Earthshine Project data.
I’ve been trying to tell everyone what really controls water vapour levels near the tropopause for the last three years. But because I used the NCEP reanalysis of the radiosonde data, which from the strength of this correlation obviously isn’t as bad as the warmists made out, no-one has paid any attention. Here’s the plot of 300mb specific humidity vs sunspot number:
Every day in the tropics water reacts to the daily “forcing” of the sun. Humidity builds up around early afternoon and low convection clouds form often resulting in evening thunderstorms.
Why should it be any different to the much smaller and slower forcing caused by a gradual build up in CO2 ?
Atmospheric water vapour must allways adjust to maximise heat loss through the atmosphere. That is simply the second law of thermodynamics.
Why on Earth wouldn’t it ?
“The program uses thousands of measured absorption lines and is capable of doing accurate radiative flux calculations.”
It is only capable to do that, if higher moments of atmospheric water vapor distribution are also given (beyond average concentrations). But they are not.
For water vapor is not a well mixed gas. A wire fence is a bit more transparent, than a thin metal plate, even if it contains the same amount of material per unit area, therefore the latter quantity is insufficient to calculate radiative flux to any degree of accuracy in this case.
clivebest says:
March 7, 2013 at 2:26 pm
“The other “known unknown” H2O feedback is clouds. A 2% increase in low clouds would reduce insolation at the surface enough to offset a doubling of CO2.”
Hi, It says here;
Click to access Teachers_Guide-Less-4-Aerosols.pdf
that aerosols are required for cloud formation.
Some types of aerosol are making clouds last longer by suppressing precipitation. Small, more numerous aerosols from combustion processes. Do you think this could increase the percentage of cloud cover sufficient to negate any warming from Co2.
Anyway do they really know how much dust (or salt or smoke or gas to particle formation of aerosols) there really is? Or whether aerosols have a warming or cooling effect? I have my doubts as they are very transient but constantly produced! Aerosol effects require better understanding.
http://www.dailycamera.com/boulder-county-news/ci_16960891
“The silt particles are larger, and not only can they scatter sunlight, but they also absorb it,” Kok said. “On balance, the silt particles have more of a warming effect than the clay.”
If Kok’s theory of how dust shatters is correct, he believes that climate models may now be underestimating the amount of silt that is blown into the atmosphere relative to the amount of clay, and therefore underestimating the possible warming effects of a dust storm.
For every particle of clay, there may be two to eight times more silt than what these climate models assume,” he said.
And the Black Carbon debate goes on;
Could it be that an abundance of the smaller type aerosol (from smoke and combustion processes generally) is creating persistent cloud cover that is suppressing convection and consequently reducing the supply of water vapour to higher altitudes. Less high level warming clouds, more low level cooling, by reflection, clouds.
No one has mentioned the possibility that Modtran which is the suppose basis of the claim of radiant heat absorption by CO2 in the atmosphere could be/is giving nonsense results see this http://claesjohnson.blogspot.com.au/2013/03/modtran-one-fly-lifting-20-kilo.html and subsequent posts.. Prof Johnson has made his own assessments, then noted comments from experienced engineers and has gone back to look at historical developments, checked calculations and under laying theory. His has found that there is no experimental proof for any of the claims by so-called climate scientists, and that there has been misinterpretations of measurements eg instruments measure temperature or a temperature comparison -then various calculations convert measured result often incorrectly to something else such as radiant heat which can not be directly measured.
Any engineer who has experience with measurements around heat exchange equipment will have satisfied himself that heat can only flow in one direction at a single point of time ie from hot to cold in accordance with the 4th postulate or 2nd law of thermodynamics.
Slightly off topic but this http://physicsworld.com/cws/article/news/2013/mar/06/atmospheric-electricity-affects-cloud-height should have general interest for readers of this blog.
Not long ago I was shocked when read somewhere that “some CMIP5 models now incorporate a carbon cycle.”
If true, it begs questions like “what on earth did they do before that?”, “do they bother to include a hydrological cycle?”, and “how could someone credibly claim to model CO2-water feedbacks before seriously trying to model them both individually?”.
tallbloke says: March 7, 2013 at 8:19 pm
“I’ve been trying to tell everyone what really controls water vapour levels near the tropopause for the last three years.”
Yes, and I ’empathise’ with you TB. However, sunspot activity isn’t recognised as a ‘valid’ proxy for the surface temperature that causes RH to force WV into the atmosphere and, subsequently, precipitate.
It would be nice to see a thread on what ‘sunspot forcing’ (?) may turn up for ‘atmospheric reactions’. 🙂
Best regards, Ray.
Ray, there are none so blind as the wise monkeys of the IPCC when it comes too recognising the role solar variability plays in climate variation. This is the area where there is genuine culpability it seems to me. They cannot justify the certainty of what they say in the SPM when at the the same tmw thwy admit to a ‘low level of scientific understanding’ of solar effects on upper atmosphere photochamistry.
Why after 30 years of intensive research on the climate the level of understanding is still so low is a matter for research funding agencies, faculty heads and cli-sci ‘experts’ to urgently explain and address.
TB says 9:32 am
‘Why after 30 years of intensive research on the climate the level of understanding is still so low is a matter for research funding agencies, faculty heads and cli-sci ‘experts’ to urgently explain and address’
Any rays of truth are being obscured by the fog of their own dogma. Or to put it another way, you can’t polish a turd.
Roger, re your comment on solar variability this post makes an interesting point http://hockeyschtick.blogspot.com.au/2013/03/changing-sun-changing-climate.html
Thanks for posting this.
There is a typo in the sentence above Figure 3.
Please change 58.5 to 68.5.
We will redo this analysis when the NVAP-M data becomes available.
[co-mod tidy]
tallbloke says:
March 9, 2013 at 6:08 pm
Ken: welcome. Typo fixed.
Ken Gregory says:
March 9, 2013 at 6:32 pm
When I refreshed, Tables 1 & 2 are screwed up.
tallbloke says:
March 9, 2013 at 7:06 pm
Ken,
Damned mobile phones! I was on the train when I edited the typo and made things worse. Sorry, will be fixed ASAP. [/tidy]
[co-mod: Sorted out tables and some images best I can. –Tim]
tallbloke says: March 9, 2013 at 9:32 am
“They cannot justify the certainty of what they say in the SPM when at the the same tmw thwy admit to a ‘low level of scientific understanding’ of solar effects on upper atmosphere photochamistry.”
I concur (typos translated). Though, that rings more true for the ‘ozone hole’ than ‘total insolation effect’.
I think CO2 in the strat may show some ‘mia culpa’ for SH depletion there, but the energy rate to the surface can also mimic this response. How can we distinguish the one from the other? Perhaps this can be shown from the 1st Principles of Psychometry?
Best regards, Ray.
suricat says: March 10, 2013 at 3:39 am
“Perhaps this can be shown from the 1st Principles of Psychometry?”
Oops, darn spell check changed it! That should read “Psychrometry”!
http://en.wikipedia.org/wiki/Psychrometrics
Best regards, Ray.
Summary: high altitude drying has cooled the planet far more powerfully than near-surface humidification. Warming seems to reliably cause this effect. The CO2-water positive feedback hypothesis is strongly rejected.
TB,
What is not being looked at is:
80% of the atmosphere is nitrogen which is very reactive to sunlight(meaning it vibrates like crazy on the planet surface and changes as it cools at night. It becomes more dense in the colder temperatures.
Our pressure measuring is off of water and is not sensitive enough to show changes. Sink holes have more pressure which effects evaporation differently.
The moon exerts pressure as well but again the measurements are off of water and NOT the actual gases.
I suspect that our understanding of gases from the sun is full of garbage as there never have been any actual captured gases but guessing off or radio waves. Pressure difference were not taken into account as denser gases can give a different reading to what is experimented on this planet.
In other words…Where does the nitrogen come from?
There is only one source that can keep replenishing it.