


- GC33H-07Atmospheric controls on northeast Pacific temperature trends and variations, 1900-2012
- Moscone West
- 3005
We show that SLP reductions and related atmospheric forcing led to century-long warming around the NE Pacific margins, with strongest trends observed from 1910-20 to 1940. NE Pacific circulation changes are estimated to account for more than 80% of the 1900-2012 linear warming in coastal NE Pacific SST and US Pacific northwest (Washington, Oregon and northern California) SAT. An ensemble of climate model simulations run under the same historical radiative forcings fails to reproduce the observed regional circulation trends. These results suggest that natural, internally-generated changes in atmospheric circulation were the primary cause of coastal NE Pacific warming from 1900 to 2012, and demonstrate more generally that regional mechanisms of interannual and multidecadal temperature variability can also extend to century time scales.

80%?
Add in small changes in cloud cover, and CO2 controls will be meaningless. Which I suspect 194 countries at Lima last week already believe.
their
atmospheric control of NE Pacific temperature
paper is here:
Click to access JohnstoneMantua2014NEP.pdf
looks like they clued in to the significance of Talkshop discussions of global ICOADS wind patterns
“The study cast doubt on the possibility that the wind changes were themselves caused by rising carbon-dioxide levels, noting that simulations employing the latest climate-change computer models found no such link, and that temperatures rose most sharply when carbon dioxide levels were lower.”
Jim Johnstone December 17, 2014 at 9:14 am
ren,
The red curve (top right) shows the evolution of sea surface temperature (SST) in the orange ‘Arc’ region bounded by the bold contour in the map (top left), . The blue line (lower right) shows the evolution of regional sea-level pressure (SLP), reflecting the area within the blue bulls-eye in the map (bottom left). SLP changes are inverted, showing a century-long decline, with fluctuations that (oppositely) resemble the SST changes. Our NE Pacific SLP index (SLP1) is also compared with the established North Pacific Index (NPI, in gray) covering areas further west. Both show evidence of century-long SLP decline, though changes are somewhat stronger in the east.
On time scales from months to multiple decades, low SLP in the NE Pacific corresponds to a tendency for cyclonic (counterclockwise) surface winds that weakens the mean clockwise wind pattern. The reduction in wind speeds reduces evaporative cooling at the ocean surface over the Arc, leading to incremental surface warming. SLP leads SST by ~4 months, and in fact the forcing is so stable and consistent that it’s possible to quite faithfully reproduce the SST record from current and prior SLP alone. All this leads us to conclude that SLP reductions and weaker winds primarily caused the century-long warming trend, just as they cause warming on shorter time scales. Some have questioned the validity of the early SLP data, but we conducted tests that strongly suggest the quality is good and the changes are real.
The full paper can also be found at my personal site:
http://www.jajstone.com
In NH is still the wind to the left.

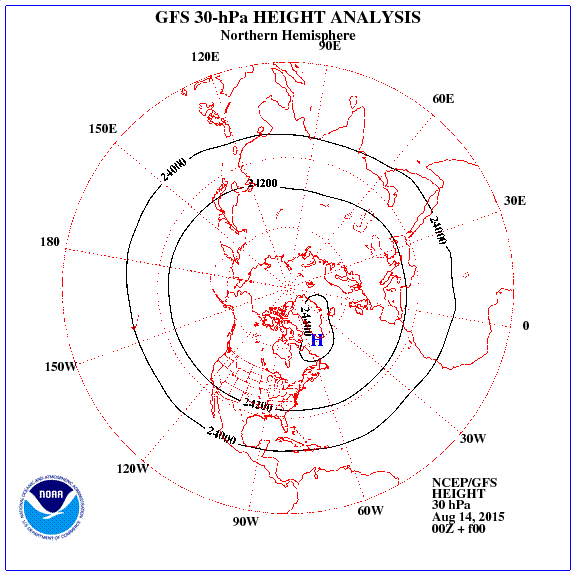
Let’s see where he currently is blocked polar vortex. You can see that it is shifted to Europe. Thanks to this arctic air has access to North America
(jet streams in the stratosphere located north of the Bering Strait).
Circulation is also responsible for cooling the south east Pacific (south wind).


Take a look at the distribution of ozone in September and the magnetic field.
There’s a subtle give-away in the strained wording about centennial natural radiative forcing.
The focus on the northeast Pacific is a convenient way to get attention AWAY from ICOADS global wind EOF1/PC1 and onto EOF2/PC2 (to support the lukewarmist uncertainty narrative needed in US politics for center-fence policing).
It’s clever and this sort of thing works in a context where the bar of integrity is lowered for “higher” purposes, as in american politics, but nonetheless it’s transparent to enlightened onlookers able to see through wild west, false front facade.
Every day I lose more respect for wuwt & ce. There’s no limit to how low they’ll stoop to support their treasured political agenda.
Paul Vaughan “This conclusion presents a new perspective on causes of NE Pacific and western US warming, and indicates that well-known dynamical mechanisms driving ‘multidecadal variability’ can also generate century-long regional warming as well. The findings raised some controversy, leading to front-page coverage in the Seattle Times and features by the New York Times, environmentalresearchweb, and numerous other media outlets.”
This led to a discussion, at least in the official media.
Paul Vaughan drought in California was an important point for followers of GW.
Americans will be more shocked because of a snow storm over the Great Lakes in Christmas ..
‘natural, internally-generated changes in atmospheric circulation were the primary cause of coastal NE Pacific warming’
Not convinced by this wording. ‘Natural, internally-generated…warming’ implies an energy source within the boundaries of the Earth system.
If that was really the case, where was the ‘century-long warming’ supposed to be coming from?
ren I’m not going to be shocked by Christmas snow, and I’m in the middle of northern lower Michigan on the 45th parallel. I cannot vouch for any other Americans not being shocked potentially, though, as so many are not paying attention. It’s not going to be a surprise to me. Why?
Because thanks to my own observations of high/low solar activity coupled with learning from your observations of high/low solar activity (and as to how those variable conditions pertain to the weather) AND there’s Piers Corbyn’s December forecast, which also recognizes those situations and how they infuence the weather, I know the Sun causes warming/cooling & extreme weather.
So thanks for your many observations through the year this year, here and elsewhere, where you have posted many graphics with some explanation as to some of the COOLING effects of solar activity. I’m sorry that I was too late to respond to some of your comments to me earlier this year.
In case you didn’t notice ren, I responded to the WUWT article of this same article topic as this here a few days ago, and in the end, I said, “I welcome your thoughts on that ren.”
In a nutshell, I said NE Pacific SST and SLP change with solar activity as does ICOADS data.
I am going to make a graph with that info in the morning to show you what I’m talking about so everyone here can see it. With the graphic I’ll repeat much of what I said there, here, for clarity.
Dr. J. Johnstone’s data really makes the case for solar warming of SSTs when it is recognized that the higher and lower levels of solar activity coincide very well with his data through both time series.
Bob W: Look forward to that. Let’s make a new post out of it.
ren (December 18, 2014 at 7:29 pm) wrote:
“Paul Vaughan drought in California was an important point for followers of GW.”
You may recall ren that I was well ahead of the pack in calling out California agents who were harshly temporally desynchronized and way out-of-line in global context due to regional spatial antiphasing. Keep reminding them of earth orientation parameters. They hate that because they’re secretly aware that it’s true proof.
This trick of chopping off PC1 at 1920 is pure treachery — reminder: see the link to the California drought paper I referenced (highlighted on p.4) to alert the community of exactly why they do that. It would be unwise to underestimate their cultural power. California’s a network of natural illusion masters with Hollywood at the apex. California’s a formidable (one could even say warlike) exporter of fiction, fantasy, & demanding cultural prescription. Wind & evaporation (proportional to wind speed cubed) are invisible, right?…
Cultural imperialism demands that you submit. Why aren’t you cooperating?? (/sarc)
Regards
TB – I would be remiss if I did not point out all the efforts you et al have done on the subject, like here https://tallbloke.wordpress.com/2011/02/13/roger-andrews-the-solar-sst-relationship/ for example, and here https://tallbloke.wordpress.com/2011/02/17/roger-andrews-the-solar-sst-relationship-part-ii/ …. and I’m sure that’s just a small sample or pertinent Talkshop articles.
Solar flux is very high right now. Keep an eye on it. The Sun was very bright yesterday and still is today. Penticton recorded an F10.7cm flux at 20:00UTC of 213 sfu, and two hours later the number went up to 261 sfu!
Just got going here noon today, and have some business today; I’ll be on it later today. Thanks.
Climate State of This Belief
(born with Thomson’s error)
Climate Diss Belief Strategy 101:

Leverage the intoxicating cognitive scrambling power of this (at campaign stage 1):
That’s EOF2.
Attention to EOF1 appears strictly forbidden under state enforced climate law. Will they go to any lengths (not just talking about corrupting search engines) to assassinate this observation (PC1)?


I predict: yes.
Bob, it will take a long time for the integral to go down.
Meanwhile SCD is still taking the NH upwards.
(and also remember we’ve just entered the bidecadal upswing)
Don’t underestimate how SCD distorts RI spatially.
The globe isn’t uniform.
Regards
Bob Weber (December 19, 2014 at 4:24 am) wrote:
“Dr. J. Johnstone’s data really makes the case for solar warming of SSTs when it is recognized that the higher and lower levels of solar activity coincide very well with his data through both time series.”
Johnstone’s highly strained wording (see the blue “Significance” box on p.1 that tells you want to think) actually rules out (from his perspective) this possibility, as OB has correctly interpreted above.
“internal variability”
“internal variability”
“internal variability”
Try it.
If you say it enough times you might just believe it ….
… especially is you’re “helped” (or should I say bobbed?) by epic 20 part series illustrating ensoic stairways to heaven … “dear lady can you hear the wind blow, and did you know? your stairway lies on the whispering wind” — Led Zeppelin
Their premonition was so clear and so vivid it even included an Atlantic label on a ring to remind us that southern ocean westerlies spin fast around antarctica on our kinetically asymmetric planet.
Now say “internal variability” 10 more times (and look daily at BT’s graphs for reinforcement). They’ll make a submissive believer out of you one way or another (foreshadowing “higher” campaign stages…)
Blue box says:
“these changes are not likely related to […] natural radiative forcing”
Vision with blinders on:
bobbing EOF2/PC2 yo-yo
Corrected vision — with blinders removed:
awareness of EOF1/PC1 not suppressed
Bob Weber use the chart neutrons, because it best shows the real impact of the solar wind to the Earth. Number of spots is not doing it so accurately.
http://cosmicrays.oulu.fi/
Location of polar vortex refers circulation to the entire northern hemisphere, and hence the temperature distribution in the winter.
Due to the reduction of the ozone in the winter ionizing radiation increases very close to the ground.

Bob Weber prepare a good coffee. December 25 the pressure in your area will drop to around 980 mb.
I’ve got a great coffee in hand right now ren! It is a lot of fun seeing all this happen. I was up late again, this time making Oulu yearly plots to compare with other indices. When I saw the peaks in GCRs that looked to be timed with El Nino’s, I went to here http://ggweather.com/enso/oni.jpg and checked it out, and lo, and behold, the peak El Ninos seem to occur at or just after the very crest of each long term GCR wave, corresponding to just at or after solar minimum.
I’m going to making a plot of that too. It’s going to be several days before I can get back here with something coherently written with graphs. It just so happens that I’ve been pushing to get my site up with my feature article(s) on solar warming/cooling & extreme weather events, and its all taking a lot of time. The information just keeps piling up in support of that, like Dr. JJ’s paper, and the like.
On the new site will be pages of products like the Effective Dose Rate image you posted above here ren, images of realtime and historical data covering solar activity, cosmic rays (>6 graphs), stratosphere products, ozone, atmospheric temperature/pressure/height, ocean temps/anomalies/heat, ice caps, water levels, and weather variables. The intent to to be able to go there and see what’s going on at all times in near realtime with all these different indices.
Some of the images are from links you provided in various blogs this year. So thanks for being persistent. I think it’s important to be able to back up any current (or past) event-based analysis with hard data in a format that is easy on the eyes and intuitively understandable.
TB – I just received my NCAR registration so I can now get the ICOADS data. The ICOADS data makes the point better than ERSST, so I think it’s worth the extra time. I’ve telegraphed several times at the other place too that I’m putting this all together, so I want it to be good for all.
Paul – I’m not worried about them. Their resistance to what I’ve been saying has virtually vanished as I think they realize the Sun is it, even if they can’t take it all in at once or explain it themselves.
So I think having a thorough argument based on facts that fits historical and current observations is what is going to carry the day. Objective reality WILL beat consensus reality.
It comes down to communication. I have tried to avoid bashing people or places. When we speak or write we should not talk down to them either, as that sets people off too. It’s a very narrow road.
Paul I’d like to know if I can feature your solar-climate work at some point, interview style, so I can reduce your complex analysis down to street-level language so everyone can see how cool it is. Obviously anything like that could be reblogged here if its up to snuff…
Bob, sometimes philosophical differences are intractable. When you come to your senses and walk away from wuwt, please feel welcome to let me know.
Regards
I will only do that if I am not allowed to say what I want to say. My message is for everyone, including warmists and otherwise. If we all keep condescending to each other there is no progess.
Bob, our philosophical differences may be intractable.
I’m amazed that you are so cynical Paul. It’s hard to believe you would make a statement like that.
Since you’ve given no indication what those supposed differences are except possibly my participation somewhere else, which is a silly and meaningless criteria, and since you haven’t clarified what philosophical differences you mean otherwise – you clearly wish for them to remain intractable. Your method of browbeating with obtuse language is working against you.
I’m positive you did not notice the many epic battles over there between your favorite antagonists and myself, where 95% of the time they LOST the argument to the FACTS, even if they didn’t acknowledge or know it. They have a lot of pride over there too.
We are all in this together. It gives me great comfort Paul knowing that others who frequent TB’s excellent adventure also frequent the other place, regularly. I don’t see you calling out TB, ren, Vuk, et al for their participation over there. Our mutual friend Piers does not impugn me for that either.
I’m giving this a rest with you today. It’s not worth it. It’s not going to be worth it tomorrow either, or any other day. You can stay well behind the front lines if you feel safer there, but I’m taking the battle to where it needs it needs to be waged.
Today is my 55th bday, and I’m going to enjoy it drinking good coffee, making charts and graphs of solar-terrestrial relations, and not giving another thought to your “differences”. Have a nice day.
Bob Weber says: ‘If we all keep condescending to each other there is no progress.’
There’s a danger of giving credibility to nonsense by deeming it worth debating.
Bob, 1+1=2 is met not with acknowledgement at wuwt but rather protracted harassment. Thus wuwt is not a front line, but rather a place where truth is sidelined. At a minimum, 6 commentators there would have to be permanently banned before I would consider reading comments there again.
Regards
Bob and Paul visible inhibition of polar vortex over North America and a shift towards Africa.
http://earth.nullschool.net/#2014/12/26/0600Z/wind/isobaric/10hPa/orthographic=-181.72,98.25,344
Bob W: When I saw the peaks in GCRs that looked to be timed with El Nino’s, I went to here http://ggweather.com/enso/oni.jpg and checked it out, and lo, and behold, the peak El Ninos seem to occur at or just after the very crest of each long term GCR wave, corresponding to just at or after solar minimum.
I been saying for years that some of the energy put into the ocean by the Sun (and less cloud obstructing it) during the solar cycle, comes back out at solar miinimum. Recently Ian Wilson discovered El nino match lunar timing too. I graphed both here:
I don’t see you calling out TB, ren, Vuk, et al for their participation over there.
I finally stopped participating over there in January when Anthony Watts chose to misrepresent our work and allowed Willis Eschenbach to publish libelous and scientifically ludicrous attacks on world class scientists such as Jan-Erik Solheim.
However I fully support your efforts to take the solar-terrestrial facts to the lukewarm mudpool that wuwt has become. Paul’s apparent cycnicism is borne of long experience of the way Solar-terrestrial arguments are twisted, shouted down or deleted over there. Anthony Watts highlights papers that claim to refute solar-planetary-terrestrial papers, but won’t flag up response papers which point out the errors in those rebuttals, even when they’re pointed out to him with helpful links. Such is the nature of the wuwt team bias.
ren, my old Dell XP bumped to Vista topped out with IE9 won’t run the wind map site, which requires IE10. The only way I’d know what you mean is if you gave me a play-by-play of which way the wind was blowing, like a baseball game on the radio. It’s high time for that computer upgrade…
Bob Weber all the best for the next 55 years. Try the coffee with ginger.
@Bob Weber and ren: try the follwing service URL, it should capture (any) web page and produce a web screenshot as plain image for view and/or download:
– http://web-capture.net/
Season greetings and thanks for the good work 🙂
P.S. tested it with http://earth.nullschool.net/ and it works (there are other web/screen capture services which won’t).
With Windows Vista or later you can use Snipping Tool (in Accessories).
http://windows.microsoft.com/en-gb/windows/use-snipping-tool-capture-screen-shots
@oldbrew (December 24, 2014 at 12:17 pm) his browser is too old and does not render, nothing to snipp 😉
If Vista upgrade is installed: press Windows key and type ‘Snipping Tool’ in the prompt box.
http://www.carbonbrief.org/blog/2014/12/pacific-winds-change-the-speed-of-global-warming-says-new-study
We’ll need to discuss this sometime.
I see the distortion artistry about this already overdriving at wuwt (the usual enso yo-yo stair-master / political puppet-master theme).
But of course we can’t expect them to acknowledge a geometric proof that’s politically inconvenient. (much easier to claim 2+2=5 and stick to that story…. (/sarc))
Paul Vaughan
“We then reconstruct central Pacific temperatures using Sr/Ca ratios in a coral from Jarvis Island, and find that weak trade winds and warm temperatures coincide with rapid global warming from 1910 to 1940. In contrast, winds are stronger and temperatures cooler between 1940 and 1970, when global temperature rise slowed down. We suggest that variations in Pacific wind strength at decadal timescales significantly influence the rate of surface air temperature change.”
http://www.nature.com/ngeo/journal/vaop/ncurrent/full/ngeo2321.html
I think that a strong wind greatly increases the evaporation on the surface of the ocean and cools the surface. It is quite obvious ..
ren, perhaps there has been a misinterpretation.
I’m not pointing away from evaporation:
”
P'(s,t) = ( { |A(t)-B(s,t)| * [ A(t)*B'(s,t) + B(s,t)*A'(t) ] } – { [ A(t)*B(s,t) ] * [ ( A(t)-B(s,t) ) * ( A'(t)-B'(s,t) ) / |A(t)-B(s,t)| ] } ) / ( A(t)-B(s,t) )^2
A(t) ≠ B(s,t)
A = solar cycle length nearest-harmonic
B = a given internal cycle period
P = beat period
s = space
t = time
‘ indicates rate of change
^ indicates exponentiation
It’s important to recognize that the effect of changing solar cycle frequency is generalizable even with incomplete knowledge of Earth’s internal cycles.
“
But of course a trivial geometric proof cannot be allowed to stand in the way of politics. To someone primarily concerned with politics, this just appears as a vacuous statement with no apparent meaning.
Season’s Best
Paul Vaughan a lot of runs in this topic Vukcevic.

ren, I’m well aware of vukcevic’s illustrations. You may recall this illustration I’ve shared.
What concerns me:
Due to egregiously & inexcusably sloppy attention to aggregation criteria, the mainstream (including Meehl, England, Mann, Curry, & Wyatt) is conflating signals of a fundamentally different origin. They just can’t (or wont?) get their eyes off the ENSO bounces. It’s the shiny thing that attracts their attention. But it’s only a powerful scrambler.
The longer they procrastinate before they make time to develop conceptual foundations firsthand, the more time they will have lost and the more damage they will have done to mainstream integrity.
It’s a proof. It’s not going away. It’s just a matter of how long before mainstream recognition (or in the darkest case, how long until rediscovery following an era of suppression).
The heart of a split land:
The constant spotlighting of ENSO and ENSO staircases is a deliberate, politically motivated deflection tactic. It’s an essential component of the uncertainty narrative needed for lukewarmist center-fence policing in american politics, where the elite are constantly making investments to re-tune the near 50:50 split. There’s strong belief that all that glitters (enso) is gold and that a stairway to heaven can be bought. But of course the wind is whispering otherwise (to the third power…)
Reminder: I deliberately left vague an illustration on page 4 of ERSST EOF 1234. I choose to reveal now that this is deliberately intended to test Willie Soon, whose judgement I now choose to openly question.
“Be aware of why Tomas Milanovic has criticized the linear detrending. PC1 of ERSST is not a straight line. Note that the cosine component has been artificially forced to load on PDO. PDO is not of the same nature as AMOC and the conflict between Mann & Wyatt is going nowhere because neither party is being sensible about how AMOC differs fundamentally from PDO. PDO & AMOC are not orthogonal. That’s a fundamental misinterpretation of the data. PDO is of a completely different nature. When AMOC has been properly isolated, PDO is a node in the stadium wave correlation cycle. […]


[…] Aliasing at a single temporal frequency generates pattern that varies qualitatively with spatial orientation of the aliasing axis. The celestial notching is a background pattern through which we must sensibly lens to see the solar integral & frequency components.”
A lot of american social engineering capital is being expended to promote a gamble against the odds of wind speed cubed. Understatement: That’s a pretty inadvisable gamble.
Reblogged this on Globalcooler's Weblog.
Repeat after me:
This observation does not exist.
This observation does not exist.
This observation does not exist. (/sarc)
american politics will not be stopped by a geometric proof
you can be sure of that
watch them just steamroll the truth in machine-like fashion for whatever ends they have in mind
the truth is stoppable
but they are not
Members of this community will be aware that I normally steer clear of making predictions. I’ve made an exception above. (“I predict: yes”.) It’s a serious prediction. Bon Courage.
Paul Vaughan let me I’ll be predicted: severe winters ahead.
careful ren
the sunspot integral (RI) won’t just suddenly fall off a cliff
and the solar cycle is still decelerating (SCD), which means spatially seesawing warmth towards the northern hemisphere
it’s a geometric proof (based on the laws of large numbers & conservation of angular momentum) and its not going away just because people refuse to invest some simple basic effort to understand
yes it crushes narratives
i realize that’s why there’s resistance
but it is what it is and it’s a geometric proof, so sensible parties are well-advised to reorganize their narratives without procrastinating further
regards
ren,
integral decay is a slow, gradual process
the thing to watch out for is a sudden solar cycle acceleration, as occurred around 1800
financial, healthcare, & military strategists who are not prepared for that possibility are not prepared and not competent
abrupt solar cycle acceleration is a northern hemisphere game-changer
the question is: when will it happen next? Guarantee: co2 & human co2 politics have NO influence whatsoever on its timing
alarmists & lukes: you’d better pay attention
the rationale goes like this:
Instability in the human population whether due to financial, health, or military stress is a major threat to the environment because human standards fall with increasing human desperation, which peaks with reductions to raw survival. Environmental protection strategies dependent on eternal maintenance of centralized power are naive. There will be natural shocks to the system. Centralized power will eventually fail, resulting in environmental protection outages, during which a lot of environmental damage could be quickly done. The best you can do is plan to delay failure. Capacity to harmonize with nature helps secure a bid for longevity, including long-lived environmental protection. If you appear unwilling to acknowledge a geometric proof, you appear corrupt and not up to the important task of protecting security & the environment. Advice: When it comes to harmonizing with nature, an order of magnitude more sobriety will be needed, including in public relations.
Paul V: the sunspot integral (RI) won’t just suddenly fall off a cliff
agree 100%. My own projection to 2050 is the yellow curve on the upper pane of this model. which assumes Dalton-like SSN values.

“The sea level story is a bit more complicated as shown in the actual sea topography with its hills and valleys. The balancing point is zero (yellow) on this scale and what immediately strikes is the deep and large trough of up to two metres deep around Antarctica, caused by very strong westerly winds which due to Ekman spiral, move water away from Antarctica towards the equator. The balancing bulge (red) goes only to one metre high and is more widely distributed.
Thus depending on wind strength around the poles, more or less water is pushed towards the western sides of ocean basins while water is borrowed from the eastern sides of these basins and from the poles.” — http://www.seafriends.org.nz/issues/global/climate4.htm#Are_sea_levels_rising?
Credit: http://www.atmos.washington.edu/2003Q3/101/webnotes.html
Great plots Paul. Can you give us the link in the first plot labelled ‘ERSST EOF 1234’
Thanks.
harsh kinetic energy asymmetry


TB: link trail
Suggestion for serious parties (including Willie Soon & Matthew England if they are serious): Independently reproduce all of the curves on graph 1 of p.4 of ERSST EOF 1234. It’s a rewarding, involved exercise.
Regards
The forecasted assault has already begun.
“I’ve excluded the polar oceans from the data presented in this post. That is, the data are for the latitudes of 60S-60N. This is commonly done in scientific studies […]”
It’s hard not to chuckle reading that:
“commonly done in scientific studies”
I’ve done a preliminary exploration of ERSST v4 changes from v3b and I have to report severe rewriting of polar history (60N-90N & even more egregiously 60S-90S).
A severe act of vandalism has been committed on the Southern Ocean in particular.
Southern Ocean EOF1 & EOF3 have been defaced beyond recognition.
(By definition the change to EOF1 is a fundamentally serious matter.)
This is as dark as dark gets in the realm of climate dark agency.
Trying to correct such absolute dark agency is impractical.
Human nature is what it is.
Strictly untenable physical, geometric, & geographical assumptions have been artificially imposed to achieve a dark (endgame magnitude) extrapolation of (perhaps ultimate if left unsuccessfully challenged) political utility.
It’s clear at this stage that the silencing efforts will incrementally go to whatever extremes are needed to eventually achieve full political narrative control.
Historically, the release of ERSSTv4 may well mark the end of worthwhile climate discussion.
Reviewing what I just commented I realize immediately that I had better make (without any delay) the following clarification:
I’m referring to global EOF1 with attention to the Southern Ocean portion of it
(not EOF1 of only the Sourthern Ocean).
By definition the change to EOF1 is a fundamentally serious matter.
It’s important to recognize that it demands of the Indo-Pacific Warm Pool and Southern hemisphere wind fields (in particular the powerful southern circumpolar westerlies) something totally impossible.
This is a very serious matter. (Denying elementary geometry is a sure way to unambiguously expose ignorance &/or deception to enlightened onlookers. We’re guaranteed to learn something about the honesty & integrity of NOAA because of this slip-up.)
Now I need to go hiking & sea-kayaking to rise above all of this darkness…
typo:
Thomson (not Thompson)
They’re trying to cover up Thomson’s error because it’s so important.