


WUWT’s resident cowboy-turned-climate-expert WIllis Eschenbach responded to a comment I recently made on his thread ‘Cycles Without the Mania’, where he set out to prove a negative – that the rest of the Solar system can’t have any effect on the Sun, and thereby, Earth’s climate systems. It was a followup riposte to Nicola’ Scafetta’s latest paper, under discussion here at the Talkshop.
This was my comment:
tallbloke says:
July 30, 2013 at 12:04 am
There are roughly speaking, three el ninos per solar cycle. the big one occurs soon after solar minimum when the ocean goes into reverse and kicks heat out instead of absorbing it, unless there was a volcanic eruption in the previous cycle, in which case the PWP is already partially discharged. Consequently the following big la nina usually occurs near solar max. That’s why there’s often a dip in global T near solar max.
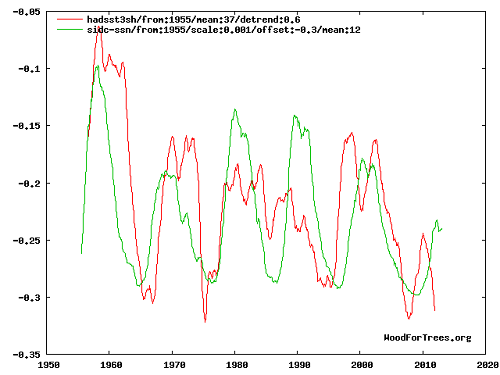
If you smooth the temperature data at 1/3 solar cycle or at the average frequency of the ENSO cycle (around 40 months) you get a good correlation between solar activity and global temperature. The amplitude isn’t that big, but this is due to the antiphase nature of ENSO surface temps and solar cycle described above. The Sun is having a large effect, but it’s hidden below the surface, most obviously in the Pacific Warm Pool.
All fairly obvious easily empirically observed from the records, and not controversial, or so I thought.
But Willis wanted to set me straight:
Willis Eschenbach says:
July 30, 2013 at 7:23 pm
Thanks, tallbloke. If you’re going to say that there is a relationship between two datasets, say HadCRUT temperatures and sunspots, there’s a couple of things you need to do.
First, you need to use all of the data available. You’ve only shown the data from 1955.
Next, you need to actually calculate the statistical significance of the relationship.
Finally, I prefer scatterplots to time series plots because the human brain is a cycle-finding machine. We survive in large measure because of our ability to anticipate what’s going to happen, based on the fact that we’ve seen a particular cycle before. As a result, we tend to see relationships where none may exist.
With that as a preface, here’s the long-term relationship between sunspots and HadCRUT4 temperatures:
It’s at this point Willis pulled out a scattergun from under his Lee van Cleef style coat and;
BLAM!

And the numbers:
Coefficients:
Estimate Std. Error t value Pr(>|t|)
(Intercept) -4.078e-03 6.888e-03 -0.592 0.554
ssnhadwindow 7.442e-05 9.591e-05 0.776 0.438
The right-hand column show the statistical significance of the intercept and the trend. They need to be below 0.05 to be considered significant …
Here is the same thing, for the BEST data (land only):
BLAM!

And the corresponding numbers:
Coefficients:
Estimate Std. Error t value Pr(>|t|)
(Intercept) 0.0189089 0.0139720 1.353 0.1761
ssnhadwindow -0.0003451 0.0001945 -1.774 0.0762
Now, that one is approaching statistical significance for the trend (although not for the intercept). However, look at the size of the trend—for every hundred sunspots, the land is (supposedly) cooling by three hundredths of a degree … and max sunspots is about 200.
So the maximum effect, IF it were statistically significant, is a COOLING as the sun’s activity INCREASES, of about six hundredths of a degree.
Nothing left of the data to see here folks, move along. I decided not to repond to this. At the time I was embroiled in a rather unpleasant dispute with Leif Svalgaard, who had just falsely accused me of fabricating a quote from exoplanet researcher Katja Poppenhaeger. However, Talkshop contributor Bart took on the task and commented on Willis’ statistical expertise:
-
Bart says:
Willis Eschenbach says:
July 30, 2013 at 7:23 pmWillis – of course you are not going to see a relationship in the way you are doing it. If you quickly turn the heat up and down under a pot of water, do you expect you would see a relationship between your instantaneous twisting of the knob and the temperature of the water? Of course not. The scatter plot would look like an amorphous cloud of dots, just like these.
You are dealing with a system with enormous thermal mass. I recommend, as a first cut, that you try filtering the sunspot data to lower and lower bandwidth, up to the limiting case of a pure integration. Then see if you don’t start to see a correlation at some point.
There are far more sophisticated techniques available, but, you might find something this way.
-
Bart says:
And, don’t detrend the temperature data. The low frequency regime is where you are going to see the action, due to the low pass characteristic of all that thermal mass.
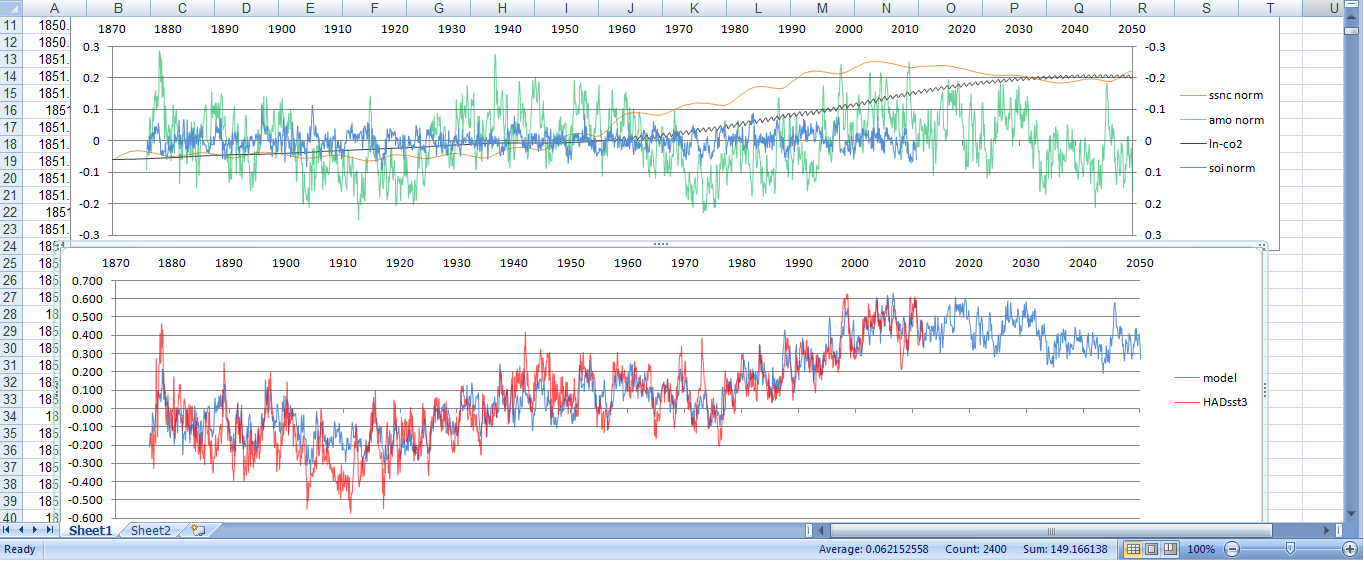
I started work on integrating the solar data to make it more comparable to the high-mass slowly warming and cooling ocean in 2008, culminating this year in my simple model which contains a major solar integration component and successfully replicates HadSSTV3 to an R^2 of 0.9 using monthly data back to 1874.

Like smoothing & differentiation, none of us can claim ownership of integration. This is very old knowledge, applied routinely by countless sensible parties within seconds of downloading any time series.
Way back whenever, I noticed that the 1940s “bump” (as the climate “scientists” call it) didn’t match the sunspot integral.
Slowly – in a series of steps over time – I became aware of why:
Hmm, I’ve looked into the referenced Sethares paper, in particular for prime number references and unsteady pulse references and found that Sethares and Staley say they “.. consider to be the greatest limitation to the idea of detecting rhythm via periodicities, that rhythms can and do change their underlying pulse rate, whereas periodicities do not.” See 4.1.3 and Fig. 6 in the paper and ensure that you read they say “… fails to reveal any significant structure.”
So why would I even think about using Integer Periodicity Analysis (for e.g. things other than artificial musical performance) when I know in advance that the rhythms (yes: plural) in the data signal cannot be matched with Integer Periodicity?
Eschenbach’s “R” code says it loud and clear: it’s integer periodicity that is being sought, and it’s pulse rate that is being ignored, simply because someone believes this “must” be so in the data signal. Oh my oh my.
Paul, to some extent I agree. Leif Svalgaard came up with a list of papers going back 30 years or so which integrated the sunspot number. However, so far as I’m aware, I was the first to relate it to ocean heat content, which underlies changes in Earth’s surface temperature, back in 2008. If you have a graphic from before then, bring it on!
RJ Salvador should NOT have received the darkly ignorant &/or deceptive reception recorded here:
For those who still don’t understand, see the following to learn some simple methods that will clear the fog:
Donner, R.; & Thiel, M. (2007). Scale-resolved phase coherence analysis of hemispheric sunspot activity: a new look at the north-south asymmetry. Astronomy & Astrophysics 475, L33-L36.
http://www.aanda.org/index.php?option=com_article&access=standard&Itemid=129&url=/articles/aa/abs/2007/45/aa8672-07/aa8672-07.html
Step 1: Aim to become able to easily reproduce their figure 4. (It should take seconds.) Use a wider support span to overcome the “noise” (actually 100% systematic bias to those aware of its origin) in their phase estimates.
Those who beg for code – as we saw with recent darkly abusive harassment of Nicola Scafetta – are voluntarily publicly advertising quantitative innumeracy (something they need not do). They would be wise to learn a lesson from Judy Curry’s genuine honesty in response to the eloquent writings of Tomas Milanovic about spatiotemporal chaos at Climate Etc.: It isn’t sensible to try to give expert commentary on that which you don’t even understand at a basic level. Those perennially begging for code at wuwt remind me of those who would reliably beg me for assignment answers right before every university assignment was due. (The worst begging was for fluid mechanics.)
Caution: Let’s be careful in discussion not to confuse &/or conflate North-South asymmetry on the sun with North-South asymmetry on Earth. Donner & Thiel just happened to be investigating N-S solar asymmetry. Here in this comment I’m suggesting using their paper to learn their quantitative methods so that those methods can be applied to plain sunspot numbers.
I’ll consider outlining further refinements voluntarily if several solar & climate enthusiasts clearly overcome step 1.
TB: no quibble there — inventing the sunspot integral and comparing it to other variables = 2 quite different things
Now: I just wonder if you still think the 1940s “bump” needs shaving?
[ :
@ Chaeremon (August 3, 2013 at 1:41 pm)
As I’ve been saying:
Pumping rate & persistence are the keys.
NB: Pulse rate is easily measured using wavelets. The authors of the article you reference have an awfully narrow conception of wavelets. For example, the wavelets I use fall outside of their “wavelet” definition. Sometimes cross-disciplinary communication hits brick walls simply because of semantics & dialects. Let’s slow down here and be sure we understand one another.
In reference to:
RJ Salvador should NOT have received the darkly ignorant &/or deceptive reception recorded here:
As doing an integration to get a correlation to the temperature anomaly is just doing a correlation to the monthly temperature change of the temperature anomaly and summing it, I looked for the reason why my much maligned cosine term worked in the 11 year averages of the temperature anomaly change actual and from the correlation. This can be seen in the following two graphics.
The first graph shows a comparison of the 11 year running average temperature change of the temperature anomaly and the same for the cosine correlation term. The second graph shows a comparison of the cosine correlation to two time dependent cosines. And what shows up but our old friends of frequency 21 to 22 years and 60 to 62 years.
http://imageshack.us/photo/my-images/827/6vvf.jpg/


http://imageshack.us/photo/my-images/12/fmcq.jpg/
RJS: Welcome, and thanks for your interesting plots. So, Hale cycle and the 60 yr Jupiter-Saturn cycle frequencies. No wonder you got a hard time at WUWT. 😉
RJ, I knew all along that your cosine term was a crude alias of changing sunspot phase. Anyone who does the diagnostics carefully will see this. What darkly ignorant &/or deceptive antagonists falsely assume is noise is largely systematic bias.
There seems to be a consensual group mentality intoxicating politically-charged blog discussions, with a seemingly shared aim to dumb things down to an administratively defensible narrative rather than bother risking lost votes by thinking things through carefully, potentially losing voters in the process of making them think hard rather than facilitating fun (political “red meat”) indulgence in an unethical, undeserved town square stoning. You’ve handled it with grace and earned my respect.
—
Thanks to Chaeremon, whose reference prompted a more careful look at this:
Sethares, W.A.; & Staley, T.W. (2001). Meter and periodicity in musical performance. Journal of New Music Research 22(5).
http://citeseerx.ist.psu.edu/viewdoc/download?doi=10.1.1.80.1924&rep=rep1&type=pdf
“A significant limitation of the method is that it requires a steady tempo; pieces which change speed lack the kinds of periodicities that are easily detected. Accordingly, our focus is on music with a steady pulse.”
Well there you go — absolutely perfect by design for obscuring the nature of solar-terrestrial relations, whether by dark ignorance or by dark deception.
Another cautionary note:
Wavelets can be linear-in-period and don’t need to have orthogonal bases as the authors (in their narrow conception of wavelets) falsely suggest.
Don’t get me wrong. I admire the intelligence of these authors and I appreciate their work. But their conception of wavelets is (or at least was in 1999 & 2001) insufficiently generalized.
Sunspot numbers violate at least 2 of the base assumptions of their methods. Any sensible explorer attempting to employ their methods will see this effortlessly by applying due diagnostic diligence.
This is not to say that their method cannot be modified to become applicable to sunspot numbers without violation of methodological base assumptions. The authors acknowledge the following clearly in their conclusions:
“The method […] does require that the tempo be steady, and finding ways to accommodate tempo variations is an important area for further study.”
Sethares tried – with sunspot numbers (“[…] the (approximately) 11-year cycle of sunspot activity is repetitious without being periodic […]”) – and didn’t get very far.
Direction:
Donner & Thiel (2007) outline a rock solid method that does the job elegantly — see my comments above.
Use the foundation they provide to build a generalized wavelet tachometer, which can be used to measure pumping rate.
—
A few additional relatively minor technical comments on Sethares & Staley (2001):
Sinusoids aren’t the problem the authors suggest. For example, nonstationary anharmonicity gives a work-around – (probably better described as a fruitful exploratory opportunity… details another day…)
Although they emphasize “combs” & “prongs”, they don’t emphasize that the width of rake receivers can be tuned at tuned tine-spacing to clearly detect structured (nonuniform) volatility, even in the presence of spatiotemporally-turbulent coupling, mixed spatiotemporally-multipath echoes, & nonlinearity that can – each or in combination – generate mirage (a technical term – somewhat of a misnomer) correlations, which convey information about real (not mirage in a colloquial sense) processes.
—
TB: Sorry if some (not all) of this seems technical overkill for a blog that laudably aims to keep a general audience comfortable, but there was a LOT of very offensive quantitative misinformation in the wuwt article & discussion you reference. It was so bad I boycotted.
Leif is a piece of work. But, I’m afraid you played into his hands by becoming enraged, and that set up a contretemps between you and Anthony.
Remember, the game isn’t establishing truth vis a vis one person, but in persuading the wider audience.
I’m one to talk, since I have many times allowed myself to be goaded by Leif’s either intentional refusal or technical inability to clearly assay the evidence. But, it is something I try to remind myself from time to time as well.
The way these guys go about trying to prove non-correlation by creating hopelessly misguided measures of instantaneous, raw measurements, drives me up the wall. It’s like they never graduated from algebra to calculus, and have no inkling of the frequency dependent amplitude and phase response of differential operators. Willis’ silly scatterplots are looking at purely high frequency noise. It is hardly surprising that there is no evident correlation. It would be a major surprise if there were!
I quit reading and responding to W’s math puzzles. His ego is too big for interactive blogging and his maths often overreach his understanding of the puzzle. His machine gun nest response to criticism is legend. Anything that comes up short of accolades for his missives is greeted with intemperate volleys of poorly formed imprecations and protestations of people not doing their own homework and other silly distractions. It reminds me of a joke.
@ Bart (August 3, 2013 at 7:18 pm)
Just boycott exchanges with the dark agents that are treated by the host as special guests. In more fair forums, simply demand that dark agents of ignorance &/or deception never address you again (if the host lets the problem get that bad in the first place). If laws for online conduct were up to date, we would have the same protections we have in person (against stalking & abusive harassment) and it would be clear that those laws extend into homes.
Regards
I don’t have a problem with Willis. Some of his puzzles have been interesting and enlightening. I don’t worry too much when he goes off the rails because I think everyone recognizes that he is not claiming a mantle of authority, but is generally trying in his own way to come to grips with a particular concept.
Leif, however, does claim a mantle of authority. And, while he is evidently very familiar with specific aspects of solar physics, he does not appear to be well-versed in mathematics in general, and systems theory at all. Some of his statements are just jaw-droppingly from an alternative universe.
Yet, he is one of those guys who absolutely will not admit that he does not know everything there is to know, and he doesn’t even think about what others share with him before launching into caustic, and usually ill-conceived, invective. It is a personal NIH syndrome on steroids.
I do not much like that fellow, and I usually avoid commenting in the same thread, unless my level of annoyance rises high enough to impel me to do so. I generally regret it afterward, because it is always ultimately futile to attempt to reason with him, and it always ends in an insult match.
@ Paul Vaughan
“RJ, I knew all along that your cosine term was a crude alias of changing sunspot phase.”
Yes, I think you were the only one and I appreciated your in sight. I’ve learned much more about solar phenomena since then and I would have framed the article differently knowing what I do now. However I can see the reception would be the same from certain individuals. You can tell the leopard by his spots.
@Bart
I agree with you that it comes down to duration and intensity. Anyone who has experience working with large physical process will know that lesson well.
TB: WUWT is good for raising interesting solar & climate topics, but not always for sensible discussion. When you run parallel discussions here, we get the best of both worlds.
Thanks sincerely.
May I suggest running deliberately mirrored threads when Talkshop-style topics come up at WUWT? My guess is that you could attract some of the more talented & sensible contributors over here where the atmosphere is more harmonious and less thought-policed.
To some extent you already do this. I’m suggesting (requesting if you prefer) that you do it more consciously and deliberately, in part to make statements about freedom & harmony, 2 things you do very well.
In short: Let’s find a simple, practical way to bypass WUWT’s interference with free, harmonious discussion without giving up WUWT’s topic-raising utility. In time people would know to look here for a better conversation when interesting topics come up.
Is this doable?
Paul, easily doable. Flag the WUWT post of interest in suggestions and Tim or I will hit the ‘reblog’ button.
[…] Click here to read the full article _____________________________________________ […]
Hi ‘guys’
I really enjoyed the post by WILLIS at WUWT and was sorry to see the falling out of some of the members
I went back today to finish reading that post and noticed Anthony had closed the thread and said he had banned discussion on planetary cycles and would no longer support the discussion on his blog.
Probably my first visit to WUWT to follow a topic anyway and l was amazed at the lack of moderation when the nastiness started
Quite a shame l thought..that AW has rubbed the planets off his list of topics
This must be one of the only blogs left ( tallbloke)to discuss planetary forcing
May l introduce myself
My name is ‘crikey’ and l have an interest in studying climate cycles
I have Bachelor level in science somewhat rusty
I have some knowledge up my sleeve from 2 yrs of delving
and have read widely into climate cycles
I enjoy reading all cycle researchers findings.
I am an AGW skeptic .
and believe in the forecast for global cooling for future forecast.
I admire the mathematical analysis on this blog but l am not up to par with your level at all.
I do though understand the concepts
I hope that l can contribute constructively
May l ask a request a post topic in the future
How does each layer of the earths stratosphere and troposphere etc react to a ‘solar flare up’?
In particular to the MARSHMALLOW EFFECT
I believe astronauts have observed the marshmallow effect during solar flare ups’ l think the thermosphere
The energy imparted to this layer must be massive to cause this expansion
I was thinking ideal gas laws PV = nrT
Pamela gray said she wanted an energy forcing to explain the solar . well this marsmallow effect is a big one
How and where is this energy dissipated and what are the implications for the lower atmospheric layers?
Unfortunately ‘guys’ l think the AGW leaders are closing down discussion on major forums and blogs
My home forum weatherzone has closed shop on climate discussion and now WUWT has closed planet discussion
You need a connection with the media to relay your findings to the public
Excellent TB.
This is going to save time.
Arguing on blogs steals time from data exploration.
– – –
list of the 3 types of people practicing CORRUPT stat inference
Instead of banning topics, Anthony Watts would be better off moderating those who wreck discussion of them by killing the conversation with false accusations like Leif Svalgaard, and with vicious invective, like Willis Eschenbach does.
They have both been banned from this blog for their unreasonable and unpleasant behaviour.
The old British name for a scatter gun is a Blunderbuss. Seems appropriate somehow.
Paul Vaughan says:
August 3, 2013 at 2:11 pm (Edit)
TB: no quibble there — inventing the sunspot integral and comparing it to other variables = 2 quite different things
Paul, thanks for this acknowledgement. The breakthrough came when I realised that rather than simply integrating the sunspot number, it needed to be a cumulative count departing from the Sunspot number equivalent to the solar forcing value at which the oceans neither gain nor lose energy. It so happened that when I calculated this empirically, I found it was the same value as the average Sunspot number over the entire period of record from 1749: ~40SSN
Now: I just wonder if you still think the 1940s “bump” needs shaving?
If you look at the graphic I made back in 2009, you’ll notice that above the SST time series, I noted the periods during which El nino and La nina were dominant. As you can see in comparing the curve of the Sunpot integral and the SST, the SST dips below the Solar integral around the turn of the C20th, and climbs above it in the 1920-1945 period.
Assuming the integral is a reasonable proxy for ocean heat content, my conclusion is that some kind of 1940’s ‘hump’ likely did occur, similar to the SST rise to when the 2010 El nino spiked the global and sea surface temperature. Perhaps El nino dominated phases acclelerate to a climax, rather than being a nice sinusoidal progression. ‘Saw-tooth’ behaviour seems fairly common in many natural phenomena. I think the thing to understand here is that the peak of the rise in SST comes some years after the point where average Sunspot number drops below 40SSN and the ocean starts releasing energy instead of gaining it.
This is why I’m very sceptical of adjustments to the ARGO record and the allegedly rising deep ocean temperatures. The PI, Josh Willis agreed there had been a ‘slight cooling’ since 2003 in an interview in 2007. Craig Loehle found it was still declining to late 2009. Outgoing longwave radiation was rising, incoming solar declining – this means the energy balance had gone negative.
That’s fatal to global warming theory and is the reason Trenberth famously said “the data are surely wrong.”
That’s when the ‘adjustment’ of the ARGO data started in earnest, and the ‘missing heat must be in the deep ocean’ meme started being pushed.
“The breakthrough came when I realised that rather than simply integrating the sunspot number, it needed to be a cumulative count departing from the Sunspot number equivalent to the solar forcing value at which the oceans neither gain nor lose energy. It so happened that when I calculated this empirically, I found it was the same value as the average Sunspot number over the entire period of record from 1749.”
Seems eminently reasonable.
“I know that most men, including those at ease with problems of the greatest complexity, can seldom accept even the simplest and most obvious truth if it be such as would oblige them to admit the falsity of conclusions which they have delighted in explaining to colleagues, which they have proudly taught to others, and which they have woven, thread by thread, into the fabric of their lives.”
― Leo Tolstoy
TB – the 1940’s are famously known for Boogie Woogie and Nazi bombs and artillery fire. Either could be responsible for silting up the atmosphere, but my money’s with the Nazis and the global military/industrial response.
The HUMP of the 1940’s is noted on this global temperature time series posted below against the AMO cycle
Of interest is the inflection point in 1943 and in fact all the inflection points
It looks like a switch mechanism. On/off…up/down …flip/flop…step up/step down..
How can you reconcile this switch like mechanism with solar system dynamics?
What celestial event happened in1943 to set of the switch?
Surly bond who constructs the temp graph also does other stuff
He said he can nominate the exact date of the switch?? in his analysis
Here is the AMO ‘sine wave’ below matching the inflection points of the global temperature shifts
which the ‘sine wave’ doesn’t show
this one is better
constructed from forum discussion
http://forum.netweather.tv/topic/76447-natural-climate-cycles-discussion/page-3?hl= natural variation
Hi Crikey: Lots of possibilities for the celestial origin of 60 year cycles, though it should be noted that in the longer term they seem to vary from around 60 year to around 90 year. Both those periods are subharmonics of the ~179 year Jose cycle. 1/3 and 1/2. Also worth noting are the 45 years cycles OR 1/4 of ~179 , Which are evident in the beach ridge formations found in Siberia and Canada on land rising following the melting of the ice sheets of the last glaciation.
Have a read of the new thread I posted this morning on Ian Wilson’s findings, that might help.
While I am in no way well enough qualified to follow the deeper technicalities here, I am very interested in the outcomes, which I feel are very enlightening and at the same time strike an intuitive chord.
I would like to put on record that I have also been intensely disappointed and irritated by the embargoes on certain topics and the emotionally charged negative attitudes, especially by the two resident bulldogs, to same at the-site-that-shall-not-be-named.
Thank you TB for providing an alternative forum where open mindedness and civility still rule.
GabrielHBay (August 5, 2013 at 12:30 pm)
“the-site-that-shall-not-be-named”
Classic
: ]
[…] Per info, su Tallbloke, che pure ha ospitato una discussione sull’ultimo lavoro di Nicola Scafetta, c’è un’altra replica interessante. […]
Solar-Terrestrial-Climate 101

Hi Paul, I was wondering how the solar cycle deceleration curve is calculated on your Solar-Terrestrial-Climate 101 plot.
Here is a good reference . I have bookmarked for a read tomorrow.
Out of time tonight unfortunately.. It is 11pm in Melbourne Australia
http://www.solarchords.tps1.com.au/solar-chord-science/3/sunspot-production-part-3–velocity-rules/33745/
They have a chat about deceleration
quote
…
..
“Now, if you look at the three years period from 1952 to 1955, you will see the opposite effect.
There is a rapid deceleration of the Sun but a small change in AM, the result is a large spike of sunspot production.
It was found that this behaviour completely matches the shape and amplitude of the sunspot graphs and convincingly shows that largely, the rate of change of V together with an influence of AM, determines sunspot production.”
@ crikey (August 9, 2013 at 2:04 pm)
Your enthusiasm for discussion is great!
I hope you will keep playing an important role stimulating minds.
One cautionary note:
Let’s be careful not to conflate different kinds of deceleration.
You’re commenting about deceleration in movement.
I’m commenting about FREQUENCY (of a cycle) deceleration — like if you change the speed on a fan.
I appreciate everyone’s patience as we strive to communicate carefully.
Geoff Sharp (August 9, 2013 at 8:18 am) asked:
“Hi Paul, I was wondering how the solar cycle deceleration curve is calculated on your Solar-Terrestrial-Climate 101 plot.”
–
short answer (included in the 4-page, 8-graph article I sent TB):
generalized wavelet tachometer
Important note for everyone & anyone sharing Geoff’s curiosity:
Above I outlined what I called “Step 1”.
Once you get that far (& unfortunately not before):
a) you’ll have only a few trivial steps left to arrive at SCD.
b) I’ll be able to efficiently outline those few remaining steps.
Given the amount of time I can — and can’t (due to hard constraints like sleep & work) — volunteer, this is the only viable avenue I see under current circumstances and for the foreseeable future.
It’s crucial that a handful of capable parties take the steps successfully. I underscore assertively to clowns from other (unnamed) sites that I’m not interested (tolerance completely expired) in political games. Necessity’s invention’s mother. Due to the constraints on my time & resources, I’m only concerning myself with the due appreciation and understanding of a small handful of sensible, capable parties, whoever they may prove to be. Under current circumstances, I can’t afford more.
– – –
Everyone sensible & capable:
This is important.
Make the effort.
Do it now.
Best Regards
Paul, email sent. Exciting stuff, a real step forward.
Thanks Paul
I am glad my posts have some value
I know a lot about earth climatic cycles but this solar system stuff is VERY new to me.
Having trouble keeping up
The graph ‘salvadore’ posted above looks EXACTLY the same as the IPO ( interdecadal pacific oscillation graph)
Have run out of time to post that but that would mean the IPO is governed by Hale and 60 yr cycle
I will try and post that tomorrow..
I have noted with my cycle correlation research. You must select the right data collection method
You MUST cherry pick
The 5 month mean SOI will pick up the 6 monthly switch on the SOI but
6 monthly data may give an excellent result?
other lengths of data collection is messy
There is a name or principle for this?
The data collection period needs to be in synch’ or close to the length of cycle..
or multiples of..?
Salvadores 11 yr sample picks up the 21 and 62 yr cycle
62 : 21 2
Thanks Paul, didn’t understand a word but that’s cool.
Oh GAWD!!!
I read Willis E’s supposed rebuttal of Dr scafettas work on WUWT in July 2013
That was a personal derogatory opinion piece with no science or credible rebuttal at all.
I got to the core of his deep seated cynical attitude toward cycle research and climate
He is a believer in the ‘chaos theory’
Not the scientific theory of chaos theory which incorporates fractals and bifurcations
or in lay mans terms cyclic order interspersed by periods of chaos as cycle shift phase or constructively or destructively interfere
Willis is a believer that all the climate is ‘complete chaos’ and there is no order at all
Haven’t seen that in the science journals??
I think Willis has a problem with the concept of quasi cycles
I got the impression that he believes If a cycle isn’t a constant then its not a cycle..
Willis says he has studied cycles in climate and there isn’t any..Just a chaotic mess.
I am very disappointed that Anthony Watts the owner at WUWTblog has allowed this very disrespectful tyrant malign Scafettas research..
Just because Wilis and Anthony can’t see the link between the solar system and the earths climate doesn’t make them correct.
I find Anthony’s treatment of SCAFETTA appalling and his banning of discussion on solar system links to climate
His stance on this issue is a bad as the AGW carbon dioxide 400ppm hypothesis .and climate gate and IPCC
Actually l think he has become a warmist to a degree anyway
Now we have cycle phobia maniacs obstructing the course of scientific discourse on WUWT
Anthony has the biggest climate blog in the world and has a duty to let the scientific method run freely without the power mongering and his personal opinions of himself and his mates hijacking the scientific method
He berates the IPCC for doing just this with claims of greenpeace running the IPCC power play
In his own backyard..
Guest bloggers with malicious intent rule the roost! at WUWT
Wake up Anthony…
Your personal views are blocking the road to transparent unfettered dialogue
I think that’s what Jones and mann et al did by controlling the Climate journals and peer review in the climate gate emails
I see you as no different..
Ensuring Scafetta gets no ‘air play’ in the WUWT blogosphere. and insinuating he and others that study planetary connections to climate are charlitans
Your personal science opinions of yourself and friends controlling your blog
Shameful conduct..
and hypocrisy….
I am personally offended as a cycle researcher..
.
I have Scafetta’s reply to Willis ready to roll. Just awaiting some additional info.
@ Geoff Sharp & Anyone Else
Let me know when you’ve reproduced Donner & Thiel’s (2007) Figure 4.
You may find this interesting,
Who is Willis Eschenbach?
http://www.populartechnology.net/2013/10/who-is-willis-eschenbach.html
As of 2012 Mr. Eschenbach has been employed as a House Carpenter.
He is not a “computer modeler”, he is not an “engineer” and he is certainly not a “scientist” (despite all ridiculous claims to the contrary).
“A final question, one asked on Judith Curry’s blog a year ago by a real scientist, Willis Eschenbach…”
Willis seems to have blocked my most recent comment on the WUWT blog. He doesn’t even take kindly to friends pointing out his errors. I should have guessed that he’d shuttered his mind when his previous response to a comment on mine was to use the term “my friend”.
He’s just left a steaming heap on his own doormat.
Bernd: If you kept a copy, repost it here. We run a refuge for censored WUWT comments, just as they are for the occasional one from here. Just this morning I removed one from PopTart, Trolltech, or whatever his name is.
Re: tallbloke (Jan 23 13:36), sorry, not that one. My comment was (deliberately) extremely terse but about 100 words long. Tried to address his classification of the parameters as “tuneables” and that his suggestion to instead use a Fourier transform would provide no insight into physical parameters.
It’s been a “busy” day with evacuation due to a bushfire nearby. I had 3 things on the go when the evac alerts came through on the phones.. Turns out that the severity of the alert was probably “precautionary”. If evacuees were relying on official advice, they’d still be elsewhere. I’ve been back for 5 hours. Damped down the yard, roof, gutters, etc just in case the fire explodes again overnight and sends embers this way.
So I had something better to do.
Pretty dry around Perth then. End of a long hot summer? Looks like spring was quite wet on the BOM site
Summer finally catching up. It was cool until Christmas. Now the end of a hot stretch.
Fires are absolutely normal, essential for native plant seeding and germination cycles; and not at all related to hot days; just wet season growth (of which there has been a lot in the past year) and the inevitable drying of it when the rains stop.
Restrictions on firefighters and fuel reduction burns add to the actual danger. Fuel reduction burns during the cold, damp months are used to eliminate floor litter. When I came to Australia in the late 1960’s, winter burnoffs were done frequently and over wide areas. This meant that there would only be enough fuel for inevitable bush fires from a few years’ growth.
But the population has grown and people object to the smell of smoke from the burnoffs in winter. Cognitive dissonance.
There’s another month of summer to go.
At WUWT:
Willis has a mental block about conduction and convection involving non-radiative gases being the primary cause of the mass induced greenhouse effect and has ignored my specific and simple questions on that issue.
Leif has a mental block about the likelihood that solar effects other than simple changes in TSI are affecting the global air circulation.
Bob Tisdale has a mental block about ENSO being able to change the balance between El Nino and La Nina events over centuries as a result of top down solar effects on the global air circulation and thus cloudiness.
R G Brown(and Willis) has a mental block about the adiabatic process convecting heat energy downward on the descent phase by converting PE to KE.
Anthony himself has a mental block regarding the possibility that something about the interactions between the sun and its planets goes on to affect internal solar behaviour which in turn affects the global air circulation on Earth.
Any attempts to discuss such matters start with condescension and then move on to abuse and sometimes censorship or thread closure.
Meanwhile the foul minded and foul mouthed aggression spewed out by Willis is tolerated and even encouraged.
The problem for Anthony is that the debate has now moved on from the discredited AGW hypothesis to, instead, discussion as to what really is going on within the climate system.
Therefore, unless Anthony moves on and allows wider discussion of the subjects that are anathema to him and his above contributors, WUWT may become a backwater fixated on the continuation of the battle against AGW theory that has already been won.