


David Archibald’s prediction for global average temperature 2014-2025
David Archibald’s post at Quadrant.org.au has stirred some interesting debate here at the talkshop. David predicts an imminent and steep drop in regional temperatures as a result of the slowdown in solar activity seen since the descent of solar cycle 23 in 2003. It’s not the first time he has made such predictions. As Nick Stokes pointed out in discussion, Archibald told the Australian senate committee in 2009 that temperature was about to go down at a scary 0.2C per annum. It didn’t happen. But David says it’s different this time, because a decade has passed since solar cycle 23 dropped towards a long minimum, followed by the weak cycle 24 we are currently in. The decadal lag is implied by David Evan’s new hypothesis which identifies a ‘notch filter’ which points to a cycle-long lag between changes in solar activity and the effect becoming visible in the terrestrial response. David goes on to predict that due to Penn and Livingstone’s prediction of a very low sunspot number in cycle 25, we are headed for drastic cooling.
There are several points on which I disagree with David’s analysis, and I’ll cover them below the break.
Contrary to David Evan’s hypothesis I think that the cause of a decadal lag between solar change and climate response is to be found in the oceans, not the Sun. Seawater has a high heat capacity, and it’s deep. This mass of global ocean damps the climate response to solar input. It also stores and releases energy on long timescales. This is why the latest explanations for the ‘pause’ in ‘global warming’ hypothesises that the ocean is eating excess energy. This is correct in my opinion, except it’s not excess energy from an alleged ‘enhanced greenhouse effect’ that it’s eating, it’s solar energy, which penetrates the ocean to a depth of 100m, whereas longwave radiation from the atmosphere can’t penetrate the ocean surface.
What the co2 driven global warming advocates don’t discuss is that if the ocean has started eating global warming since the trade winds changed during the negative phase of the ocean’s ~60 year multi-decadal cycles, they also emitted excess energy during their positive phase from 1975-2005. The implication is that the oceans are capable of storing energy on long timescales, and releasing it on long timescales too. And they store a lot of energy. The top two metres alone contain as much energy as the entire atmosphere above.
We know that the oceans keep the air temperature up over night as the release some of the energy the Sun poured into them during the day. We also know that there is a lag of a couple of months between the longest day of the year and the peak in surface air temperatures near coasts. This is thermal inertia and heat capacity at work. On longer timescales, we have recently confirmed that runs of El Nino events which release a lot of energy from the oceans are initiated on the falling side of the solar cycle, never on the upswing.
So we can go a stretch further and combine what we know. When solar activity falls, energy comes out of the ocean, not just over the period of the decline of a single 11 year solar cycle, but if the Sun stays low in activity terms, for many years. An integration of the sunspot number shows us that the ocean heat content rose all the way from 1934 to 2003. This is the real cause of ‘global warming’. A lot of excess energy is still retained in the upper ocean. We can expect the effect of a couple of low solar cycles to be softened by a proportion of that excess heat returning to space via the atmosphere warming it on the way.
In developing my understanding of the Earth’s systems, I developed a couple of very simple models to help me fathom the way the surface temperature stays fairly constant as the solar cycles wax and wane. Back in 2009, by analysing the data, I found that the global average sea surface temperature, the SST, stays fairly constant when the Sun is averaging around 40 sunspots per month. By calculating the running total departing from this figure in a simple integration I found that combined with the ~60 oceanic cycles (also solar influenced), I could reproduce the temperature history of the last 150 years quite accurately. By adding in a nominal forcing for co2 (or an allowance for the infamous ‘adjustments’ to the data), I was able to get a match to monthly data which has a Pearson R^2 value of 0.9.
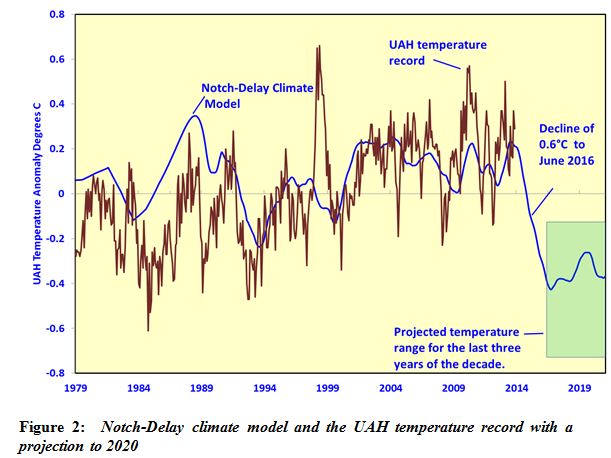
By using our planetary technique to predict future solar activity I was then able to make a prediction based on the ocean response to falling solar activity, and here’s the result:
As you can see, by including the thermal inertia of the oceans, and accounting for the ongoing ~60 oceanic cycles, the drop in gllobal temperature is nothing like as severe or sudden as David Archibald predicts. But what about his regional and agricultural predictions?
History tells us that when solar activity drops to very low levels, we can get strong swings in temperatures in the temperature latitudes of the northern hemisphere due to ‘loopiness’ in the jetstream dragging cold arctic air in to our weather systems. This may adversely affect growing season lengths and crop damage due to hail and frosts, particularly in the middle of large continents away from coasts. My prediction is that we are headed for weather similar to the early 1970’s, and if the solar minimum brings more than a couple of low cycles, it’ll be woolly trousers like my Grandfather wore in his youth in 1905 that we need.
But this brings me to my other point of disagreement with David Archibald. Even if Livingstone and Penn are right about the sunspot number dropping as low as 7SSN during cycle 25, this doesn’t necessarily mean that the electromagnetic flus from the Sun will be as low as during the long minimum between cycles 23 and 24. The relationship between F10.7 flux and sunspot number might change.
However, it seems likely that the amounts of short UV wavelengths will be low, and that might spell trouble for agriculture for other reasons than low temperatures. UV kills bacteria and fungi, and a lack of UV allows bacteria and fungi to flourish. Crop disease may become more of an issue, and disease happens in very non-linear ways.
So although I disagree with David Archibald’s temperature analysis, we should nonetheless pay attention to his concerns over agriculture. Storage silos are needed, as we currently operate a ‘just in time’ food network worldwide. The ancient pharoahs of Egypt had the sense to have sufficient storage to maintain grain stocks able to ride out multi-year drought. As Ghandi said with his last words
Don’t waste the food

Good summary with which I agree.
The process of turnaround after the long period of slow and irregular warming since the LIA is also going to be slow and irregular due to the thermal capacity of the oceans and the 60 year Pacific Multidecadal Oscillation.
However, the ‘loopiness’ of the jets being directly related to the level of solar activity (due to solar effects within the polar vortices), I expect to see lots of climate variability in the middle latitudes.
Still, the real world outcome could yet be somewhere between the expectations of tallbloke and David Archibald.
The ocean system is like a capacitor, low esr and high shunt impedance with a time constant greater than 11yrs IMO (probably less than 60). The 11 yr cycle is integrated causing a slow rise, filtering/masking the 11yr cycle, but the discharge even slower (higher shunt impedance). The ramp rate is similar to ramp rates in the gisp2 core implying a max ramp rate delaying equilibrium (equilibrium is not instantaneous, except in Lief’s world). The charge pump is the PDO, pulsing the AMO. Probably multiple time constants really with the AMOC involved.
But a slower discharge than charge…hence the higher ramp rate into interglacial vs the slower decent into glacial
The main evidence in favor of the Evans/Archibald hypothesis is what appeared to happen during the Dalton Minimum.
By general agreement, the Dalton Minimum started in 1790. Now look what happened to global temperatures, at least according to BEST, starting 11 YEARS later in 1801 :
http://berkeleyearth.lbl.gov/auto/Regional/TAVG/Text/global-land-TAVG-Trend.txt
Even allowing for the paucity of the data, that’s possible evidence for some fairly dramatic cooling between 1801 and 1815.
(As an aside., I attempted to present this to the 3 stooges at WUWT on their recent “Maunder and Dalton minimum” thread, but my efforts were pointedly ignored.)
My personal opinion on this is let’s wait and see, but if the solar scientists are right, and a Dalton-type solar minimum is on the cards, the resulting temperature response of the Earth should, at least in a sane world, help resolve the argument one way or the other.
One item to remember is this period of below normal solar activity started in 2005 so the accumulation factor is coming into play.
Secondly it is not just solar activity within itself but the secondary effects associated with solar variability which I feel are extremely hard to predict as far as how strongly (to what degree)they may change and thus effect the climate in response to long prolonged minimum solar activity.
I strongly suspect the degree of magnitude change of the prolonged minimum solar activity combined with the duration of time of the prolonged minimum solar activity is going to have a great impact as to how EFFECTIVE the associated secondary effects associated with prolonged minimal solar activity may have on the climate. An example would be an increased in volcanic activity.To make it more complicated could thresholds come about? An example would be a changing atmospheric circulation pattern which may promote more snow cover/cloud cover and thus increase the earth’s albedo. How will the initial state of the climate play into it? An example of this would be the great amounts of excess Antarctica Sea Ice the globe has presently and how this might play out going forward under a very long period of prolonged minimum solar activity. Will climatic outcomes unknown come out of this?
Then one has to consider where the earth is in respect to Milankovitch Cycles (favorable )and how the earth’s magnetic field may enhance or moderate solar activity.
Given all of that I think at best only general trends in the climate can be forecasted going forward. I am confident enough to say in response to prolonged minimum solar activity going forward the temperature trend for the globe as a whole will be down. The question is how far down /how rapid will the decline be? I really do not have the answer because there are just to many UNKNOWNS. Further when you have unknowns in a system like the climate which is non linear, random and chaotic expect surprises.
I think climatic /solar conditions now are very similar to the period 1275 ad- 1325 ad in that prolonged solar minimum conditions followed a long period of high solar activity(the medieval warm period) and nevertheless despite this long period of high solar activity (warm oceans?) this did not delay the abrupt unset of Little Ice Age conditions.
It came out quite fast. That is my understanding from what I have read.
From iceagenow.com web-site and this is a big factor which will respond to prolonged solar minimum activity like it always has in the past. The question is by how much and where.
As volcanic activity picks up, I’m expecting big-time cooling.
This does not include the volcanoes that are now showing “unrest.”
It also does not include the hundreds of thousands of underwater volcanoes that no one is even monitoring.
• Stromboli (Eolian Islands, Italy)
• Kilauea (Hawai’i)
• Bagana (Bougainville Island, Papua New Guinea)
• Manam (Papua New Guinea)
• Yasur (Tanna Island, Vanuatu)
• Ambrym (Vanuatu)
• Colima (Western Mexico)
• Santa María / Santiaguito (Guatemala)
• Fuego (Guatemala)
• Ol Doinyo Lengai (Tanzania)
• Erta Ale (Ethiopia)
• Barren Island (Indian Ocean)
• Nyiragongo (DRCongo)
• Sinabung (Sumatra, Indonesia)
• Dukono (Halmahera, Indonesia)
• Ibu (Halmahera, Indonesia)
• Lokon-Empung (North Sulawesi, Indonesia)
• Sangeang Api (Indonesia)
• Semeru (East Java, Indonesia)
• Batu Tara (Sunda Islands, Indonesia)
• Slamet (Central Java, Indonesia)
• Marapi (Western Sumatra, Indonesia)
• Ubinas (Peru)
• Reventador (Ecuador)
• Shiveluch (Kamchatka)
• Karymsky (Kamchatka)
• Zhupanovsky (Kamchatka, Russia)
• Sakurajima (Kyushu, Japan)
• Suwanose-jima (Ryukyu Islands, Japan)
• Nishino-shima (Volcano Islands, Japan)
• Erebus (Antarctica)
See interactive map:
http://www.volcanodiscovery
Click to access Miller_2012_LIA.pdf
Rog, I have a question. How much of a factor do you think volcanic activity played in the Little Ice Age if at all? Do you think there is a solar/volcanic connection?
This is a point(below) which has to be taken into consideration. Rog, do you have any thoughts about how this played out in determining the start of the Little Ice Age? I am interested about your thoughts because today seems similar in ways to then.
An integration of the sunspot number shows us that the ocean heat content rose all the way from 1934 to 2003. This is the real cause of ‘global warming’. A lot of excess energy is still retained in the upper ocean. We can expect the effect of a couple of low solar cycles to be softened by a proportion of that excess heat returning to space via the atmosphere warming it on the way.
The oceans will backup the global average temperature, the extremes will be more interesting. Weather models are suggesting another negative NAO for this autumn-winter. Trend?
T.B mentions food storage, it appears Europe still has some of its Interventions stores, others were sold off. The grain mountains of the 1980s did not really exist to the level reported, much of the exaggerations were due to subsidy fraud. Ukraine is the bread basket of Europe & the grain traders watch it closely, however it is far enough from the Oceans to suffer quickly in the future.
T.B has shown his prediction for the Earth. He has also mentioned else where that the next solar cycle could be a ” ghost cycle “. If he hasn’t already, maybe he could expand on the description?
edwardt said “But a slower discharge than charge…hence the higher ramp rate into interglacial vs the slower decent into glacial”
Ok, I’m confused. A quick exit from a glaciation surely means a quick discharge of energy from the oceans to the atmosphere, and the entry into glaciation would be the oceans slowly charging or soaking up the energy. The implication being that some external forcing is involved to account for the change in behaviour ?
What have I misunderstood ?
Got any visual material to go with your electrical analogy ?
J Martin I have the same questions.
“As Nick Stokes pointed out in discussion, Archibald told the Australian senate committee in 2009 that temperature was about to go down at a scary 0.2C per annum. It didn’t happen.”
Has it not happened or are we being confused by the temp data fiddling??
Re Archibald’s 0.2C per annum, surely it must have beena slip of the tongue, he must have meant t say per decde. As a 20C drop is twice as low as the lowest extreme of the last glaciation.
all of the above avoids the role of heavy meteor activity in the little ice age, and an above average volcanic activity. In effect, dust in the upper atmosphere also contributed to the little ice age, and the 13th/14th century events. The low solar activity you might find is overrated and Leif, in that sense, is right. He would not of course endorse dust in the atmosphere as contributary to global cooling. The Koreans actually recorded everything going on in the sky during the early middle ages and heavy meteor activity was a factor.
What is appealing to me for the immediate future are more climate extremes and slightly colder temperatures at the start of all of this.
More climate extremes due to low solar causing a more meridional atmospheric circulation. Ocean Heat Content holding back a temperature fall somewhat as Rog pointed out .
The unknowns are Volcanic Activity and the Antarctic Sea Ice Dynamic. .
Salvatore: The last two volcanos were immediately followed by El nino. That’s the ocean counteracting the dust veil blocking sunlight. Followed by La Nina type cool spell while ocean recharges once the dust has settled. There is a Solar activity – volcanic activity link, but how much effect it has on global temperature in the longer term I don’t know.
JM: “Archibald’s 0.2C per annum, surely it must have been a slip of the tongue”
I don’t think so. Look at his new prediction. -0.6C by end of 2016
I don’t know either.Rog ,do you think Antarctic Sea Ice Expansion if it should continue could have a climate impact?
The low solar activity you might find is overrated and Leif, in that sense, is right. He would not of course endorse dust in the atmosphere as contributary to global cooling.
My response
When it comes to climate/solar connections Leif has no clue.
The solar /climate connection is very clear.
[…] Does a steep drop in solar activity imply an equally steep drop in … […]
Maybe a steep drop in solar activity implies a steep rise in climate extremes for a start then cooler or colder temperatures.
Not sure if I’m making sense from an ocean and atmosphere relationship, but I’ll post some circuit sims tonight to illustrate what I mean by the time constant behavior and the slower disharge vs charging rate. Regardless, the wild card is the AMO ready to tank at the same time the sun is. New territory maybe someone can match that up with old records?
Salvatore Del Prete says: “….Do you think there is a solar/volcanic connection?”
Connections have been found:
Possible correlation between solar and volcanic activity in a long-term scale (Full paper)
adsabs(DOT)harvard.edu/full/2003ESASP.535..393S
The Role of Explosive Volcanism During the Cool Maunder Minimum
adsabs(DOT)harvard.edu/abs/2002AGUFMPP61A0298A
Sun / dust correlations and volcanic interference (includes list of other papers)
(wwwDOT)mendeley.com/research/sun-dust-correlations-volcanic-interference/
Possible correlation between solar and volcanic activity in a long-term scale
Authors: Střeštik, J.
Another good paper (in full not just abstract):
Study of Dust in Ice Cores Shows Volcanic Eruptions Interfere with the Effect of Sunspots on Global Climate
(wwwDOT)buffalo.edu/news/releases/2002/06/5735.html
J Martin says: @ June 26, 2014 at 10:43 pm
“….Ok, I’m confused. A quick exit from a glaciation surely means a quick discharge of energy from the oceans to the atmosphere, and the entry into glaciation would be the oceans slowly charging or soaking up the energy. ….”
The transition from the Wisconsin Ice age to the Holocene happened in three years (some say one year)
The transitions from an interglacial to glaciation takes decades 50 to 150 years or more. Only problem is some think the Little Ice Age marked the start of the transition. It was at 1/2 precession cycle and the Modern Solar Maximum pulled us out.
Remember we are getting progressively cooler with each ‘warm period’ Solar energy reached a summer maximum (9% higher than at present) ~11 ka ago and has been decreasing since then, primarily in response to the precession of the equinoxes. The extra energy elevated early Holocene summer temperatures throughout the Arctic 1-3°C above 20th century averages, enough to completely melt many small glaciers throughout the Arctic, although the Greenland Ice Sheet was only slightly smaller than at present.
Also Dr. Joan Feynman et al said: “As of this writing it appears that the average aa value of 1997 will be even lower (~16 nT) than that of 1996. Such leveling off or decline of the long-term solar component of climate change will help to disentangle its effects from that of anthropogenic greenhouse warming.” So it was Cycle 23 and not Cycle 24 that marked the start of the decline in solar activity.
The paper is 4 pages long. Here is the relevant passage.
Finally warm pulses were the norm at the end of interglacials and if you use the best analog to the Holocene MIS-11 just before glaciation there were two thermal pulses . The Modern Warm Period, less warm then the the Medieval Warm Period, marks the second thermal pulse.
MIS-5e, the Eemian, went down into the Wisconsin glacial after at least 2 strong thermal pulses right at its very end. The Eemian went thermally ballistic, not once, but twice, during its last thousand years or so.
Salvatore,
I think one of the factors you maybe leaving out is albedo. The Earthshine Project showed an inflection point at the same time as the 1997/1998 Super El Nino. graph
On top of that you have the sea ice growing in the Antarctic AND an increase in the Northern Hemisphere snow cover.
http://stevengoddard.wordpress.com/2014/04/01/northern-hemisphere-winter-snow-cover-increasing-dramatically-since-1998/
October: (wwwDOT)ncdc.noaa.gov/sotc/service/global/snowcover-nhland/201310.gif
November: (wwwDOT)ncdc.noaa.gov/sotc/service/global/snowcover-nhland/201311.gif
December: (wwwDOT)ncdc.noaa.gov/sotc/service/global/snowcover-nhland/201312.gif
January: (wwwDOT)ncdc.noaa.gov/sotc/service/global/snowcover-nhland/201401.gif
February: (wwwDOT)ncdc.noaa.gov/sotc/service/global/snowcover-nhland/201402.gif
Here are some circuit sims to illustrate what I meant by time constant.
Plot1 is Lief’s reality of an instantaneous response to solar variation (without any amplitude drift over time). Pretend the cycle is the 11yr solar cycle. Instantaneous response. Only exists in Lief’s imagination. Add slower cycles and it would just track.
http://s852.photobucket.com/user/etregembo/media/FastTimeConstant_zpsf9d0c38d.gif.html
Plot2 is same cycle but with a time constant greater than 11yrs (keep pretending it’s the 11yr cycle). The 11yr cycle amplitude is too low to detect in the response, though it is charging up to some new equilibrium (system can’t keep up). Note how the first 150uS it reaches a max amplitude but doesn’t go back to the minimum amplitude within the next 150uS.
http://s852.photobucket.com/user/etregembo/media/SlowTimeConstant_zps67fe1276.gif.html
Plot3 adds a 2nd cycle ~5.5 times slower (the 60yr oceanic cycle or other relative to the 11yr cycle). Reminds me of Hadcrut, no 11yr cycle (integrated), 30 yr ramp up, slowly discharge down, ramp up again etc. When the input is turned off (the SUN) it slowly discharges, not as much as it charged up over the same time interval. A 50% duty cycle causes increases until equilibrium.
http://s852.photobucket.com/user/etregembo/media/SlowTimeConstant_Add_5x_Cycle_zpsbe7a5faa.gif.html
I also did a parallel LC and came up with a combo that actually produced an equivalent to a 60yr ringing (lasted 2-3 cycles) when pumped with an equivalent 11yr cycle (which was still filtered). Some instability could explain the 60y cycle, though the source of the PDO driver would be nice to know.
Not sure whether the capacitor analogy is applicable (similar I think though a few variations would also be similar) but I think the time constant could be applicable, Wish I had some understanding of fluid dynamics. I feel the ocean stores heat, it isn’t all applied instantaneously and can’t warm fast enough to keep up, and may come out with subsequent AMO cycles when warming, and more may be stored deeper that comes out on longer time cycles depending upon fluid movement around the globe, maybe slowing down the decent into the glacial as it rises from the ocean depths (CO2 stays elevated for a thousand years while temps drop when entering the glacial). The oceanic response to the recent low solar cycles will be interesting to watch. It could crash or it could resist.
If you don’t understand the ocean you don’t understand jack on a water planet, and we ain’t got jack.
[Mode note] Sorry your comment got auto-canned. Too many links. – Rog
Salvatore,
On the subject of volcanoes, from Ice Age Now: Wow! Look at how many volcanoes are erupting right now!
one of the commenters mentioned:
Salvatore Del Prete says: “Maybe a steep drop in solar activity implies a steep rise in climate extremes for a start then cooler or colder temperatures.”
That certainly looks like what has been happening. Here in NC instead of the winds and storms coming from the west as has been the norm, they come from the north, the south the east and sometimes even circle around!
Steven Wilde’s loopy jets in action.
Salvatore Del Prete says:
I don’t know either.Rog ,do you think Antarctic Sea Ice Expansion if it should continue could have a climate impact?
It will have an impact on ocean currents in the Atlantic (cooling).
http://earth.nullschool.net/#current/ocean/surface/currents/overlay=sea_surface_temp_anomaly/orthographic=-5.28,-30.03,481
So it looks flow of air over the Atlantic.
http://earth.nullschool.net/#current/wind/surface/level/orthographic=-5.28,-30.03,481
The increase in ozone (temperature?) In the upper zone of the ozone above the equator, causes a decrease in solar energy below.
Winter in the southern hemisphere has just begun. At end of July, you can expect a stronger anomaly (the polar vortex), as in the previous year.
Ozone is a powerful greenhouse gas and absorbs not only UV but also the thermal radiation.
It’s the wind that tears apart ocean stratification with vertical heat mixing:

We’ve all had the sunspot integral on file ever since the first time we downloaded the sunspot record, but I couldn’t buy in fully before I became aware of the solar-terrestrial-weave, which proves the role of insolation-driven equator-pole spatial gradients in mixing.
Each time the fan speed changes, the mixing has to equilibrate. Both the integral and the MD (multidecadal) wave are multivariate. It’s not just about surface temperatures. It’s about ocean-atmosphere coupling more generally.
In aggregate it’s simple.
Does anyone know the history????
How on Earth did the idea ever take root (!!!!!???) that a pot of water instantly matches the heat to which the burner turns????
It’s both fascinating & profound that such corruption could occur and be sustained for so long without being corrected.
I hope someone has some deep (& concise) insights to share about the history.
Current Jetstream in the southern hemisphere.
http://earth.nullschool.net/#current/wind/isobaric/250hPa/orthographic=-221.87,-91.79,318
Just posting again from the post the other day. 😉
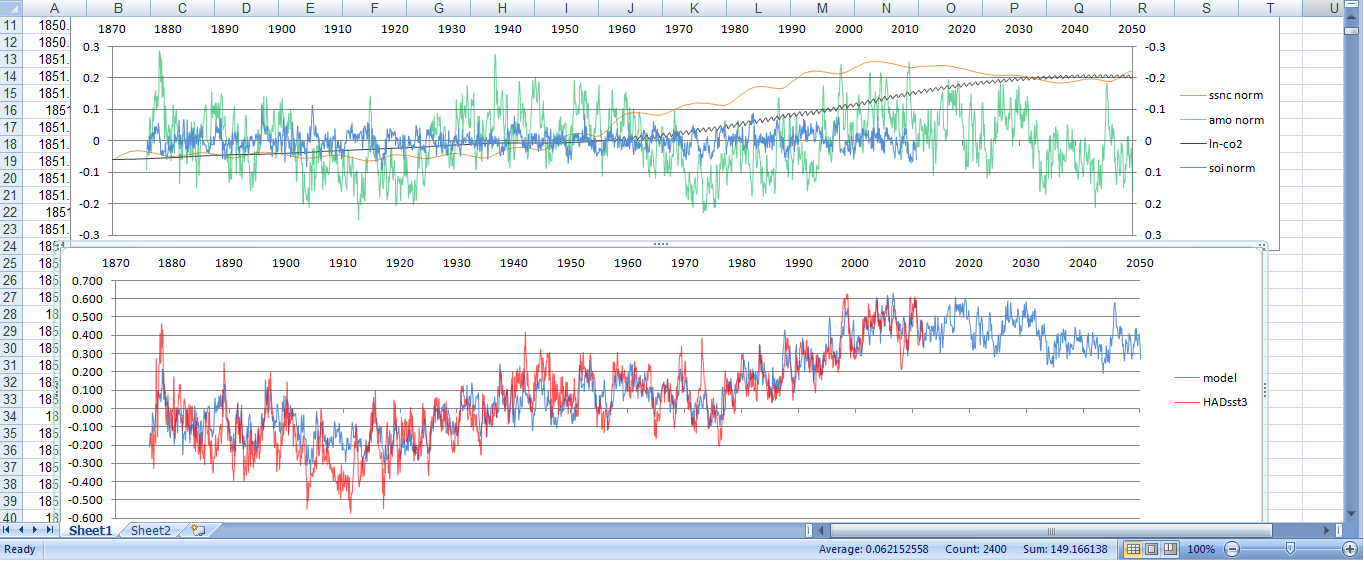
Heres’ a high level ridiculously simple climate model, but it works quite well considering! Includes solar activity, oceans(AMO & PDO) and CO2, all with the same weight.
Hindcast testing against HadCRUT3:

Link to the model:
http://woodfortrees.org/plot/sidc-ssn/mean:132/scale:0.006/from:1900/offset:-0.1/plot/jisao-pdo/mean:150/scale:0.3/plot/esrl-amo/mean:150/from:1900/plot/esrl-co2/scale:0.003/mean:12/offset:-0.9
The aggregated total for all parameters:

Do I spot a 0.2deg decline by any chance?
Now if the AMO decides to reverse we could at least briefly have another -0.3 deg.
How much will the oceans damp night minima in the middle of the prairies? Taking sea temp as proxy for agriculture seems odd.
Paul Vaughan says:
How on Earth did the idea ever take root (!!!!!???) that a pot of water instantly matches the heat to which the burner turns????…..
GRAPH: air and sand temperature response to solar eclipse
This surface response was taken as the entire response without considering the amount of H2O in the oceans and mixing. A shallow pool of water especially with a dark bottom will heat up quite quickly and to a relatively high temperature. My 100 gallon stock tanks (dark gray) get to the temperature of bathwater.
Before taking this analysis at face value perhaps you guys should take a look at 2 Graphs that Anthony Watts has posted on his thread called “On ‘denying’ Hockey Sticks, USHCN data, and all that – part 2” where he is discussing Steven Goddard’s work on temperature data manipulation by US authorities.
Graphs 7 & 9 are supposedly of the RAW Global and US data resepctively and bear absolutley no relationship with the graphs used in this and Jo Nova’s analysis. They both show upward Step Changes in Temperatures is the Global and US data.
The Global data shows 2 Climate Shifts of 1.5 Degrees over a year or two around 1950 and 1990.
The US data shows 4 Climate Shifts of 0.5 Degrees approximately 10/11 years apart.
Nobody else appears to be interested in those graphs and have glossed over them.
Note that the data is Land only Temps.
I’m tending to agree with Salvatore’s assessment of the situation here, i.e.,
“I strongly suspect the degree of magnitude change of the prolonged minimum solar activity combined with the duration of time of the prolonged minimum solar activity is going to have a great impact as to how EFFECTIVE the associated secondary effects associated with prolonged minimal solar activity may have on the climate. An example would be an increased in volcanic activity.To make it more complicated could thresholds come about? An example would be a changing atmospheric circulation pattern which may promote more snow cover/cloud cover and thus increase the earth’s albedo. How will the initial state of the climate play into it? An example of this would be the great amounts of excess Antarctica Sea Ice the globe has presently and how this might play out going forward under a very long period of prolonged minimum solar activity. Will climatic outcomes unknown come out of this?
Then one has to consider where the earth is in respect to Milankovitch Cycles (favorable )and how the earth’s magnetic field may enhance or moderate solar activity.
Given all of that I think at best only general trends in the climate can be forecasted going forward. I am confident enough to say in response to prolonged minimum solar activity going forward the temperature trend for the globe as a whole will be down. The question is how far down /how rapid will the decline be? I really do not have the answer because there are just to many UNKNOWNS. Further when you have unknowns in a system like the climate which is non linear, random and chaotic expect surprises.”
Backed up by the interesting links from Gail.
The magnitude, rapidity and duration of any decline in global temperatures will be dependent obviously upon the magnitude and duration of any decline in solar activity, but will also be dependent upon a whole host of secondary effects, volcanism important among them. It is also not precisely known how the major oceanic cycles (PDO, AMO) which govern the storage and release of heat are modulated by solar activity. It would be a treasure to have accurate info on ENSO and AMO cycles during the LIA, but alas, we can only guess. My feeling is that, during periods of low solar activity, La Ninas tend to dominate and the heat which is stored within the oceanic mass is inhibited in its release. Conversely, high solar activity allows stored heat to be released more effectively via the dominance of powerful El Ninos. This is of course a simplification and the real situation is likely to be a lot more complex. What we can say is that rapid temperature changes have occurred in the past and probably will occur in the future: cooling or warming. The Holocene appears to be a relatively benign period in this respect, but even here we have seen fairly rapid cooling/warming of a few degrees occurring over decadal timescales. I think we can also confidently say that any cooling trend associated with a downturn in solar activity will probably be more pronounced and possibly more rapid in Northern hemisphere mid-high latitudes. Beyond this, we cannot know for sure. I am eagerly awaiting the onset of autumn/winter this year. Summer itself is looking like it will comprehensively fail to live up to the met office’s prediction that there is a 25% chance it will be the ‘hottest ever’.
I noticed TB you have added an AGW component. Your future forecast is similar to Scafetta.
What does your forecast look like if you remove the modest AGW component?
I liked your observation
“I found that the global average sea surface temperature, the SST, stays fairly constant when the Sun is averaging around 40 sunspots per month.”
——————————————————
‘Edwardt ‘ says “Regardless, the wild card is the AMO ready to tank at the same time the sun is. New territory maybe someone can match that up with old records?”
Yes the AMO phase is on its downward phase ( as a phase of the ~66yr cycle)
I think reliable data for the AMO is only from the 1970’s .
We know how the AMO responds in phase to the ~66yr cycle
https://picasaweb.google.com/104698633266954768357/CYCLESAndCorrelations#5895605235664361634
.We are expecting or are curently entering the downward phase of the dVries( down phase ~100yr)
We are also entering a ~33yr period of the downward phase of the ~66yr cycle
Overlaying the Downward phase of both of these cycles.
-If the downward forcing of the ~66yr phase has had a mean decline of minus 0.59 deg c/century
source
https://picasaweb.google.com/104698633266954768357/CYCLESAndCorrelations#5895605235664361634
and
the Devries(200yr cycle) has an estimated downward phase of minus 0.4 deg c per century? speculative
(maunder minimum estimation)
source
http://www.giss.nasa.gov/research/news/20011206/
~1600-1700 down phase of DeVries
http://en.wikipedia.org/wiki/Solar_variation#mediaviewer/File:Carbon14_with_activity_labels.svg
If you superimpose /overlay the 2 cycles constructively you get a sum of a decline of 1 deg c/ century
That would take global temps down to the year 1910 levels by 2100.and global temps at 1970’s level at 2050 ( probably 2030, as the downward curve is often a step cliff like drop initially)
It is possible a steep decline could be tempered by the up-phase of the order~1500 yr cycle .
The danger is the effects to the Nth hemisphere Mid latitudes in particular where records show us a 2 deg C plus drop in temp with a steep De vries downturn. as discussed above
and history shows the devastation due to lack of preparation. We have plans for warming but not for cooling
——————————–
Let’s see how occurs to an increase in ozone in the vicinity of Australia.
Let’s see the latest model of Earth’s magnetic field.

Rog, when looking at your projected sea surface temperature from the model, from the bottom graph colored in blue, I would think the projected sea surface temperatures would be at least as low as it was between 1900-1910 as shown in red (HAD sst3 data) given the fact that this period of solar activity should be much lower and longer in duration then the solar activity that occurred from 1900-1910.
Granted solar activity prior to 1900 was not as strong as solar activity prior to this prolonged current solar minimum but I think the potential depth and length of this current prolonged solar minimum should with time be able to bring the sea surface temperatures to levels lower then the period 1900-1910 by say year 2025 ,if very low minimum solar conditions persist.
Can you tell me if you think this may be correct thinking or am I missing something when looking at your graphs? Thanks
Our aa-based inference of a fiat or declining secular component of solar irradiance contrasts with the results of a recent analysis of satellite-based irradiance measurements Willson [1997] who found an increase 0.036% for the 1996
of solar minimum relative to that of 1986.
My reply
Since then it has been shown that total solar irradiance can be in phase and in antiphase with solar activity depending on what wavelengths are involved.
Gail presented an article on this recently.
Salvatore,
I think one of the factors you maybe leaving out is albedo. The Earthshine Project showed an inflection point at the same time as the 1997/1998 Super El Nino
Gail I mentioned albedo in my earlier post .
It is one of the keys .
It is worth follow the current sunlight.
Table 1.Volcanoes of greater than or equal to VEI of 5 from 1650 to 2009. This list of large volcanic eruptions since 1650 was used as the baseline list for comparison against solar activity, i.e. periods of reduced sunspot count to determine any apparent associations. 5* = a class five VEI with potentially large date uncertainty, P* = plinian large class eruption, assumed >VEI 5. The study did not include activity associated with geological hot spots or caldera (super volcano) sites. Source: Smithsonian Institute.
Volcano Location Year VEI
1. Shiveluch Kamchatka Penninsula 1650 5
2. Long Island N.E. New Guinea 1660 6
3. Usu Hokkaido, Japan 1663 5
4. Shikotsu Hokkaido, Japan 1667 5
5. Gamkonora Halmahera, Indonesia 1673 5*
6. Tongkoko Sulawesi, Indonesia 1680 5*
7. Fuji Honshu, Japan 1707 5
8. Katla So. Iceland 1721 5*
9. Shikotsu Hokkaido, Japan 1739 5
10. Katla So.Iceland 1755 5
11. Pago New Britain 1800 P**
12. St.Helens Washington State, USA 1800 5
13. Tambora Lesser Sunda Islands,Indo. 1815 7
14. Galungung Java, Indonesia 1822 5
15. Cosiguina Nicaragua 1835 5
16. Shiveluch Kamchatka Penninsula 1854 5
17. Askja N.E.Iceland 1875 5
18. Krakatau Indonesia 1883 6
19. Okataina New Zealand 1886 5
20. Santa Maria Guatemala 1902 6
21. Lolobau New Britain 1905 P*
22. Ksudach Kamchatka Penninsula 1907 5
23. Novarupta Alaska Penninsula 1912 6
24. Azul, Cerro Chile 1932 5+
25. Kharimkotan Kuril Islands 1933 5
26. Bezimianny Kamchatka Peninsula 1956 5
27. Agung Lesser Sunda Islands, Indo. 1963 5
28. St. Helens Washington State, USA 1980 5
29. El Chichon Mexico 1982 5
30. Pinatubo Philippines 1991 6
31. Hudson, Cerro So. Chile 1991 5+
************************************************************************
Of the 31 eruptions documented since 1650 with a VEI greater than or equal to 5, a total of 25 occurred during a reduced period of sunspots if not a major reduction in sunspots or a solar hibernation, e.g. the Dalton or Maunder Minimums. This preliminary study showed 80.6% of the largest eruptions took place during extended solar activity minimums. Significantly, the following list of the eight largest volcanic eruptions globally (VEI>6) since 1650, shows all but one took place only during a solar hibernation, or significant reduction in solar activity as measured by sunspot count.
3
*************************************************************************************
Table 2.Volcanic eruptions that took place during major solar minimums and solar hibernations. This table establishes the strong relationship between the largest volcanic eruptions and solar activity lows on the order of the Centennial and Bi-Centennial Cycles defined by the RC Theory.
Volcano Location Year VEI Associated Solar Minimum
1. Long Island N .E. New Guinea 1660 6 Centennial: Maunder
2. Pago* New Britain 1800 P Bi-Centennial: Dalton
3. Tambora Lesser Sunda Islands 1815 7 Bi-Centennial: Dalton
Indonesia
4. Krakatau Indonesia 1883 6 Centennial: Year 1900
5. Santa Maria Guatemala 1902 6 Centennial: Year 1900
6. Lobobau New Britain 1905 P Centennial: Year 1900
7. Novarupta Alaska Peninsula 1907 6 Centennial: Year 1900
8. Pinatubo Philippines 1991
http://www.solen.info/solar/polarfields/polar.html
This looks much different this time then in the past. It looks like the N and S are in the same zone. ARE
Salvatore Del Prete says:
June 27, 2014 at 5:18 pm That is a Great find and they are ramping up their activity right now.
Was going to post on the polar field when blog traffic quietened down (things get lost fast). Very much baited breadth on what comes next.
Gail said ” Only problem is some think the Little Ice Age marked the start of the transition. It was at 1/2 precession cycle
If I have worked it out correctly then we won’t reach the half way point for obliquity for almost 1200 years.
” In addition, the angle between Earth’s rotational axis and the normal to the plane of its orbit (obliquity) oscillates between 22.1 and 24.5 degrees on a 41,000-year cycle. It is currently 23.44 degrees and decreasing.”
http://en.wikipedia.org/wiki/Milankovitch_cycles
Currently the angle is decreasing and so the northern hemisphere will get warmer winters and cooler summers, with the track of the sun moving north by about 15m (?) every year in the winter, but this would be the opposite way round in the southern hemisphere and so cannot be the cause of increasing sea ice in the Antarctic. Or have I got something wrong somewhere…
Hi TB! Good OP, but I have a few issues to discuss.
“Contrary to David Evan’s hypothesis I think that the cause of a decadal lag between solar change and climate response is to be found in the oceans, not the Sun.”
Well, insolation ‘must be’ the causative factor, but this is ‘filtered’ by the atmosphere, thus, ‘atmospheric filtering’ plays a part.
It then depends on the surface irradiated! Land surface returns a temp change at the surface (relative to albedo and moisture content) and ocean surface returns, perhaps, a ‘little’ temp change at the surface, but mostly water vapour injection into the atmosphere.
Already the ‘irradiated surfaces’ (land/ocean) have diverged WRT the aspect of their ‘reactance’ to the ‘irradiance from insolation’. A lot is going on in the upper atmosphere as Sol pulsates during its ~normal cycle which alters the atmospheric ‘filter’ that adjusts Sol’s output onto Earth’s surface, but I’ll not be drawn into this here. We’re at ocean depth to tropopause!
Okay. The cusp of ‘blue vis and UVa’ penetrates up to 1,000 metres into ‘pure water’ before its extinction. I can well accept your analogy for ‘seawater’, which contains contaminants, but I don’t see you explaining your ‘argument’ for the ‘co-relationship’ between the ‘temporal’ existence of these wavelengths and Sol’s active status for ‘land surface’ and ‘ocean surface’ (with the definitive logic that shows this). If you want to prove that the “climate response is to be found in the oceans, not the Sun” you’ll need to ‘demonstrate’ this.
Without this resolution, your entire post is nonsensical to me.
However, an explanation of the way that ‘latent heat’ is FINALLY released at altitude to radiate both towards the surface and TOA may help your site no end during your reply. 😉
Best regards, Ray Dart.
Could you post a link of where you got the earths magnetic field pic REN
There is no time stamp on that image you posted. Thanks
[…] https://tallbloke.wordpress.com/2014/06/26/does-a-steep-drop-in-solar-activity-imply-an-equally-steep… […]
new climatology animation:
ocean MLD = mixed layer depth

Amazing information about volcanoes Salvatore and GAIL. You have won me over.
I would love to plot your list of volcanoes Salvatore, superimposed on the DeVries cycle.
From what is being suggested you would expect to see more volcanoes on the downslope of the De Vries . What comes to mind is Vukcevics fast sun/slow sun findings.
The De Vries Down cycle is most likely the slow sun ( 100 yr phase ) which = 10 schwabbe cycles
1700 De Vries Min?
upslope ( fast sun)to
1800 De Vries Max?
downslope (slow sun)to
1900 De Vries Min ?
Upslope ( fast sun)to
2000 De Vries Max
downslope (slow sun)to
2100 De Vries Min
So slow sun 100 yr phase correlates with Increased Volcanic activity?
Could easily test that…
Paul. That is outstanding..!! I am impressed . Your blog link is?…please
I have just commenced a post on your work at my blog.
Amazing to think that the SOI oscillates in time with your animation..
Would love to be able to slow that down frame by frame
Credit:
de Boyer Montegut, C.; Madec, G.; Fischer, A.S.; Lazar, A.; & Iudicone, D. (2004). Mixed layer depth over the global ocean: An examination of profile data and a profile-based climatology. Journal Of Geophysical Research 109, C12003.
Click to access 2004_deBoyerMontegut_et_al_JGR.pdf
Figure 5 = MLD climatology
Figure 14 = annual maximum of MLD
For comparison:
Kara, A.B.; Rochford, P.A.; & Hurlburt, H.E. (2003). Mixed layer depth variability over the global ocean. Journal Of Geophysical Research 108(C3), 3079.
+ 1 / 2 / 3
John S. | January 22, 2014 at 9:15 pm | wrote:
=
There’s a fundamental reason why putative energy-in/energy-out imbalances in vertical rates of heat transfer within the ocean cannot lead to “heat sequestering” at great depths over climatic time scales. It lies in the primary dependence of water mass density upon temperature! This accounts for the persistence of thermal stratification observed everywhere, except in the wind-mixed layer above the thermocline and in shallow marginal seas. Only changes in insolation can affect this global feature.
=
J Martin says: @ June 27, 2014 at 9:35 pm….
On Milankovitch cycles NH Summer Energy: The Leading Indicator
To give you a feel for how close to glaciation we are, you can look at the calculations from NOAA for 21 June insolation at 65◦ N :
http://www1.ncdc.noaa.gov/pub/data/paleo/climate_forcing/orbital_variations/berger_insolation/insol91.jun
depth of the last ice age – around 463 W m−2
NOW (modern Warm Period) 476Wm-2
The fall 2012 paper “Can we predict the duration of an interglacial? “ looks at the ending of several interglacials. Here is a short list:
For the current value – insolation = 479 W m−2 (It is different than the value calculated by NOAA)
MIS 7e – insolation = 463 W m−2,
MIS 11c – insolation = 466 W m−2,
MIS 13a – insolation = 500 W m−2,
MIS 15a – insolation = 480 W m−2,
MIS 17 – insolation = 477 W m−2,
So we are at this point in time within the tipping point range for solar insolation. This is why I agree with Salvatore that it is a combination of factors that kicks the earth out of the warm phase and into the cold phase. He is saying something similar to what Dr. Brown said about Strange attractors, Chaos Theory and Climate
If you agree with Ilya G. Usoskin instead of L.S., that the sun does indeed vary then solar cycles is certainly one factor. Ice Age Now has been following volcanic activity and that seems to be increasing. All it would take is a big volcanic eruption in the right location – Yellowstone for example, would certainly do it.
This is an older essay by the Chem Eng. John Kehr which seems appropriate to draw attention to.
Misunderstanding of the Global Temperature Anomaly
Gail Combs says: June 28, 2014 at 9:28 pm
Thanks for that post Gail. CO2 does bugger all in the tropo, but is effective in the strat and higher altitudes (if it survives to that height/altitude).
IMHO a ‘weak Sun’ is favourable to the survival of CO2 at high altitudes where it is able to ‘radiate to space’. However, an ‘active Sun’ is able to decimate/destroy CO2 at high altitudes by way of the ‘shorter SW insolation’ breaking molecular bonds.
Best regards, Ray Dart.
Suricat: CO2 is a gas heavy gravitationally. You can extinguish the fire. This whatever is arising in the stratosphere as a result of ionization falls in the lower layers.
Hi ren. Yes, CO2 is heavy. However, for some time I’ve toyed with the possibility that CO2 could be broken on a molecule to atom scale, in a simmilar way that O2 is, by extreme SW insolation into the stratosphere when ‘it’ (CO2) presents there. This isn’t ‘ionisation’. It’s ‘breaking the molecule to its component atoms’!
It isn’t easy to find the data that can support my hypothesis because most data for CO2 relates to ‘surface/near surface’ regions/altitudes. However, I found a paper that tries to justify/co-relate satelite ‘limb’ observation with flight of aircraft and baloon data for sratospheric CO2 content.
By virtue of ‘the subject’, the paper discloses the CO2 content for the timescale covered by the paper of the stratospheric gas mix (yes, it does get that high) and I’ve offered this paper in the ‘suggestions’ thread, so I’ve no qualms as to its link here.
Click to access acp-11-2455-2011.pdf
Please look at the graphs starting on the page marked as 2466 to understand that CO2 atmospheric content varies greatly in the strat!
Best regards, Ray.
Suricat,
from http://www.atmosp.physics.utoronto.ca/people/loic/chemistry.html
An independent report ( non climate biassed) of increasing seismic and volcanic activity.
Some extracts
Posted today by the host of this forum thread on volcanoes
Duckweather the host of this earthquake thread says
on 1st July 2014
“There is so much volcanic activity occurring around the planet, it can be hard to keep up with all of the info.”
source
Forum thread: Hosted and maintain by ‘Duckweather’
http://forum.weatherzone.com.au/ubbthreads.php/topics/1268353/5
———————————————————
Some recent eruptions noted this year (2014)
Chaparrastique volcano ( El Salvadore?)
VOLCANO: Kelut 263280
PSN: S0756 E11219
AREA: Indonesia
SUMMIT ELEV: 1731M
The Tungurahua volcano in Ecuador created a spectacular plume of ash, 10km (six miles) high on Friday in an eruption that lasted just five minutes.
eruption of Sangeang Api yesterday. Ash cloud has cancelled flights in Darwin.
eruption in the Afar region in Ethiopia
The link below to CanIndia highlights a current article about a fissure which has opened up in the earth, which is spewing “flames and hot liquid steam”, akin to a volcanic behaviour.
It is located NW of India, on the southern edge of the Himalayas.
“Volcano-like eruption…” June 6 2014
.
@suricat, @ren: you may want to monitor the NASA attempt of launching OCO2 satellite, today, which promises to find locations of CO2:
– http://www.nasa.gov/mission_pages/oco/main/
Also click on Mission Overview.
WC: Susan Solomon and the IPCC central cabal is trying to get us to believe that increased small volcanos are what has ’caused the pause’ but this is unlikely in the extreme. Unless a big plume goes stratospheric (above 18km below latitude 70 degrees) it won’t be anything more than a local event.
It’s an ad hoc figleaf talking point she and her fellow travellers can brush off awkward questions with.
tweet by Geoff sharpe
The LSC average for June is 36.9, another month below the Dalton Minimum SC5 peak when counted via the old method
Does any one have access to the latest volcanic aerosol optical thickness charts? I would be very curious to see if this value has been increasing from the extremely low levels it has shown from the recent past.
Chaeremon says: July 1, 2014 at 9:50 am
Thank you soooo much for that link! At last, a data set is to be generated with a reasonably acceptable ‘resolution’! It’s just unfortunate that the project hasn’t been launched yet. 😦
If only! If only! If only, we had such resolution for surface temps!
Thanx, Ray. 🙂
More activity reported by ‘Duckweather’ weatherzone forum
—————–
extract
“Speaking of the Japanese growing island land mass, a new article has just been put up on The Watchers regarding yet more volcanic activity making a spectacle of itself…
“Growing Japanese island and volcano Nishino-shima erupts ash plume 3 km into the air” TW
http://thewatchers.adorraeli.com/2014/07/01/growing-japanese-island-and-volcano-nishino-shima-erupts-ash-plume-3-km-into-the-air/
————
try these links below Salvatore. I am out of download data LOL ..so haven’t checked them out yet
Let us know which is a good link . thanks. Sounds like a good climate watch. Monitoring aerosol density
http://daac.gsfc.nasa.gov/data-holdings/PIP/aerosol_optical_thickness_or_depth.shtml
http://www.ospo.noaa.gov/Products/atmosphere/aeroprod.html
http://data.giss.nasa.gov/modelforce/strataer/
http://serc.carleton.edu/usingdata/datasheets/aerosolopticalthick.html
http://www.ospo.noaa.gov/Products/atmosphere/index.html
http://centaur.reading.ac.uk/19464/
http://www.goes-r.gov/products/baseline-aerosol-opt-depth.html
ooooh look.. someone has a wordpress on this
http://chartsgraphs.wordpress.com/2011/01/21/volcanic-solar-dimming-enso-and-temperature-anomalies/
http://chartsgraphs.wordpress.com/2011/01/21/volcanic-solar-dimming-enso-and-temperature-anomalies/
This only goes to 1999. Thanks
http://data.giss.nasa.gov/modelforce/strataer/
This one is more updated. Notice how low the optical thickness values are recently. Thanks for this info.
I like the one that gives a monthly mean.Thanks Weather cycles
We await the release of David Evans’ model. As I said on a recent WUWT post I have been using the beta model. Irrespective of what is under the hood, the hindcast match is very good considering we are dealing with climate. So if it predicts a sharp drop down, I am not going to argue against that because of something I feel in my waters.
Hi David. Despite the sharp drop in the graphic, I note that David Evans was fairly conservative in his prediction, perhaps to reduce the risk of falsification:
http://joannenova.com.au/2014/06/big-news-viii-new-solar-model-predicts-imminent-global-cooling/
Science is about testable hypotheses. Over the next decade, the changes in temperature will reveal which theory is more correct, the carbon dioxide model or the notch-delay solar model.
Here’s the criterion: A fall of at least 0.1°C (on a 1-year smoothed basis) in global average surface air temperature over the next decade.
If the criterion does not occur: Then the notch-delay solar model is falsified and it should be thrown away.
In personal communication, David has explained this more conservative estimate to me, and our positions are closer than I thought from my initial examination of his hypothesis.
Lowest recorded temp this morning in Brisbane?
http://www.weatherzone.com.au/news/brisbane-shivers-through-its-coldest-morning-in-18-years/97583