


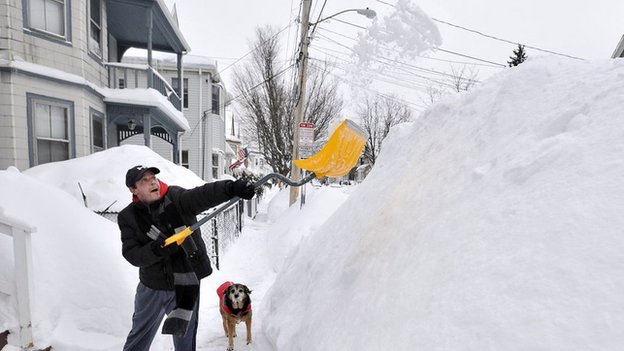
Snowy Boston 2015
Despite the fact that former climate guru James Hansen conceded there had been a temperature standstill in the current century, it’s now claimed by the NOAA that it was all a myth.
A reported pause in global warming—a mystery that has vexed scientists and delighted contrarians—was an illusion based on inadequate data, U.S. government researchers reported Thursday.
The findings by National Oceanic and Atmospheric Administration (NOAA) researchers that there was no warming “hiatus” over the past 15 years could reshape consensus science on recent climate change. The research undercuts an argument of pundits and politicians who oppose taking action.
In the new report, NOAA’s team focused on an ever changing network of thousands of temperature-monitoring stations on land and on ships and buoys at sea around the world. The scientists replotted average annual surface temperatures since 1880 while accounting for changes and quirks in the readings, particularly anomalies from ocean ships and buoys. Their conclusion confirms that unrelenting warming has occurred since the mid-20th century, according to the study published in the journal Science.
Full report: Science Challenges Claim That Global Warming Took a Hiatus.
Professor Judith Curry commented ‘color me unconvinced’.
Has NOAA ‘busted’ the pause in global warming?

Shell game: http://realclimatescience.com/2015/06/the-hiatus-shell-game/
A big fuss about ERSSTv4 just started on Lukewarmist blogs today.
The delayed response is suspicious.
I’ve been warning the community for months that ERSSTv4 is a coldly calculated deliberate sabotage of ERSSTv3b2.
– – – – – –
1.
January 2, 2015 at 6:43 pm
=
The forecasted assault has already begun.
[…]
I’ve done a preliminary exploration of ERSST v4 changes from v3b and I have to report severe rewriting of polar history (60N-90N & even more egregiously 60S-90S).
A severe act of vandalism has been committed on the Southern Ocean in particular.
Southern Ocean EOF1 & EOF3 have been defaced beyond recognition.
(By definition the change to EOF1 is a fundamentally serious matter.)
This is as dark as dark gets in the realm of climate dark agency.
Trying to correct such absolute dark agency is impractical.
Human nature is what it is.
Strictly untenable physical, geometric, & geographical assumptions have been artificially imposed to achieve a dark (endgame magnitude) extrapolation of (perhaps ultimate if left unsuccessfully challenged) political utility.
It’s clear at this stage that the silencing efforts will incrementally go to whatever extremes are needed to eventually achieve full political narrative control.
Historically, the release of ERSSTv4 may well mark the end of worthwhile climate discussion.”
=
– –
January 2, 2015 at 7:07 pm
=
Reviewing what I just commented I realize immediately that I had better make (without any delay) the following clarification:
I’m referring to global EOF1 with attention to the Southern Ocean portion of it
(not EOF1 of only the Sourthern Ocean).
By definition the change to EOF1 is a fundamentally serious matter.
It’s important to recognize that it demands of the Indo-Pacific Warm Pool and Southern hemisphere wind fields (in particular the powerful southern circumpolar westerlies) something totally impossible.
This is a very serious matter. (Denying elementary geometry is a sure way to unambiguously expose ignorance &/or deception to enlightened onlookers. We’re guaranteed to learn something about the honesty & integrity of NOAA because of this slip-up.)
Now I need to go hiking & sea-kayaking to rise above all of this darkness…
=
– –
January 3, 2015 at 4:40 am
=
They’re trying to cover up Thomson’s error because it’s so important.
=
– – – – – –
2.
February 22, 2015 at 2:44 pm
=
I regard the release of ERSSTv4 as a serious indicator from the establishment. They’re clearly saying that the climate agenda will be pushed through no matter what needs to be done to make it happen. That’s the point they’ve reached.
=
– – – – – –
3.
February 23, 2015 at 7:55 am
=
OB suggested:
“in other words it’s a propaganda war, hearts and minds stuff. In such a scenario science is just a buzzword.”
well-said OB
Joanne’s sharp like a tack.
wuwt = infiltrated, co-opted, used to bait & neutralize
spatiotemporal changes from ERSSTv3b to ERSSTv4 = giveaway
hand’s showing (double-or-nothing every time no matter what = exponential escalation — most powerful force in universe = compound interest – Einstein)
artistic touch of red paint in the southern ocean poleward of africa = clever (cold calculation itself couldn’t better optimize the sun-climate EOF distortion — distortion art-school endgame scholarships awarded for this timely smashing ace)
natural beauty = defaced
…and the chairman’s feasting, not fasting
…but they made one very serious mistake (to be continued…..)
=
– – – – – –
4.
March 28, 2015 at 7:56 pm
=
The preceding are clearly evident in ERSSTv3b. (They’ve been systematically defaced in ERSSTv4. The only viable possibility is deliberately calculated vandalism, presumably to swiftly artificially engineer doubt. Only someone who really knew what they were doing could pull this off. I take this as an ominous indicator of the level of seriousness of the agency directing vandalism.)
=
– – – – – –
“We don’t see a hiatus in the new data.”
Nor do I. How can anybody?
A hiatus is a break, with a continuation at the end of the hiatus.
Until one observes or reasonably expects a continuation, one cannot apply the term “hiatus”. It’s not reasonably to expect a continuation as the (CAGW) climate models have demonstrated no predictive skill.
One should have been rigorous and pointed to the divergence between modelled prediction and observation; not ever erred in using the words “pause” or “hiatus” to describe that divergence. Imprecision in the language leaves room for lies and deception.
Bernd: let’s not imagine the climate establishment is concerned about being reasonable 😉
‘Reports Of The Death Of The Global Warming Pause Are Greatly Exaggerated’
‘The paper by Karl et al. (2015) published today in Science is an ‘express’ report and not up to the standards of a comprehensive paper. It is a highly speculative and slight paper that produces a statistically marginal result by cherry-picking time intervals, resulting in a global temperature graph that is at odds with all other surface temperature datasets, as well as those compiled via satellite.’
http://www.thegwpf.com/reports-of-the-end-of-the-global-warming-pause-are-greatly-exaggerated/
‘Smoke and mirrors’ from the NOAA?
Nathan Rao on page 4 of today’s Daily Express writes that “86F today as summer comes thundering in”. I make that 30C !!! Yet this value does not appear on the forecast map for the UK.
I saw on the BBC that there might be thunder storms so that bit is okay.
The Express weather page showed 25C for London at 09:50 today but don’t say exactly where.
Do these people collect a bonus for outlandish global warming claims?
[reply] whatever sells papers 😐
update: http://www.telegraph.co.uk/news/weather/11653953/Violent-thunderstorms-sweep-across-Britain-on-hottest-day-of-the-year.html
The satellite data is the ONLY data I think is not agenda driven and is the data I will go by.
This is more of their BS agenda manipulation of data.
I have pointed this out so many times in the past when I have said repeatedly that if the data does not conform to AGW theory it is either IGNORED, WRONG , or MANIPULATED.
This is just another attempt and will not be the last attempt to try to keep this soon to be obsolete absurdity alive, that being AGW theory.
So, what of all those 60 odd papers stating where the heat had gone?
[reply] indeed
Summary of 2008 Atlantic Tropical Cyclone Activity and Verification of Author’s Seasonal and Monthly Forecasts (Philip J. Klotzbach and William M. Gray, Department of Atmospheric Science Colorado State University, Nov. 2008) [http://tropical.atmos.colostate.edu/Forecasts/2008/nov2008/nov2008.pdf]: “The global warming arguments have been given much attention by many media references to recent papers claiming to show such a linkage. Despite the global warming of the sea surface that has taken place over the last 3 decades, the global numbers of hurricanes and their intensity have not shown increases in recent years except for the Atlantic. The Atlantic has seen a very large increase in major hurricanes during the 14-year period of 1995-2008 (average 3.9 per year) in comparison to the prior 25-year period of 1970-1994 (average 1.5 per year). This large increase in Atlantic major hurricanes is primarily a result of the multi-decadal increase in the Atlantic Ocean thermohaline circulation (THC) that is not directly related to global sea surface temperatures or CO2 gas increases. Changes in ocean salinity are believed to be the driving mechanism. These multi-decadal changes have also been termed the Atlantic Multidecadal Oscillation (AMO).”

http://woodfortrees.org/graph/esrl-amo/from:1950/to:1980/trend/plot/esrl-amo/from:1980/to:2010/trend/plot/esrl-amo/from:2010/trend/plot/esrl-amo/from:1950
http://appinsys.com/globalwarming/amo.htm
The decrease in solar activity and AMO will significantly reduce the temperature of the North Atlantic. Already this winter it was very visible.
http://woodfortrees.org/graph/esrl-amo/from:1950/to:1980/trend/plot/esrl-amo/from:1980/to:2010/trend/plot/esrl-amo/from:2010/trend/plot/esrl-amo/from:1950
SST measurements taken by ships are apples.
SST measurements taken by buoys are oranges.
Adjustments are bananas.
The paper would be just as believable if they included as co-author the Piltdown Man.
LA Times graphic:
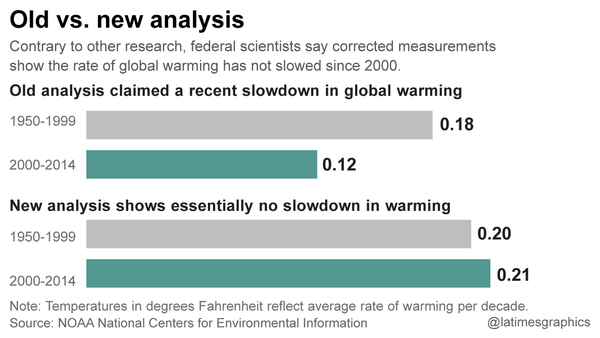

===========================================
‘contrary to other research‘ – so somebody must be wrong
http://www.latimes.com/science/sciencenow/la-sci-sn-no-global-warming-hiatus-noaa-20150603-story.html
Re Aip’s comment: ‘SST measurements taken by ships are apples’
Confirmed – ‘definitely one apple here, give or take 17 apples‘
Jo Nova reports:
‘Ross McKitrick points out that to get the new NOAA sea surface data they added 0.12 °C to the buoy readings, to make them more like the ship data. That magic number came from Kennedy et al. (2011) where the uncertainty was reported as (wait for it) 0.12 ± 1.7°C. (Which is like saying there is definitely one apple here, give or take 17 apples. So this is what 95% certainty looks like?).’
http://joannenova.com.au/2015/06/seven-steps-to-adjust-the-pause-away-by-karl-in-2015/
Another giant leap for fake climate science by the look of it 😦
I’m going kayaking & hiking later, so I’m not making time to rework this for diplomacy.
The raw, core message will have to do….
–
Lukewarmist blogs are aiding & abeting alarmists by LIMITING criticism to the way alarmists push down GLOBAL TEMPORAL spikes and push up GLOBAL TEMPORAL dips:
That’s a DIVERSION TACTIC designed to keep attention AWAY from the DARKER SPATIAL EVIL in play.
The most damning change from ERSSTv3b2 to ERSSTv4:
AGGRESSIVE VANDALISM OF REGIONAL SPATIOTEMPORAL PATTERN
They’re NUKING historical spatial patterns on purpose.
They’re SYSTEMATICALLY DESTROYING THE EOFs.
They want the EOFs & PCs defaced NOW before the public realizes what ERSSTv3b2 clarified about sun-climate relations.
Alarmists are engineering a FICTITIOUS MAP and lukewarmists blogs are running cover to keep focus away from the more sinister dimension (the spatial dimension) of the history white-wash.
It’s active diversionary mitigation to steer focus towards the MORE MANAGEABLE temporal global average dimension.
The maps are fingerprints.
The criminals want the fingerprints destroyed.
Sun-climate spatial fingerprints must be destroyed. It’s a mission imperative. (their perspective)
The temporal changes are EASY to debate, but the spatial pattern changes are FATALLY incriminating …they demand violation of geometric axioms & laws. Are they going to rewrite earth orientation parameter records to match??? ….remember that the geophysical record is MULTIVARIATE.
–
A lesser note advising of a juvenile mistake:
Note at CE an ill-considered plug for BEST, which COMPLETELY F***KS spatiotemporal pattern. BEST is even worse than ERSSTv4 for preserving regional spatiotemporal pattern believe it or not. One of the core “experts” over at CE is commenting well-outside of her area of expertise and frankly it’s shameful to support a product that does such egregious vandalism to spatiotemporal history. Her bad vision needs correction. Having her in a leadership role is a liability. What’s worse is that people are willing to follow such a “lead” head. The community needs to do much better in the long run to actually win the game.
Tip:
EOF1
1920
I’ve warned about this many times…
Quotes A & B from:
She got A write and B wrong:
A.
“I am also unconvinced by NOAA’s gap filling in the Arctic, and in my opinion this introduces substantial error into their analysis. I addressed the issue of gap filling in the Arctic in this recent publication: Curry JA, 2014: Climate science: Uncertain temperature trends. Nature Geoscience, 7, 83-84.
Relevant text:
Gap filling in the Arctic is complicated by the presence of land, open water and temporally varying sea ice extent, because each surface type has a distinctly different amplitude and phasing of the annual cycle of surface temperature. Notably, the surface temperature of sea ice remains flat during the sea ice melt period roughly between June and September, whereas land surface warming peaks around July 1. Hence using land temperatures to infer ocean or sea ice temperatures can incur significant biases.”
B.
“The surface temperature data sets that I have confidence in are the UK group and also Berkeley Earth.”
She got A write and B (seriously) wrong.
– – – –
_
quote below from:
http://www.cato.org/blog/there-no-hiatus-global-warming-after-all
“Getting the vertical distribution of temperature wrong invalidates virtually every forecast of sensible weather made by a climate model, as much of that weather (including rainfall) is determined in large part by the vertical structure of the atmosphere.”
– – – –
_________
1920 EOF1 …
Joanne Nova wrote:
“This is a fairly standard form of adjustment — cool the past, warm the present. Smooth the bumps.”
Yes – Agree 100% …
______
… BUT:
What’s going on with the ERSSTv3b2 ***geographical reconfiguration*** to ERSSTv4 is orders of magnitude more sophisticated & sinister than what such a trivial “analysis” (not much of an analysis frankly) of global temporal average (alone) can reveal.
• Reminder: Sinister ***geographical reconfiguration*** (this wasn’t done by amateurs — you have to be extremely clever, intently manipulative, & on a no-fail mission to save the world to pull off a multivariate optimization with such a calculated spatiotemporal impact) from ERSSTv3b2 to ERSSTv4 erases 4 primary sun-climate fingerprints.
• Lukewarmist K15 diversionary mitigation aids & abets alarmists — so-called “analysis” completely misses the map of what’s really going on…
If people let this slide, there’s no chance of winning the war …but I’m pretty sure everyone will be afraid to touch it.
Candid Advice: Find the courage or prepare for certain defeat. Letting them get away with such egregious geographical reconfiguration is a waving white flag.
_
The real deception here:
They can now REVERSE the COUNTER-oscillatory changes they’ve made to the global temporal average and look submissive to naive critics (the ones who only focus on global temporal averages, ignoring the MAP of multivariate spatioteomporal pattern…)
…BUT they’ll have successfully built in a geographical white-wash to hide the 4 primary sun-climate fingerprints.
If they’re on the path I estimate them to be on with their endgame-magnitude history revision, they’ll boldly engineer an underhanded claim that annual & semi-annual sun-climate patterns (cyclic volatility) in earth rotation are orbital aliases.
They haven’t tried that yet, but it’s the obvious thing a deceptive agency with serious intent would try. I hope they’re reading here so they’ll get the idea and try. Observing such an attempt would provide invaluable information about their true nature.
UK extremes
Parameter Location Value
Highest maximum temperature Frittenden 26.7 °C
Lowest maximum temperature Fair Isle 10.3 °C
Lowest minimum temperature Kielder Castle 5.3 °C
Highest rainfall Wainfleet 12.4 mm
Sunniest Shawbury 9.6 hours
Issued at: 0002 on Sat 06 Jun 2015
This is a site marked started 2011
Maybe this 51.1418 0.5957
http://www.bing.com/maps/?v=2&cp=shq73jh1gp1f&lvl=20&sty=b&eo=0&q=51.1418%200.5957&form=LMLTCC
GE history shows more.
Suspect it is not an AWS but if not shouldn’t resolve that fine.
East Malling approached 25, looking around it was more a matter of local weather, when the sun shone, how the wind behaved.
Does it matter that NOAA is under(part of)
the department of commerce?
Yes. It’s financial warfare with all the gravity & imperative that entails, but they’ve miscalculated.
If we look at the chart AMO, it is seen that the temperature difference exceeds 0.5 degree. At minimum of the sun the temperature drops even lower. Europe and
Northwest WestNortheastern/Eastern US should be to prepare for 30 years a significant cool down.http://woodfortrees.org/graph/esrl-amo/from:1950/to:1980/trend/plot/esrl-amo/from:1980/to:2010/trend/plot/esrl-amo/from:2010/trend/plot/esrl-amo/from:1950
Sorry: northeastern and eastern US.
AMO growth phase and global temperature from 1980 to 2010 are compatible.
http://woodfortrees.org/plot/esrl-amo/from:1980/to:2011/plot/esrl-amo/from:1980/to:2011/trend/plot/wti/from:1980/to:2011/plot/wti/from:1980/to:2011/trend
Quite a powerful response to the NOAA paper:
The missing heat is l.y. away by now, about 5 parsecs. Catch it if you can.
Even though the two thermometers were in the same place, they gave different readings. And it was happening all over the world. As more buoys were dropped into the sea — all delivering measurements that were consistently cooler than a ship would show in that same spot — the warming trend in the average global temperature seemed to slow dramatically.
But Karl and his colleagues believe what looked like a flattening of the warming trend actually just reflected a change in the way the temperature was taken. When the team factored in a correction to the historical data that reconciled the buoys with the ships, they found that what had seemed to be a hiatus in warming disappeared.
http://www.npr.org/2015/06/04/411998275/scientists-cast-doubt-on-an-apparent-hiatus-in-global-warming?utm_source=facebook.com&utm_medium=social&utm_campaign=npr&utm_term=nprnews&utm_content=20150604
If you do a positive correction for every buoy and the number of buoys keeps increasing you guarantee a positive trend …but westerners are so bad at math they’ll overlook such simplicity.
The largely functionally innumerate western populace can be trusted to remain focused on the temporal evolution of global averages without even considering what malice has been done to the spatial EOFs.
Paul Vaughan need forget about the old measurements and consider new ones. But how to measure? Discard the buoys? Or maybe ships?
Why only after the 18 years there is a problem with the measurements of ocean temperature?
“History will be kind to me, as I intend to write it”
W.S.Churchill
ren (June 6, 2015 at 2:23 pm) suggested:
“need forget about the old measurements and consider new ones”
No, that does nothing to maintain our understanding of the past 160 years of multidecadal-centennial climate. At most the measurements are out by an ENSO no matter the topological sources of the ship transect biases. In contrast, it will be many decades before new time series (e.g. CERES, ARGO) are of appreciable utility for understanding multidecadal-centennial climate.
Let me put the question to everyone this way:
Does anyone doubt that ENSO is global mode 2???
Even with severely corrupted sampling you’ll find ENSO as global mode 2 and ENSO is the main pattern scrambler, so concerns about sampling adequacy are frankly SEVERELY overblown. People suggesting the sampling isn’t good enough are commenting too far outside of their limited area of expertise and clarifying inadequate cognizance of aggregation criteria fundamentals.
As I’ve demonstrated many times, even the extremely sparse ICOADS wind transects easily pick out such a global mode:
It’s a slam dunk. The sampling is fine. It has NO PROBLEM picking out ENSO.
What’s missing isn’t sampling, but rather clear thinking about why the extremely sparse sampling is way more than adequate to pick out a mode as global as ENSO.
As for the other important modes, there are 3 as I’ve illustrated.
1. sunspot integral (a tropical mode reflecting the size of the warm pool)
4. ENSO integral (centrally limited by SCD = solar cycle deceleration = semi-annual westerly wind volatility weave rate shift spacing & pacing (effectively steering) poleward advection)
3. ENSO envelope (trivially bounded by intersection of annual interhemispheric & semi-annual mid-latitude westerly volatility weaves)
2 is an east-west asymmetry mode
3 is a north-south asymmetry mode
4 is an equator-pole asymmetry mode
1 is the signal
That’s it. There’s nothing else of consequence.
It’s simpler than obfuscation art-school graduates are willing to admit.
With an artificial splash of red map paint, you can camouflage sun-climate simplicity.
I don’t question that.
What I question is people’s capacity & ability to realize that.
There are a lot of people with time-only pattern foundations, but I’ve not encountered a single climate discussion participant with a solid philosophical grounding in spatiotemporal aggregation fundamentals. There’s a complete void …and that’s why the lights are out when people fail to fathom why sparse sampling is more than adequate to detect global mode 2.
This is a serious failure. It’s fatal.
Paul Vaughan
These links were posted on Bob Tisdale’s Blog by Nic Lewis (may not be news to some)
ERSSTV4 upgrades
Click to access ERSST.V4.P1.JCLI-D-14-00006.1.pdf
Uncertainty estimates
Click to access ERSST.V4.P2.JCLI-D-14-00007.1.pdf
Andrew
http://www.cpc.ncep.noaa.gov/products/analysis_monitoring/ensostuff/detrend.nino34.ascii.txt
figures from:
6

10

11

12

animations
1

2

That’s a deliberate spike through a bloodied hand on the sun-climate cross:
Andrew informs us we have access behind the paywall.
And what do we find?
We find in words exactly what I reported on Jan. 2 …way before right now when we just gained access behind the paywall ….and 1 day after Tisdale’s article that prompted me to explore v4 EOF distortion from v3b2.
From the Part I section on the trickery they’ve applied for spatially manipulative low-frequency infilling:
“South of 60S, the SSTAs decrease by 0.2 to 0.4C before the 1940s (not shown). North of 60N, the SSTAs increase by 0.2 to 0.6C after the 1930s. Therefore, the SSTA trend increases by 0.4 to 0.6C/century south of 60S and north of 60N, although the global averaged SSTA trend is changed little (less than 0.02C/century).”
You see how they fool people who focus only on global averages?
They’re busy destroying sun-climate spatial fingerprints …and no one notices.
“Nearby” (as if !!) infilling in places where gradients are steep??
It’s not the ethical choice …but it has the nice effect (their perspective) of hiding (by completely wiping out) what Dickey & Keppenne (NASA JPL 1997) taught us from (a) geometric axioms & (b) laws (of large numbers & conservation of angular momentum) ….concisely visually summarized as a graphical equation here:
No shame (their perspective).
They have a mission to accomplish.
Frankly this is infuriating. Dickey & Keppenne’s (1997) insight is the most elegant finding in the history of climate science, towering above all else. Vandalizing a shrine is inflammatory, especially one documenting the stunning beauty of nature.
Of course this is a calculated move. NOAA knows (from years of observation) that skeptics lack the capacity to fathom the intersection and implications of the annual & semi-annual cyclic volatilities illustrated in Dickey & Keppenne’s (1997) landmark Figures 3a & 3b, so they know they can get away with this. Shame on everyone. Human nature I suppose…
OK I’m reading farther in Part I and I’m at the part where they’re testing model assumptions — get this — with models. That’s a sure-fire way to deceive. They’re at least deceiving themselves if they think such comical deception will pass.
Using a model, they found that their first 2 model assumptions are “valid”. Like WTF???
Then they go on to admit:
“the local biases may have been overly smoothed by fitting the SST and NMAT differences over the global oceans.”
But next they really blow it. Look at Figure 5 and read the associated text on the same page (p.921 = pdf p.11). There’s the source of Tisdale’s “sore thumb”, the spike they put through the bloodied EOFs of v3b2, 1-4 of which all matched solar & solar system patterns perfectly.
Someone should post Figure 5. It should be featured in blog articles to alert the community.
HERE’S THE MONEY-QUOTE ADMISSION:
“may come at a cost of accurately portraying biases at times of rapid transition (e.g., the WWII era).”
Ya figure???
Wow.
Remember that Tisdale named the section of his New Year’s Day article something like “In case you’re wondering” or something like that ….like I’m saying now with the benefit of 20/20 insight into what they’ve done: NO f**king wonder!!
Put together the first quote above about the LOCAL biases and the later quote (…and more spectacularly the associated figure 5!) and it’s becoming crystal clear how they’ve f**ked the spatial EOFs so badly.
They deceived at least themselves if they thought they’d get this spike-wool over anyone’s eyes. Sure they may fool everyone on Dickey & Keppenne, but they’ll fool almost no one with the spike trick.
The only consolation prize here might be that they’ll influence Hadley to fix their HadSST3 overestimates in the 1920s & 1930s.
I now have the info I need (from the paper that we now know was kept paywalled for obvious (!) reasons) to do some really serious diagnostics. The only question is will I have the time even if I sacrifice all I can afford? Dunno. We’ll see…
Note that they’ve also done some serious damage with their bias adjustments before 1886 (especially in 1878) and probably around 2004. They know very well that the bias adjustments are not independent of interannual & inter-regional variations …but they’ve pushed this through anyway.
NO DOUBT there are some good technicians trapped working there who knew this was wrong. It’s a little creepy to think of their sketchy shady bosses pulling rank on them and pushing the spike issue. They probably felt violated.
Lowess 0.1 goes airborne either side of 1940 (in Figure 5). They’ve pushed it too far and that’s really obvious in Figure 6, which also clarifies what’s wrong with HadSST3 either side of 1930.
Figure 7 makes it even more clear what they’ve done wrong, v3b2 standing out as the clear winner. Panel (b) screams out an important message …that NOAA apparently aims to suppress with a model uniformity assumption that’s “validated” by another model!! (see above).
There are probably more gems in the paper, but I’m going to stop there for now.
Actually maybe I should succinctly clarify in simpler terms.
They aggressively smoothed (in v4) across a SHARP discontinuity.
At a sharp bias discontinuity, a STEP adjustment is appropriate (as was done in v3b2).
The v4 choice had the extremely noticeable effect of AMPLIFYING an extremely well-known bias.
This is an outrageously STUPENDOUS error.
And look at how many authors there are on the paper. Every one of them failed.
For NOAA the appropriate thing to do now (and the only sensible option available) is to announce:
A) This was a serious error.
B) The serious error will be corrected for a v4b release.
In the P1 Introduction they make it sound like a big deal that that v4 has bias adjustments after WWII whereas v3b2 did not, BUT then (lol!) look at the later admission (also evident from visual inspection of figure 6):
“the global averaged bias adjustment in ERSST.v4 is near zero after the WWII era”
(p.923 = pdf p.13)
It’s sooooo (!) much better (….so they sales-pitch in the intro!) because post-war bias corrections amount to a whopping *** “near zero” *** ….probably makes sense to some bureaucrat looking to justify spending.
….but wait! They’re talking about “global averaged”. Ah… there’s that trick again…. (i.e. screw up the spatial pattern while keeping the global average looking the same).
also noteworthy:
The ship-buoy SST difference “correction” they apply is based on a global annual average.
Figure 9c is an eye-opener (30S to 30N ERSSTv4 minus HadSST3 — features the prominent 1940 spike).
“The sea ice concentrations used to adjust the SSTs over ice-covered areas in ERSST.v4 are from monthly 1 x 1 gridded HadISST data”
That’ just wrong. Nothing more need be said.
Here’s a weaselly paragraph giving key insight into diagnostics v4 fails:
“It should be noted, however, that resolving SST variability in the tropical oceans has a trade-off in some other regions in the high-latitude oceans […] It appears that there is no single correct representation for the value of Crit (see Part II). ERSST.v4 is used for myriad applications, many of which, such as ENSO monitoring by NOAA Climate Prediction Center (CPC), require fidelity in Niño-3.4 more than the global mean. Therefore, a slight increase of global averaged RMSD is deemed an acceptable trade-off and the Crit is lowered from 0.2 of ERSST.v3b to 0.1 in ERSST.v4.”
…This confusion from people trying to make bias adjustments spatially uniform!
– –
Overall the bias adjustments smoothed with a WIDE kernel across an ABRUPT transition still take the cake. Stuuuuuupendous!!ly dumb. In the wow-just-wow category of things they’ll regret. I can’t stop chuckling & laughing realizing this happened despite this being a large agency with armies of people ALL of whom should have caught this SOOOOO-obvious mistake.
They’ve been caught and they have to do corrections to have any chance of looking sensible.
Lesson for politicians:
Don’t hire laughable amateurs to design ridiculously transparent deception.
Now that I see how they got that spike I just can’t stop laughing. Sooooo stupid!!
In summary:
NOAA got caught exaggerating the spike by cutting corners off the abrupt bias step with a wide filter.
They didn’t remove bias, they added bias and in a very slick way. On scanning this thread I didn’t come across anyone pegging it or I missed it.
OB mentioned the +0.12°C added to the buoy data but in an anomaly an added constant offset is not going to add change anything. But, what they did is not only add the +0.12°C to all buoy data but also scaled or weighted the use of that buoy data between 1900 and present only giving 5% weight to that elevated data in 1900 and scaling the weight up to 95% used today eliminating other data due to the weighting that now only weights as 5%.
That is from memory so please excuse me if I am off a little on any figure but I believe those were the ones used.
That is added positive bias without a doubt the way I see it, about +0.1°C at least (5% to 95% weights) added to any trend this shenanigan is included and that is if ship data inclusion being diminished downward to today’s weight of 5% didn’t add even more bias than that mentioned.
You really have to read carefully to turn up that trick. Well hidden.
Here’s a damning admission from PII (p.936 = pdf p.6) about v4 infilling:
“the LF anomaly filling becomes dominant in the polar regions and is the dominant parameter choice in the region 90–60S through the whole period “
Let’s break out a piece of that for focus:
“the LF anomaly filling becomes dominant”
Focusing even more tightly on what really matters here:
“filling becomes dominant”
At least with v3b2’s zero-filling, the observations were dominant.
In v4 the observations are submissive to the filling.
This is what I had noticed when I wrote the Jan. 2 comment.
This was the egregious change I first noticed that caused me to start getting so angry — i.e. rude vandalism of observations perfectly coherent with Dickey & Keppenne’s (NASA JPL 1997) landmark insights into the ENSO variance envelope = decisively unforgivable.
Now I have confirmation (in their own words from behind the former paywall) that they did what I suspected based on the regional pattern changes. This was a really sleazy thing to do, especially since it’s a no-brainer that this approach won’t work in a region with steep gradients.
It made them look like they were up to malice …but now that I’ve seen how they got the other thing that made me angry (the ridiculously amplified spike), I’m no longer so sure it’s malice …but it’s just so hard to believe they could possibly be that dumb …but as I’ve always said in circumstances where it’s unclear whether one is looking at naive ignorance or malicious deception: It’s DARK either way! Conclusion: DARKNESS. Shine some light on these people!! Please!
I hasten to clarify: If they don’t correct v4 and if v3b2 ever disappears from the KNMI Climate Explorer spatial interface, it of course again looks like head games & deception. Is it better to look stupid? Tough choice! But probably most would prefer to look deceptive! Frankly I suspect they’re eager to disappear v3b2.
This might explain why they couldn’t resist the temptation to sacrifice polar integrity:
“For filtering and infilling step parameter choices (Fig. 4i), an adoption of zero LF anomaly filling is most prominent in reducing the warming in the polar regions (i.e., in the Southern Ocean and in the Arctic).”
Here’s another PII paragraph giving key insight (p.942 = PII pdf p.12):
“The parametric uncertainty in the Southern Ocean (90–60S) exhibits a distinct feature. As shown in Fig. 7g, the ensemble SSTAs in the Southern Ocean visibly bifurcate into two groups before 1935 and within 1955–70, so the ensemble-mean SSTA deviates from the operational value, and the SST uncertainty decreases instead of increasing around WWII. A similar case also happens in the northern North Atlantic and the Arctic (60–90N) after 2000. The reason is that the parameter choice of an LF anomaly filling technique overwhelms the other parameters over the polar regions during these periods, and the two choices have a large systematic offset from one another (Figs. 1b,f).”
Figure 7g tells it all. It’s such a relief to see this admission. Just looking at figure 7g and what it admits calms me down. This story about Southern Ocean vandalism deserves some carefully-written blog posts if someone like Bob Tisdale has the time.
Focusing in:
“the parameter choice of an LF anomaly filling technique overwhelms the other parameters over the polar regions during these periods, and the two choices have a large systematic offset from one another (Figs. 1b,f).”
It’s clear they know it was the wrong thing to do.
This explains a few things about v4 Southern Ocean patterns that really angered me on January 2. I confess: I was extremely angry at the vandalism that just appeared out of nowhere to hide evidence confirming Dickey & Keppenne (1997). (Remember: The paper was behind a paywall until today.)
My tip to them:
Don’t disappear v3b2. You need to fix the errors you’ve introduced into v4.
My request of KNMI Climate Explorer:
PLEASE don’t disappear v3b2 …even if/when v4b corrections to v4 are released, as trust has been destroyed. THANKS IF you can honor this request.
Exactly what has become obvious:
“The global-mean long-term trend computed from ERSST.v4 is most sensitive to two parameters: the bias adjustment smoothing and the low-frequency anomaly filling.”
(P2 “Discussion” section p.949 = P2 pdf p.19, mid-way down right column)
Summing up, having the 2 papers out from behind paywall crystallizes 2 fatal v4 errors:
1. the amplified spike …due to STUPIDLY over-smoothing the corners off the WWII bias step — this is actually quite funny once you understand what they did.
2. egregious Southern Ocean vandalism …via corrupting projection of pattern from lower latitudes. What makes this so egregious is the blatant & brazen disregard for the destruction of evidence in support of Dickey & Keppenne’s landmark 1997 paper outlining the DNA of the ENSO variance envelope — absolutely unforgivable! At least they admit their mistake in the paper.
These 2 v4 errors need to be corrected.
They might as well correct the Arctic while they’re at it …and get a clue about why ERSSTv4-minus-HadSST3 varies with latitude. Hint: It’s built into Hadley’s bias model. The push for uniform bias is misguided (as is Hadley’s competing approach). The v3b2 map in contrast shows a natural bias variance pattern coherent with air-sea coupling at western boundaries.
PV says: ‘Someone should post Figure 5. It should be featured in blog articles to alert the community.’
Figure 5
Climategate- Trenberth asks “where is the missing warming?”
Phil Jones admits that “any warming since 1995 is statistically insignificant”
Approx. 60 groups try to explain away the lack of warming since 1998.
Jim Hansen admits that there has been ‘a lack of warming’.
IPCC admits that there has been ‘a pause’.
Karl et al claim there has been no warming. IT IS A SCHISM!
Unfortunately for religious reasons Karl et al. will not be burnt at the stake.
[mod] careful Graeme – let’s not get too inflammatory 😉
‘The pause – it’s real and only complete morons try to deny it’
http://scottishsceptic.co.uk/2015/06/06/the-pause-its-real-and-only-complete-morons-try-to-deny-it/
We are in effect watching how a religion is formed.
Key Admission
“may come at a cost of accurately portraying biases at times of rapid transition (e.g., the WWII era).”
Part 1 pdf p.11 = p.921
upper right column
Figure 5

Surely they’ve seen a map of sea surface heights in absolutes (not anomalies)??
Their infilling method unrealistically projects tropical mode 1 poleward across the southern wall (south of africa — what I meant by “splash of red paint”) all the way to the shores of antarctica:
Lubos Motl dismantles the latest climate nonsense: ‘So the faith finally has to depend on upside down medieval trees and engines in outdated marine vessels’
‘They know the “right” conclusions even if they don’t have the slightest idea what is going on and what the right explanations of anything could be.’
‘Higher trends mean higher grants.’ LOL.
Very good read OB. Glad to see some good physicists that understand the core level of the sciences to get involved and are of course correct, this was nothing but governmental propaganda from the get go.
‘Higher trends mean higher grants.’ Exactly.
The original by Lubos is at:
http://motls.blogspot.com/2015/06/karl-et-al-hiatus-killer-is-research.html
It’s the clueless leading the hapless – what a formula for success that isn’t.
Dr Roy Spencer’s latest UAH graphic – can you spot the ‘non-pause’ ?

Important points from Oldbrews posting.
* The authors have produced adjustments that are at odds with all other surface temperature datasets, as well as those compiled via satellite.
* They do not include any data from the Argo array that is the world’s best coherent data set on ocean temperatures.
* Adjustments are largely to sea surface temperatures (SST) and appear to align ship measurements of SST with night marine air temperature (NMAT) estimates, which have their own data bias problems.
* The extent of the largest SST adjustment made over the hiatus period, supposedly to reflect a continuing change in ship observations (from buckets to engine intake thermometers) is not justified by any evidence as to the magnitude of the appropriate adjustment, which appears to be far smaller.
– See more at: http://www.thegwpf.com/reports-of-the-end-of-the-global-warming-pause-are-greatly-exaggerated.
I’m sure the Obama administration has their hands in this mess.
I don’t have much free time during the paid-work week, but as time permits I’ve been chipping away at diagnostics (including lots of EOFs).
Here’s what I can tell you so far:
– The bias adjustment method they’re using is philosophically corrupted.
– It has the effect of straightening the record and the tradeoff is that it exaggerates the WWII spike (by pushing up in the middle and down on either side).
A question we need to start exploring quite seriously:
Why are they so obsessed with making the record match HadNMAT2???
http://climexp.knmi.nl/selectfield_obs2.cgi?id=someone@somewhere
A comment on the philosophical corruption:
They’ve developed the notion that there are multidecadal biases in SST needing correction due to mismatch with NMAT. They apply “corrections” ON A UNIFORMITY ASSUMPTION, but even brain-dead Stat 101 level diagnostics immediately reveal that assumption to be false …so I think we have to conclude that they’ve got themselves confused and made some poor choices.
They’re going wrong at the philosophical level. There’s a fundamental problem with their definition of “bias”. First of all I question their ideal. NMAT might be useful for correcting AN ABRUPT, UNNATURAL, ARTIFICIAL BIAS STEP, BUT when you start trying to use it to “correct” (more like corrupt!) NATURAL “bias” (actually no such thing!) OSCILLATIONS (naturally-coupled oscillations — coupled in BOTH mean AND variance!!!) then you’re into a scenario where integrity demands that you RUN SPATIOTEMPORAL DIAGNOSTICS to counsel yourself back to sobriety (!!!!) if you’re a NOAA team “leader” misguiding innocent technicians who definitely know better than their boss!
….but of course probably the boss doesn’t know how to run diagnostics! …and probably has an aggressively exasperated “who needs diagnostics??!!!” attitude (…if s/he even knows what diagnostics are!!). From a NOAA team “leader”‘s perspective, diagnostics are too confusing & too inconvenient.
These things (not talking about big artificial steps here) are NOT “biases”. They’re only biases IF you’re trying to measure NMAT. And these things DECISIVELY ARE NOT independent of time & space, so THE UNIFORMITY ASSUMPTION IS CORRUPTING THE WHOLE EXERCISE.
Here’s what I now suspect they did:
They messed around with the loess parameter and found a setting that straightened out the record.
Basically they’re shaving interannual variability to give a smooth face.
(clean cut, freshly-shaven CO2 image??)
A tradeoff was that it exaggerated the WWII spike (by pushing up in the middle & down on either side), but they know people will dismiss that anyway …Plus there’s the added bonus (their perspecitve): by contrasting sharply, it makes the rest of the record look really straight & “clean” (“clean” as in carbon).
The oscillatory “biases” they’re tracking have nothing to do with ships, buckets, or whatever, but rather have to do with natural variability. In effect they’re smoothing out the natural variability by pretending it’s anthropogenic bias. Anthropogenic bias is natural, but that’s not a part of the usual definition of natural variability.
Technically they’ve engineered a series of straight line segments joined at articulation points — a sort of change-point connect-the-dots algorithm, designed to suppress small changes and accentuate longer-term changes by making them stick out like a corner, knee, or elbow. That’s what you’d expect from applying first-order loess calibration. Call it cornerizing or changepointing or elbowing — it’s a NOAA’s newly-minted filtering method.
There’s more to be said about this, but that’s enough for now.
It should at least be enough to wake folks up to the filtering issue.
filter abuse = substance abuse
They’re messing up the substance of the SST record.
I suspect people will remain confused and misguided about the philosophical aspects of bias definition. I’ve never encountered anyone in the climate discussion who is able to discuss the design of metrics at the philosophical level. Even when discussion is HIGHLY technical, everyone wants to base discussion on false assumptions and I’ve noticed over the years that people won’t budge on this even when false assumptions harshly, comically, & effortlessly fail simple diagnostics. They just pretend it doesn’t matter. Is this confusion? Is it deception? Dunno, but it’s dark either way and I don’t have time for it.
Lots more to discuss on this topic — months worth…
PV: would NOAA have bothered with the exercise at all if data had shown consistent warming?
I think we can guess the answer 😉
PV: good work. While all the complaints on the blogs were about the buoy – engine intake adjustments, that was just ( look squirrel ). Meanwhile the true objective is to remove variability.
Paul Homewood reminds us of this:

…while ScottishSceptic explains: ‘How NOAA put the final nail into global warming alarmism‘
http://scottishsceptic.co.uk/2015/06/09/how-noaa-put-the-final-nail-into-global-warming-alarmism/
‘In short, they’ve just proved what we sceptics have been saying all along –
you can get whatever trend you want by manipulating the data’
‘How NOAA took a page from George Orwell to disappear the global warming hiatus’
http://www.examiner.com/article/how-noaa-took-a-page-from-george-orwell-to-disappear-the-global-warming-hiatus
Andrew (June 9, 2015 at 7:13 pm) wrote:
“While all the complaints on the blogs were about the buoy – engine intake adjustments, that was just ( look squirrel ). Meanwhile the true objective is to remove variability.” [bold added]
Yes.
The commentators at political lukewarmist blogs (wuwt & ce) are sophisticated enough to neither understand nor counter this move.
The alarmists now have a lasso tightly roped around the dull lukewarmists and they’re pulling them in without a fight.
No commentators understand the bias adjustments at a philosophical level.
They’re defenseless.
Note in the commentary at wuwt & ce that there’s no resistance. (There’s not even awareness.)
Aside from Bill Illis, commentary is dead.
The lukewarmist movement is shallow & superficial.
It cannot withstand this attack.
The comments about this on lukewarmist blogs say one thing, one thing only, and one thing clearly:
surrender.
The lukewarmists have been pulled all the way over.
They just sat there and let it happen.
Still waiting to hear why man-made CO2 increases are way out of step with all known temperature trends, since before year 2000 at least. Doesn’t fit the warmist script
NOAA straightened the tropical warm pool mode and triple-counted it.
No one noticed.
Prof. Lindzen & co. conclude “… even presuming all the adjustments applied by the authors ultimately prove to be accurate, the temperature trend reported during the “hiatus” period (1998-2014), remains significantly below (using Karl et al.’s measure of significance) the mean trend projected by the collection of climate models used in the most recent report from the United Nation’s Intergovernmental Panel on Climate Change (IPCC). It is important to recognize that the central issue of human-caused climate change is not a question of whether it is warming or not, but rather a question of how much. And to this relevant question, the answer has been, and remains, that the warming is taking place at a much slower rate than is being projected.”
http://www.cornwallalliance.org/2015/06/06/noaa-study-takes-world-by-storm-no-global-warming-pause/
So even if there is a hint of warming (debatable) in the last 20 years it’s nowhere near the climate model projections. But Western and other governments are shouting that they have to accept the evidence of climate models that clearly DON’T WORK.
Earth to G7: hello?
Did everyone pick up on the link I gave above?
They added it:
KNMI Climate Explorer News:
“07-jun-2015 Added HadNMAT2 (thanks Bob, Ed).”
We have so much to discuss.
This is going to take months …maybe years.
One noteworthy change from HadNMAT1 to HadNMAT2:
– heavy inflation of the BDO (bidecadal oscillation) in the early record (especially ~1920).
More generally there are some serious changes from version 1 to version 2. Why?
Since this record is controlling ERSST, we have to understand the rationale for its changes so that we can understand “bias” adjustments used to control “bias” adjustments.
This could be a serious piece of work.
Lots of analyses & diagnostics to do.
–
crude unrefined notes following some initial exploration:
The NMAT observations are mostly in the northern hemisphere. One thing I noticed pretty quickly was that northern NMAT2 tracked northern ERSSTv3b2 until about 1969 and then it abruptly switched to tracking southern ERSSTv3b2. This tracking is near-perfect …so why the abrupt cross-hemispheric switch ~1969?
Lots of questions arising …and probably most of the answers involve THE FALSE SPATIAL UNIFORMITY ASSUMPTION when “adjustments” are made. Digging deeper into this stuff gives the impression that they are so confused about spatial patterns that they don’t know what to do other than assume spatial uniformity EVEN THOUGH THAT ASSUMPTION FAILS DIAGNOSTICS.
Why would any sensible person START with assumptions that FAIL FIRST-ROUND diagnostics?
…so our starting point should NOT include the assumption that they’re sensible.
One thing that is making me really suspicious is SEVERE adjustments south of Africa. The trend has been SEVERELY steepened and this has a PROFOUND effect on spatiotemporal modes.
It also gives some serious insight into what they might think is going on with the BDO. It looks like they think it migrated through Drake Passage in the early 20th century and then kept going east to end up back in the Pacific.
…so it looks like they think it was going under Africa or Eurasia on its eastward loop back to the Pacific when decadal SST & the Chandler wobble reversed phase.
Is this a key geophysical &/or geometric clue?
Or have they made some monstrous adjustment mistake where they HEAVILY inflated a bidecadal ~1920 southern hemisphere bump?
The good news for TalkShoppers is that here’s how they messed up the perfect EOF/PC1-4 match with solar cycle deceleration, core angular momentum, & the sunspot integral:
– by inserting bidecadal oscillation!
…so if their adjustments are right:
you get more 82.4 year BDO circumnavigation of the globe.
and if their adjustments are wrong:
SCD, CAM, & RI are less camouflaged by eye-catching BDO.
win-win…
Remember that BDO has an ENSO spatial pattern (in long run central limit) when it’s in the Pacific. That’s a simple animation to make since it doesn’t demand a windowing algorithm to pick out local evolution in time & space. I’ve shared that animation in the past.
As some of you may recall I’ve prototyped a windowed complex spatiotemporal wavelet algorithm that tracks the BDO in time & space. It was tedious, but I piloted manual application to SLP & SST fields. The BDO moves systematically. If I had time/resources to automate and fine-tune the algorithm (I decisively don’t)…. ……and so delays are built in since paid technicians’ bosses have them focused on carbon modeling. Such is the (anthropogenic) nature of the (human) world in which we (thus ignorantly) live.
P.V. Is this what your referring to
http://postimg.org/image/5ug5l6n1j/
Yes Andrew.
That animation summarizes the collection of recorded instances of the BDO, but any specific instance of the BDO may be strongly expressed in only a portion of that attractor.
The active portion of the attractor migrates systematically in a manner coherent with ENSO’s variance envelope.
Things we discussed on the BDO thread dovetail with the extension of Dickey & Keppenne (1997) I’ve recently clarified.
I had left a few loose ends in the ERSST EOF 1234 document.
That was one of them.
Several times I’ve pointed to the other. It’s a massive topic to communicate so I just introduced it in extreme-minimalist hint form. I don’t think anyone has bothered to do the easy exercise I’ve recommended many times. It’s a bit comical, because I’ve learned that even when you put something fundamentally important in front of a climate “scientist”‘s face, it doesn’t register at all. It’s both funny & creepy at the same time.
As I suspected would occur (and I’m glad to see it), Bob Tisdale’s on the the v4 NMAT2 trail, but regrettably the resulting wuwt commentary is shooting all over the place while missing the important marks. Incorrect statements about the lowess filter are going uncorrected.
Southern hemisphere patterns are being misapplied as bias “corrections” to northern hemisphere records. This is a serious mistake that — left uncorrected — will hamper efforts to understand natural variation …but somehow people don’t even seem to be aware that this has happened. People seem to get that NOAA believes biases vary with time, but somehow they miss that NOAA assumes they don’t vary with space. The community is failing — and seriously.
I’m going to have lots more to say about this. This is going to take many months.
–
Bill Illis (June 9, 2015 at 6:33 pm) wrote:
“In the last 4 or 5 months, the pro-warming community has tried to take advantage of this pre-1940 required adjustment and tried to pretend that the adjustments to 1910 sea surface temperatures, somehow justify adjusting the recent sea surface temperatures up.”
James Hansen also said:
‘The approximate stand-still of global temperature during 1940-1975 is generally attributed to an approximate balance of aerosol cooling and greenhouse gas warming during a period of rapid growth of fossil fuel use with little control on particulate air pollution, but quantitative interpretation has been impossible because of the absence of adequate aerosol measurements.’
So so-called standstills are not freakish at all.
…but the how/why in that narrative isn’t right OB.
–
I should alert everyone that a commentator name “Mike” (maybe Mike Mann?!) is misleading people at wuwt about the lowess filter. He doesn’t even realize that NO lowess filter has been applied before 1886.
From P1:
“The coefficient Ay is set to be the value of 1886 before 1886 and the value of 2010 after 2010 (the final year of the HadNMAT2 dataset at the time of analysis).Kent et al. (2013) cautioned against use of pre-1886 HadNMAT2 for long-term trend analyses.”
It’s clear especially from commentators like “Aran” that people don’t even know what the lowess filter is being used for. It’s being used to DIFFERENTIALLY shave corners off ENSO bounces. It shaves a DIFFERENT amount off each one.
This is a much too subtle point for wuwt?? They’re only interested in a narrative if it can be dumbed down to a single-effect sound-bite, whereas this filter is doing something different to each ENSO corner (…thus demanding extended bandwidth & focus you don’t get in a soundbite war).
…and that can’t be encapsulated in a dumbed-down political-style ridiculing statement. Rather it will have the effect of people simply not understanding what is being said even though it’s true and even though in aggregate it has a serious effect.
The authors are effectively re-balancing information across the ENSO spatiotemporal differential to achieve a straighter line pretty-much everywhere EXCEPT notably right at the WWII STEP, where they’re PUSHING DOWN just before and PUSHING UP just after (…and pushing down on either side & up in the SPIKE-middle relative to HadSST3, people should stop to realize for awareness in the broader context that invites accidentally-ignorant misunderstanding).
A dumbed-down narrative about what happens at the WWII step & spike is EASILY feasible. Go for it street-fighter!! Differentiate conceptually engineering any 101 for laggards: The step is in bias corrections. The spike is in measurements (biased or otherwise).
I think most people will FAIL to maintain a cognitive lock on WHERE THE STEP OCCURS.
Teacher’s 101
They need to be asked:
IN WHAT QUANTITY does the STEP occur?
We need to check that they aren’t confused and thus conflating raw records, bias adjustment records, & bias-adjusted records conceptually.
(From commentary it’s clear that people are confused and conflating — e.g. “Aran”.)
Maybe start with that. I think even duller members of the audience can be walked through the WWII step & spike example (…by a good, careful teacher).
These 2 BT graphs can be used with accompanying word elaboration:
down before STEP, up after:


down either side of SPIKE, up in middle:

101-level Caution:
Don’t confuse STEP & SPIKE.
The spike comes just after the step and it’s in a different quantity.
Some duller people – unfortunately – are going to need the conceptual & timing differences between the step & spike pointed out in 3 different ways from at least 3 different simple angles. (It’s a slow audience over there.)
…And then we can reassess and see if with that understanding in hand we can go for a 201 level grasp — for example on what’s been done 1990-2010. (People will be interested and motivated enough to make a little more effort there even though it’s a much more subtle & nuanced exercise.)
______________________________________________________________
The other thing notably missing in commentary at wuwt is awareness that the low frequency infilling strategy RESULTS IN TRIPLE-COUNTING of trends. It’s SUCH a sleazy thing to do. It should be called out. But people should take the time to independently understand firsthand.
I doubt I’ll have patience to stay back with the pack. I’m going ahead. …But I can observe and offer strategic commentary now & again here & there for those trying to herd the defiant cats. This is important so I feel a responsibility to make at least strategic across-the-aisle effort to help with guiding.
For example it’s important to understand how southern NMAT is contaminating northern ERSSTv4 BECAUSE OF THE FALSE UNIFORMITY ASSUMPTION applied by the authors. This can be seen most clearly where the BDO is artificially cross-hemispherically inflated ~1920.
No such thing was observed!!
REMEMBER: The northern hemisphere is relatively well-observed.
No such thing was observed.
It’s an artificial (anthropogenic) construct.
They probably don’t even realize that they’re injecting this southern fingerprint into the northern record. They’re not adequately devoted to careful diagnostics to notice such detail.
Here’s a graph that should help get this hint rolling —- artificial anthropogenic cross-hemispheric BDO injection ~1920:
That’s probably enough for now, but I’ll be back many more times …because this is an important topic and that means responsibility. Even people who don’t like each other are going to have to cooperate because this is important.
Ok – please find a way to get the 101-level homework (WWII step & spike distortion) done in the broader community so we can move on to a better mutual 201-level (1990-2010) understanding.
THANK YOU
Tactical & practical. Nevermind offensive, sarcastic tone. Just: Job to get done. Have to cooperate across dislike-aisle because of importance level…
This may not be obvious to everyone yet (OR EVER!):
The bias-adjustment record applied is A CROSS-NONLINEAR-PHYSICAL-SCALE MULTI-AXIAL MULTIVARIATE SPATIOTEMORAL ALIAS …and additionally a filtered one!! as if you weren’t already confused enough!
As if (!) anyone’s going to understand ^THAT !!
A VERIFIABLY FALSE assumption has been made that the PDF (probability distribution function) is UNIFORM in time & space …and also with nonlinear physical scaling!! ((yikes!!)) It’s both crazy & brain-dead simultaneously.
This is BEYOND DELUSIONAL.
Correction is needed.
…But these people may not be smart enough to be correctable, in which case firing leaders is maybe the only viable course. I’m a firm believer that it’s practical to first observe how a person responds to a good slap in the face. Sometimes they straighten up, in which case the problem has been solved without need to fire. And if they don’t straighten up, the alternative exists. (Will it be needed? not necessarily…)
First of All:
This is a high-level offense. Who’s in charge of that department?
The notion that this method corrects biases is LITERALLY INSANE.
What could that person even do or say to redeem themselves now?
It’s not clear if it’s even possible in a remote stretch of brilliance…….
I’m not impressed with the way the community is taking this abuse laying down, waving a white flag of confused surrender. It sends the message that NOAA can take what they want without need to consider what’s fair, sensible, & realistic.
I’ll be digging into the literature on the roots of the physically-nonlinear spatiotemporally aliased, filtered “bias” “correction” fantasy to learn how the thinking evolved to it’s current delusional state.
(…I suspect that inadequate awareness of multidecadal meridional wind in the dense Atlantic sampling between Saharan Africa & Greenland is at the root of the poisoned uniform physically-linear “thinking”.)
I’m kind of glad this very interesting issue came along, because the climate discussion has been getting (increasingly) dreadfully boring.
‘Their conclusion confirms that unrelenting warming has occurred since the mid-20th century’
Again, directly contradicting Hansen. They can’t both be right, so do they propose to discard everything Hansen ever came up with? Let’s hear it if so.
I hope Bob Tisdale realizes: Nick Stokes’ suggestion that the climatological difference is uniform & static in time and space is delusional. That’s an excessively lazy trick to keep the math simple. Where math threatens to get intractable, people IGNORE OBSERVATIONAL DIAGNOSTICS because they get too confused about what to do otherwise. Academics NEVER ADMIT when they are doing this. It’s a culturally wide-spread and culturally-well-accepted manoeuvre. Culturally it doesn’t get judged in academia based on whether it’s REALISTIC; rather it gets judged on whether a mathematically tractable (theoretical) alternative is perceived. The bottom line IN REALITY in the context at hand is that THE ASSUMPTION FAILS DIAGNOSTICS BASED ON OBSERVATIONS. Academics are notoriously unwilling to submit in a case like this. They’re usually smart enough to evade because most intellectual inferiors in their audience don’t vigilantly maintain their cognitive lock on the fact that null hypotheses ARE CONDITIONALLY BASED ON ASSUMPTIONS …assumptions that are false based on observations in this case …something Nick isn’t admitting to Bob (…or himself for that matter).
Very Disappointing..
Let’s get really serious and really focused here:
There’s only 1 statistically significant bias needing correction (Bill Illis is correct) at the global scale of bias and that is the step-change near 1940.
HOWEVER: When the correction is done, it MUST be done in such a way that southern hemisphere fingerprints do NOT contaminate well-sampled northern records where no such fingerprints were observed (e.g. BDO ~1920). This demands an order of magnitude more careful thinking than NOAA, Hadley, or any other organization have done to date.
Had I funding and time for full-time devotion to this problem….
…but since I don’t I’ll spend time strategically making targeted suggestions about features that are demonstrably wrong based on observational diagnostics.
One thing I’ve decided I’ll probably do to provoke clearer thinking is to propose an alternative set of “bias corrections”. This could be fun….
Something I should clarify right away:
Northern HadSST3 is also falsely biased positive near 1920 due to artificial cross-hemispheric projection. I’ll be looking into Hadley methodology to figure out how/why that mistake slipped into the supposed “gold standard” record (“gold standard” only if you’re drunk and only willing to look for keys under lamp-posts!)
I’ll be posting a bunch of links to technical material for interested parties.
Bob Tisdale also mistakenly gave Nick Stokes a point where Stokes was wrong. Tisdale put a strike through some of his original wording based on a Stokes comment, but Stokes was wrong.
GLOBAL ERSSTv4 IS based on GLOBAL HadNMAT2. GLOBAL HadNMAT2 gets a vote — no matter how small — EVERYWHERE in ERSSTv4. That means that IN GLOBAL AVERAGE, ERSSTv4 IS HadNMAT2, with 2 exceptions:
A. a minor deviation determined by the lowess filter parameter.
B. a more substantial deviation where the filter is interrupted — for example before 1886 as I outlined above.
You can see clearly by comparing the following 2 graphs that the ONLY instance where GLOBAL ICOADS SST pattern is dominant over GLOBAL HadNMAT2 in GLOBAL ERSSTv4 is BEFORE 1886.
The key word here is GLOBAL. GLOBAL ERSSTv4 (but NOT v3b2) is constrained to near-match GLOBAL HadNMAT2 BY ARCHITECTURAL DESIGN.
This is a mathematical constraint artificially imposed anthropogenically and it’s based on FALSE spatial assumptions about the ENSO EOF/PC mode …which has to balance surface-subsurface, ocean-land, &/or east-west, depending on the geophysical variable considered — it’s just a zero-sum differentially-balanced axis in central limit.
To sound sensible they’d have to advocate mirrored adjustments (up or down depending on where spatially on the coupled mode) averaging to zero globally. Bear in mind that the BDO has the same spatial mode as ENSO, so this goes all the way up into the low multidecadal range temporally.
All those bounces in the record average to zero and the authors have ignored this important aspect of the global hydrological cycle.
This is a harsh fail and these people have proven beyond all shadow of a doubt that they’re too incompetent to be entrusted with data adjustment responsibilities.
ERSSTv4 should be fully retracted.
I would advise them to do this before any serious people start hammering harder, as it’s easy to see now after only a few days that this whole adjustment scheme is a fragile house of cards that can be brought down with a puff of wind by someone with sufficient time & resources.
What a joke. What’s even more of joke is that people don’t even realize it.
When people get a minute, they should take a look at the paper on HadNMAT2:
Global analysis of night marine air temperature and its uncertainty since 1880:
The HadNMAT2 data set
http://onlinelibrary.wiley.com/doi/10.1002/jgrd.50152/pdf
Cynics can see figures 4 & 6 for the type of trend adjustment entertainment they expect.
Those here to be more serious can at least stop to appreciate this key gem of wisdom buried amongst a whole lot of dull repetition:
“The uncertainty in the height adjustment due to uncertainty in the stability scales with the difference in height from the 10m reference height and is relatively larger in regions where the variability in the stability is larger (e.g., regions with western boundary currents, not shown). The contribution of uncertainty in the measurement height scales with the uncertainty in the height, but is greater for measurement heights low in the boundary layer where vertical gradients of temperature are larger.” [bold emphasis added]
The v4 P1 paper makes it clear (compare correct figure 7b with compromised 7a & also-assumptively-wrong (different set of theoretical false assumptions) 7c) that with v4 NOAA is dismissing (by mathematical construction) this insight which was acknowledged implicitly in the construction of v3b2 (I pointed twice to the relevant graph in P1 way upthread — search in page for “panel (b)” & “western boundaries” and you’ll be pointed straight).
When skeptics insist on the primacy of observations over failed models, no worries administrators as you can easily corrupt the record by lavishly funding a competitive adjustment industry. (their perspective, not mine)
Western boundaries? Who needs them???? (their perspective …and NOT the East’s!!)
For western governments, it’s all about artificially erasing natural western boundaries.
(…and climate propaganda is a big part of the geopolitical strategy)
This passage seriously mislead some of the duller “leading” minds at NOAA:
“[…] measurement errors are almost certainly uncorrelated on decadal timescales. Bias uncertainties, on the other hand, have long-term correlations. As longer and longer periods are considered, the measurement and sampling uncertainties become less important relative to the bias uncertainties, even at times when the measurement uncertainties of individual annual values are large. Therefore, uncertainties in long-term trends are likely to be dominated by uncertainties in the slowly varying biases introduced by changes in instrumentation and analysis methods.”
2011 Reassessing biases and other uncertainties in sea-surface temperature observations measured in situ since 1850, part 2: biases and homogenisation
Click to access part_2_figinline.pdf
What reason is there to assume HadNMAT2 represents the expected value of ERSSTv4??
It’s philosophical. Their definition of bias is f**ked up.
The multidecadal thing they’re measuring isn’t an SST bias; rather it’s an aliased multivariate physical entity. Their false statistical assumptions are pervasive in their culture. If possible at all, it will be a tedious & heroic exercise correcting their philosophical errors.
Here’s another gem quote from the companion paper:
2011 Reassessing biases and other uncertainties in sea-surface temperature observations measured in situ since 1850, part 1: measurement and sampling uncertainties
Click to access part_1_figinline.pdf
“[…] sampling uncertainties. They are largest in regions of high sea-surface temperature variability such as the western boundary currents and along the northern boundary of the Southern Ocean. The sampling uncertainties are generally smaller in the tropics and in the ocean gyres.”
Now that is refreshing awareness of insolation-driven circulation, so maybe some of these people are ready for Dickey & Keppenne (1997).
I was expecting all or mostly bad in this pair of Met Office papers, but that’s a better-than-expected start at the tail end of the abstract.
Nearly all of the uncertainty estimates ones sees in climate studies are totally unbelievable and based upon layers upon layers of assumptions easily proven false. It’s nice to see a candid admission like this:
“Analysis techniques that incorporate information about the correlation structure of the errors have not yet been developed.”
A review of uncertainty in in situ measurements and data sets of sea-surface temperature
Click to access Kennedy_2013_submitted.pdf
And here’s a killer quote:
“At a global scale, bias uncertainties are comparable to or larger than all other uncertainty components from the 1940s to the present.”
With philosophical beliefs like that exposed it’s becoming a lot more clear what’s going on.
Creepy to say the least.
Naive Taxpayers:
Keep paying for the development of a neverending parade of new instruments and measurement methods. The more changes to observing systems, the better the prospects for the bias spin doctors to claim future need for various politically expedient spatiotemporal constellations of adjustments.
You see?:
“A key weakness of historical SST data sets is the lack of attention paid to evaluating the effects of data biases particularly in the post-1941 records. Further independent estimates of the biases produced need to be undertaken using as diverse a range of means as possible and the robust critique of existing methods must continue.”
hehe… hedge your bias bets every which way possible to provide a rich multitude of adjustment options!
These are smart people but they’re untrustworthy.
For v4, how did the people at NOAA decide that NMAT2 — an air temperature record with a stunning array of adjustment issues of it’s own — is some gold-standard expected-value for ICOADS SST??
As with the lowess filter parameter, they probably played around with limited adjustment options until they stumbled on something that gave a shape closer to what they wanted.
Unfortunately for them the cost is lost integrity because diagnostics reveal what they’ve done to be a joke. If they dig their heels in to defend what they’ve done, their credibility will drop off exponentially. If they admit their philosophical error and correct it, they may limit the credibility drop off to linear with a future chance to reverse that unflattering trend.
In the US, responsibility for climate exploration should be transferred from NOAA to NASA JPL where climate is understood and appreciated in a broader geophysical context and where someone might at least think to check that bias adjustments are consistent with constraints from earth orientation parameters. At the very least someone like Jean Dickey from JPL should be empowered to direct NOAA. At NOAA they think they can just ignore geometric axioms & laws (of large numbers & conservation of angular momentum).
PV: this NASA?
OB: NASA has several branches (…that I suspect aren’t exactly cozy interdepartmental friends). At JPL there are some people with well more than a clue …but unfortunately they are also muzzled. Other branches of NASA project the image of a goofy propaganda machine. I can’t tell you how or why such disparate integrity & sobriety levels arose in different branches of the same wider organization. I suggest at least taking care not to conflate the good with the bad with whom the good unfortunately have to share a wide umbrella.
– – – – – – –
Test:
Now does everyone realize the following?
NOAA is so confident that GLOBAL HadNMAT2 is the ‘TRUE’ (unbiased) measure of GLOBAL SST that GLOBAL ERSSTv4 IS REQUIRED TO BE HadNMAT2 with the tiny exception that GLOBAL ICOADS SST is allowed an ever-so-tiny influence on GLOBAL ERSSTv4.
At the GLOBAL scale folks, IT IS SO …and if you’re not LUCIDLY aware of this yet, you have NOT carefully finished doing your homework …and you’ve egregiously abdicated your responsibility to the community to defend the integrity of observations.
I 100% guarantee these statements to be true.
Do your homework and learn for yourself firsthand.
How much work is involved?
Given 2 columns of numbers, can you subtract 1 from the other?
This is serious. NOAA has SERIOUSLY f**ked up.
Like I said on January 2:
“Historically, the release of ERSSTv4 may well mark the end of worthwhile climate discussion.”
If the community let’s NOAA get away with such a simple, transparent error ________ .
…then that’s a white flag and that’s probably a wrap for the climate discussion.
With absolute certainty, adjustment scheme edge effect has pushed the v4 years after 2004 upwards.
HadNMAT2 is strongly biased positive during BOTH world wars.
This (along with untenable infilling across steep Southern Ocean gradients) is corrupting ERSSTv4 spatiotemporal modes.
This makes me wonder:
During war do ships sometimes deliberately log false locations & tracks?
Would there be some reason to make the ship appear more poleward (via fudged coordinates) or equatorward (via fudged temperatures) in logs?
Maybe something systematic is being missed. (Maybe it’s not just different recording practices.)
Does it not make you angry that they would try a uniform adjustment scheme like this that is not even based on bias spatiotemporal modes (…presuming there was an actual ‘true’ record available …rather than the biased & itself-adjusted AIR temperature joke of ‘true SST’ record with its BLATANTLY OBVIOUS wartime biases)?
PV : ‘HadNMAT2 is strongly biased positive during BOTH world wars’.
Do the biases show any correlation with solar cycle activity?
Paul: fudging in war is conceivable, but hard to prove
Meteorological activities in the Atlantic was dangerous work http://www.weatherships.co.uk/WW2.htm
noaa graphs from 2014 and 2015


same search parameters
just 1 year apart
how quickly things change
from: http://www.ncdc.noaa.gov/cag/time-series/global
Without the saved graph, things do disappear, becoming non events.
oldbrew (June 14, 2015 at 7:55 pm) asked:
“Do the biases show any correlation with solar cycle activity?”
I wasn’t going to bother pointing this out, but since you ask:
You’ll see a BDO closer to J-S than JEV (Hale) if you look at the uncertainty estimates plotted in figures 2 & 7 of 2011 uk met office sst uncertainty/bias part 1:
http://onlinelibrary.wiley.com/store/10.1029/2010JD015218/asset/image_n/jgrd16940-fig-0003.png?v=1&t=iaxsnbgi&s=cd154b1bb470459d708fdcf1135089794f4bf9ea
http://onlinelibrary.wiley.com/store/10.1029/2010JD015218/asset/image_n/jgrd16940-fig-0006.png?v=1&s=3c7064f6e9c8c1544f4475dbeccf5a4c5ffb5c02
Related: Recall the BDO in Tsonis et al. (2007).
Advised: Integrate related information from disparate sources.
For comparison:
John Kennedy | June 30, 2011 at 11:54 am |
“What all existing analyses had in common was that none of them assessed the biases in the period after 1941 so this seemed to be the best place to put in the effort and get a better handle on the uncertainties. This is the first time this has been done for an historical SST analysis so we were keenly aware of what has happened when biases in other variables – troposphere temperatures and ocean heat content are the prime examples – have been assessed. In those cases independent attempts to estimate the biases have come up with different answers and getting to the bottom of the differences has driven improvements in the understanding of the data.”
…but recall that HadSST3 inflated 1920 substantially relative to HadSST2 as Bob Tisdale illustrated. Note carefully in John’s (impressively diplomatic) comment that he’s addressing a (frankly unbelievably) serious JC (wow-just-wow how do you even get so divorced from reality-level??) misconception. (Sometimes it’s in everyone’s best interest to stop subtly beating around the bush and simply call a spade a spade. I strongly advise against trusting any quantitative commentary she attempts.) Poor John having to deal with that… He must have been thinking “oh boy…”
ERSSTv4 is based on a philosophically incorrect definition of bias and therefore underestimates WWII bias and overestimates statistically insignificant decadal bias.
‘The buckets lost heat as they were hauled to the deck thus introducing a persistent cold
bias into records of SST’
Is that assuming the air temp was lower than the sea temp at the time – where’s that data?
OB, you can get ICOADSv2.5 SST & HadNMAT2 from KNMI Climate Explorer and compute the difference I’ve illustrated. Note that the difference is positive, indicating sea surface temperatures greater than marine air temperatures.
Note that the only residuals from Sun-Climate 101 are:
1. WWII spike (real bias)
2. ENSO bounces (as expected)
3. ~0.27 to 0.28 degree C step change ~1940 (real bias)
Harsh-tweaking the bias exploration parameters changes neither 1 nor 2.
…and 3 stays bounded between 0.2 & 0.3 degrees C.
There’s NO decadal (nor any multidecadal) bias to correct under ANY scenario.
John Kennedy (UK Met Office rep who played a key role provoking the wrong direction taken by NOAA) should acknowledge this clearly. (If he doesn’t, that will be highly informative.)
Quite a fancy, highly technical, 100% rigorously defensible formal article could be written detailing the various fatal criticisms of ERSSTv4 I’ve highlighted here. At the detail level there’s a lot more to say, but I’ve outlined all of the basics and people with the right background will easily be able to fill in the rest of the picture independently.
Any NOAA delays whatsoever correcting such simple, clear-cut, fatal errors should be regarded with the highest level of suspicion. They’re cornered and it’s crystal clear. If they won’t immediately deal with something so simple & so wrong, they’re written off as incompetent, untrustworthy agents of dark political ignorance & deception. Without delay they should be out admitting, “We made a serious mistake. We’re sorry and we’re retracting ERSSTv4.”
buckets?
seriously?
Bill Illis’ concise 101-level overview:
How it looks on Wikipedia:

Warming / No Warming / Warming / No Warming — alternating ~30 year periods +/- a few years?
ERSSTv4 has downgraded last years El nino
I’m running more diagnostics on bias spatiotemporal pattern and again this turns up:
“The NMAT observations are mostly in the northern hemisphere. One thing I noticed pretty quickly was that northern NMAT2 tracked northern ERSSTv3b2 until about 1969 and then it abruptly switched to tracking southern ERSSTv3b2. This tracking is near-perfect …so why the abrupt cross-hemispheric switch ~1969?“
The interhemispheric pattern switch is turning up again with a vengeance — this time in comparisons directly with ICOADS v2.5 SST.
I’m splitting diagnostics according symmetry criteria:
a) THERMAL EQUATOR
b) BDO long-run attractor (much more complicated than (a))
NOAA can be sure:
It’s not sensible to do a global correction.
All that does is cross-contaminate pattern across the thermal equator.
Bear in mind that when sampling asymmetrically across a balanced pattern, aliasing WILL occur. No “maybe”s here — this is A GUARANTEE.
So this 1969 pattern-switching date that’s turning up again is telling us something about the SHIFTING SPATIAL DISTRIBUTION OF SAMPLING.
Did the proportion of observations on either side of the THERMAL EQUATOR (or BDO or whatever) pass a magic threshold ~1969??
This may not be the exact right question, but this is the sort of question sensible minds will be exploring.
Probably brighter subordinates at NOAA are well-aware of the interpretive importance of such clues, but they’ll be finding no constructive mentoring from their politically corrupted “superiors”.
This is turning out to be a serious piece of diagnostic work, as I suspected it would.
I’m beginning to suspect that the methods used on ERSSTv3b2 must have been more sensible (for example dealing with pattern symmetries/asymmetries) than is generally realized. On the inside (or since fired, not renewed, or transferred to another file) there’s someone of high-level integrity but subordinate rank who’s intimately aware of the methodological corruption. That knowledge may be lost (survival instinct), so it will have to be rediscovered from the outside.
+0.25 degrees C / decade adjustment from ~1985 to ~2005 (total +0.5 deg C)
Got your attention??
ERSSTv4 is based on HadNMAT2, but HadNMAT2 is based on ICOADS 2.5.
So they start with ICOADS 2.5 and add 0.5 deg C to recent decades to arrive at HadNMAT2 and then use that to jack up ERSSTv4….
A whole blog will have to be devoted to exploring all the sketchy shady things being done by the UK Met Office & US NOAA. This is going to take forever…
…north of the thermal equator that is.
I’ve just finished another round of careful diagnostics, this time on the WWII bias spike. I’ve determined that it’s a primary source of corruption of ERSSTv4 EOF/PC1&3. ARTIFICIAL poleward projection of WWII TROPICAL BIAS splashes red map paint along the shores of Antarctica south of Africa in the Southern Ocean. The other source of corruption is poleward projection of centennial tropical trend.
I’m preparing graphs of ICOADSv2.5 MARINE AIR temperature, HadNMAT2 (which is HEAVILY ADJUSTED ICOADSv2.5 marine air temperature), & ERRSSTv3b2 (which precedes ERSST corruption by HEAVILY ADJUSTED HadNMAT2).
Remember what NOAA is telling you folks:
NOAA insists that HEAVILY ADJUSTED AIR temperature is a MUCH better indicator of sea surface temperature than (get this!) measurements of sea surface temperature.
…Yes you read that right.
…and so therefore they reason that heavily adjusted air temperatures should be used to heavily adjust sea surface temperatures. Makes sense if you’re campaigning politically…
A hefty 0.5 degrees Celsius adjustment of ICOADSv2.5MAT north of the thermal equator defines the HadNMAT2 that helps corrupt the last 30 years of ERSSTv4.
There have been a lot of blog posts about Karl et al. (2015), but it’s remarkable how shallow they’ve remained given the extremely rich array of easily demonstrable corruption of ERSSTv3b2 to arrive at ERSSTv4.
I have to be honest: This makes me acutely suspicious.
The lukewarmists have grown so loyal to the alarmists. It starts to seem like they’ve become so diplomatic and polite that they consider it inappropriate to point out serious errors. It’s like there’s some desire to keep the criticisms shallow & superficial so that they’ll look petty & unimportant to the public.
Still, it’s not entirely clear whether the dark lack of deeper exposure of ERSST spatiotemporal pattern corruption is due to dark ignorance or dark deception.
I’m leaning towards the latter as there’s NO acceptable EXCUSE for being ignorant of such transparent, trivial corruption.
Given how transparent & trivial the pattern corruption is, the only sensible option is to conclude that there’s a strong political will to keep the criticisms shallow, superficial, & misleading.
I take this as further evidence that the lukewarmist movement has been neutralized.
Effectively the lukewarmist movement has been absorbed into the alarmist movement by a carefully orchestrated campaign that has played out over a period of about 5 years. I would say it’s time to directly accuse the central blogs of doing this on purpose: They’re working for the alarmists and the mission is to slowly convert. They’ve been highly successful in executing this mission. Naive people are fooled by the tactics employed.
…but fortunately it doesn’t matter what naive people think.
–
graphs clarifying recent MAT divergence (due to heavy adjustments) forthcoming …and there’s a solar twist on this story that just happens to fall right in the middle of the range of (raw & hadjusted) MATs… in short: hadjustment 101… (where h = heavy…) …and to clarify we’re talking about HadNMAT2 north of the thermal equator… remember that NOAA’s ERSSTv4 piggybacks on these (heavy, so not as well-hidden as they might hope) hadjustments
the lukewarmists are so loyal to the alarmists that they don’t dare point this out
It appears feasible to use a multivariate ENSO index (MEI) to correct biases. According to a pilot investigation I’ve just done, there would be downward adjustments ~1915 – ~1946 (especially during WWs I & II), 1877-1884, and after 2000 and brief upward adjustments in the mid-1960s & mid-1990s. I’ve checked the EOF/PCs and this looks quite promising. The degree of concordance is remarkable. I’ll pursue this when time permits and report. This is a sensible way to constrain tropical decadal bias to not wildly deviate from ENSO (the dominant tropical mode). Serious problems with HadSST3 (revealed by careful spatiotemporal diagnostics) could be corrected using this method.
This is getting more & more clear.
With v4 they got the WW I & II spatiotemporal adjustments exactly wrong because of the stupid uniformity assumption (such a stupidly ridiculous assumption — this needs to be called out with all due assertiveness).
WWI is biased positive north of the thermal equator.
WWII is biased positive south of the thermal equator.
They got the adjustments exactly wrong in v4. Why? a false assumption — one that diagnostics reveal clearly. Why would they be doing adjustments so easily proven false by 101-level diagnostics? I think the answer is that the media sets the bar of what they can get away with and certainly the media wouldn’t have any clue whatsoever about any of this stuff.
If any academics are paying attention and understanding: There’s scope here to write up a major landmark paper.
SCD = Solar Cycle Deceleration
marine air & sea surface temperatures (MAT & SST)
north of thermal equator (8°N)
break it down
deceleration
deceleration
deceleration
celestial ratio….
(don’t overexert yourself all at once mainstream climate science…..)
CeleRatio 101??
This is a ratio not only in time, but also in space.
This is about the pacing & spacing poleward waves.
Academic Tip:
The AMPLITUDE of the empirical BDO estimates SPATIAL SAMPLING BIAS.
(Remember that BDO has ENSO spatial pattern (the spatial root of temporal aliasing).)
BDO sampling bias is stronger SOUTH OF THE THERMAL EQUATOR …and before 1969.
more abstractly educational illustrations forthcoming…
—
Left-Wingers:
Please calm down and be sensible.
Nature’s beautiful and although it’s instinctive to look away from blinding light, it isn’t helpful denying nature the place nature deserves on anthropogenic pedestals.
What kind of a thought process does it take to walk a climate scientist to water?…
SCD = solar cycle deceleration
deceleration
deceleration
DeCeleRatioN
CeleRatio 101
celestial ratio
celes tial ratio
celes dial ratio
solar dial ratio
solar cycle ratio
ratio of length of solar cycle to length of last solar cycle
rate of change of solar cycle length
= solar cycle deceleration = SCD
That’s modes 1, 3, & 4 combined (in unrotated variable-space).
ENSO’s mode 2.
The integral of ENSO (mode 2) is bounded by SCD (mode 1, 3, 4 combo in unrotated space).
The variance of ENSO is bounded by mode 3 (Southern Ocean south of Humboldt Current contrast with southeast Greenland (heaviest snowfall, runoff) matching core angular momentum matching stratospheric aerosol optical depth tower clustering matching intersection of decadally-cyclic semi-annual equator-pole & annual interhemispheric heat engine volatilities).
It’s ALL the sun.
It’s just a matter of RECOGNIZING SPATIOTEMPORAL STRUCTURE: limits, envelopes, differentials, integrals — i.e. basic stuff, easy to recognize working with complex numbers, geometric axioms, laws (of large numbers & conservation of angular momentum) and NOT falsely assuming stationarity, which is a SILLY assumption to make about TURBULENT cycles (…which aren’t perfect circles).
(sarc) Maybe if I include CO2 as a key word??? I’m going to BE SURE to include “CO2” and “carbon dioxide” in the title of my next article to MAKE SURE it turns up in climate “science” net searches. (/sarc)
AMO is the contrast of RI & SCD. (Academics: Try a varimax rotation.)
RI (not CO2) is mode 1.
RI = Sunspot Integral
marine air & sea surface temperatures (MAT & SST)
ERSST, ICOADS SST&MAT, HadNMAT (N = night)
SOUTH of thermal equator (8°N)
Flipping from 1 side of the equator to the other:
2 sides of 1 climate coin ….thermally equated in long-run central limit, but with turbulent gyrations (gyre-ratios) asymmetrically aggregating downscale spatial aliasing of temporal solar activity (…spatiotemporally physically-aliased across multi-axial (x,y,z) multi-state (vapor, cloud, water, precipitation, ice) multi-media (land-sea-air-ice) differentials exemplified by the mode 2 (ENSO/BDO) surface cross-section of the meandering circulatory hyperloop)…
Basically it’s persistence of poleward hot water showering (short in hydrological laymanese for aggregate wind-driven currents, ice transport, welling, evaporation/cooling, cloud reflection, advection, precipitation/warming, ice accumulation, later melt/runoff, etc. etc. etc…)
…with geographic aberrations shaped in aggregate by changes in solar pulsing.
The myriad details are just budget-allocation-shuffling across line-items.
The budget AS A WHOLE doesn’t have such turbulent degrees of freedom…
In long-run temporal aggregate there’s just an integral, but neither are shorter-term spatiotemporal departures free of constraints. There’s an aggregate pacing & spacing of zero-sum spatiotemporal disturbance that keeps redefining the potentials rocking the downscale (ENSOic) turbulence, thus limiting it’s spatiotemporal integral (circulatory rate & extent).
Land & ocean can find an equilibrium (shaped by geography) at any pulse rate, so aggregated turbulent disturbance tracks pulse changes (e.g. multidecadal solar-pulsed, hemispherically-asymmetric (geography-shaped) wave-breaking & eddy diffusion).
So we have to differentiate between accumulating heat in the body and pulsing that redistributes that heat between physically-contrasting appendages in the circulatory hyperloop.
So in short it’s not just the long-run accumulated energy input, but also downscale temporal accumulation of spatiotemporal (ENSOic) aliasing of that solar energy input into flux-governing spatial gradients.
When we sample ONLY CROSS-SECTIONS of the circulatory hyperloop (e.g. unfrozen sea surface), we alias (potentially misleading) spatial asymmetries (including water-state (latent) asymmetries) into the temporal record …….misleading if misinterpreted.
The wake-up call for climate scientists is that the sun not only defines the integral but also paces the circulatory hyperloop AS A WHOLE.
Sun: 82% of the variance
ENSO: 18%
The other wake-up call is that this isn’t conjecture; it’s observed …and one implicitly insists on the violation of geometric axioms & laws (of large numbers & conservation of angular momentum) by denying this ….and that helpfully informs about competence & trustworthiness.
Background:
• ERSST EOF 1234
• elaboration on mode 3 …including a link to the historic public introduction of this beautiful landmark insight by Dickey & Keppenne (NASA JPL 1997)
Reality Check:
If you think ERSSTv4 is bad, HadISST & HadSST3 are even worse.
The fight has been fought and the outcome is no contest:
ERSSTv3b2 remains unchallenged top dog.
ERSSTv3b2 is the record most respectful of EOP (earth orientation parameters) & the multivariate geophysical record more generally because it’s the record least demanding of violations of geometric axioms & laws (of large numbers & conservation of angular momentum).
ERSSTv4 failed so badly on several counts (I haven’t even presented a dissection of the distortion of recent decades, which plausibly (no exaggeration) qualifies as a technical record falsification) that the only sensible conclusion is either spiteful – even vengeful – hubristic corruption or gross incompetence …to the point where you possibly & perhaps probably need to fire someone in high office to restore an atmosphere conducive to integrity.
This is the darkest chapter to date in the climate sagas, by far.
I advise NOAA to fully retract ERSSTv4 to avoid being dismissed as an agency hubristically drifting uncorrected towards damning political corruption.
Attention Returns Department:
product sufficiently defective to necessitate swift recall
Like I wrote on Jan. 2:
“We’re guaranteed to learn something about the honesty & integrity of NOAA because of this slip-up.”
We’re here to learn about nature.
Sometimes we learn about human nature.
John Kennedy | June 7, 2015 at 8:53 am | wrote:
“The new ERSST paper with its comparisons of various SST data sets is an important part of the ongoing understanding of uncertainty in the historical SST record.
What these studies show is that there are uncertainties in these records, but that they are limited.”
I already have about 1.5 years-worth of thusfar unshared material on this topic.
Illustrating is going to be thoroughly exhausting.
There has to be a smarter, more efficient way…
The probability that we collectively fail on this file (due to miscommunication) is considerable.
I’m doing my part to raise the priority level, but the harsh constraints on my time & resources make it look probable that I will be able to do no more than strategically guide abstractly.
Even where I would prefer to gracefully apply subtle tact and afford face-saving opportunity, time-constraints often force the prioritization of blunt expedience out of sheer practicality.
If others with adequate aggregation criteria foundations are perceptive, sensible, and vigilantly steadfast in their rejection of statistical inference based on false assumptions, this will be more than sufficient. If they are not, then the darker side of human nature will prevail …and of course that’s a normal risk at every evolutionary step.
I think this era of history will be remembered by enlightened future minds as the era of null governance …as in steering by building false assumptions into null statistical inference models to engineer a seductively deceptive illusion of objectivity that is philosophically incorrect but undetectable (due to inadequate philosophical foundations to support more sensible application of numeracy) to nearly all of the current human population.
Improving numeracy is probably feasible at the century-millenium timescale, but overcoming philosophical errors obstructing sensible application of numeracy — e.g. inference severely misinterpreted as some supposed gold standard of objectivity when it is founded on false null model assumptions — will probably be a neverending battle that will only scale with evolving capacity.
Now, temporarily turning attention to adjustments to the last 30 years — (….before getting back to documenting spatial pattern corruption, writing up EOF/PC1234 stuff from last year’s analyses that were never publicly communicated, and refining north-south multidecadal wave animations….) — don’t waste this learning opportunity — ask questions if Bob Tisdale doesn’t understand:
A.

B.

C.

1. Note that (upside-down) A’s shape matches B’s lowess 0.1 shape, which summarizes the black line in C. (IMPORTANT: See instruction #2)
2. UNDERSTAND that the black line in C IS HOW THEY GET B.
Otherwise you can’t and won’t understand ANYTHING about the adjustments …Period …and frankly reading the comments at wuwt & ce it’s not clear if ANYONE gets this, so frankly things are not looking very promising if the broader community goal is to hold NOAA to accountability …and to be even more blunt & frank I’m beginning to suspect the central lukewarmist blogs are running alarmist cover to make it look like there are no valid skeptic criticisms of v4. I sure hope I eventually will be given good reason to dismiss the latter suspicion (…maybe after people DO THEIR HOMEWORK AND TRY AGAIN).
3. The orange line in C shows the FULL interannual variance that IS MISREPRESENTED under the FALSE SPATIOTEMPORAL VARIANCE STRUCTURE ASSUMPTIONS of B. The adjustments illustrated in A are NOT JUSTIFIED because the orange line in C BOUNCES AROUND the 0 line in it’s NORMAL interannual course. I’m concerned that people will not understand that you DON’T EVEN NEED Sun-Climate 101 to determine this (Remember that Bill Illis called them out on this too — see above) …so DO take care to NOT misunderstand. You can vary the diagnostic parameters empirically as aggressively as you want more than a dozen other ways to arrive at the exact same conclusion.
4. Finally there’s the filter end-effect, which unjustifiably cranks up the trend at the very end of the time series. This shouldn’t require any coaching …but maybe it does.
I’m going to stop there for now and just observe whether anyone gets more serious and realistic about this, as observing what happens next with a checklist in hand is going to yield some quality information about what’s going on at the central lukewarmist blogs…..
Are they running lukewarm cover for NOAA’s alarmist record-straightening?
We’re going to find out.
We’ll probably never have an opportunity as clear-cut & simple as this.
The math is so simple it can be done in a few spreadsheet columns, so we’ll be able to rule out ignorance and assess for deception.
I’m looking forward to gaining helpful, useful information from this trivial assessment.
Let me try to bias the outcome right now with a provocative forecast:
I suspect we’ll arrive at a crystal clear deception judgement…. and that will be quite satisfying….
One other thing I want to at least briefly note is that the MAT adjustments before ~WWI are really sketchy and the MAT authors sound genuinely, openly, transparently, & honestly confused about this. Most of the discussion focuses on changing ship heights and a flotilla of assumptions that have to be made to explore this. At least keep this in mind if anyone ever starts getting too determined to impose more widely-spread (shamefully or shamelessly misguided – not sure which) belief that those air temperature records represent ‘TRUE’ SST.
solar activity & interhemispheric temperature contrast sampling (ERSST, ICOADS, HadNMAT) across thermal equator; -LOD; Globigerina bulloides (Black+1999,2007)
ICOADS sampling (aliasing) clue: interhemispheric (across thermal equator) variance structure differs before & after 1914 opening of Panama Canal. Note the coherence with -LOD and recall Sidorenkov’s work on Antarctic Ice Specific mass.
The key to forecasting decadal IPO is tracking the BDO in space and noting how it sits on the ENSO spatial mode (either physically biasing up or down). The BDO was coupled to the powerful interhemispheric Findlater Jet when the Chandler wobble reversed phase.
The annual interhemispheric heat engine pumps hardest where Eurasia (land) contrasts with the Indian Ocean (sea).
The BDO was hemispherically as asymmetric as it has ever been (during the record) when the Chandler wobble reversed phase. It was concentrated in the southern mid-latitudes from -10 to 240 degrees East. The pattern is an interhemispheric land-sea mirror image of Eurasia across the thermal equator into southern oceans. ((Are you hard-wired to not be able to let this information sink in?))
Remember Tsonis’ synchronization?
That’s because BDO heat coming out of the oceans enhances ENSO atmospheric teleconnections
…but it can do so asymmetrically depending on how BDO is distributed spatially.
…and like a dead-beat dad BDO just wasn’t there to shower and nurture the Dust Bowl…
Bet you didn’t know that.
Do the math geniuses:
1.25*6.4=8
Do that twice back-to-back and you’re upside-down to where you were…
long-distance relationships & interhemispheric coupling
Who would have thought dad left mom and went off to the southern hemisphere?…
16 long years of separation…
…and things were upside-down (2*6.4+3.2) when he came back.
Are climate scientists ready to learn from EOP (earth orientation parameters)?
Let’s be realistic:
Most of them aren’t.
Let’s be more realistic:
The overwhelming majority of them aren’t …and never will be.
Recruit the help of NASA JPL (not NASA generally, but JPL specifically).
I can guide automation of a spatiotemporal algorithm that spatially tracks resonance at all timescales.
…but I doN’T trust normal dull climate scientists. ONLY explorers willing & able to have a very well-informed clue about EOP (including Dickey & Keppenne (1997) Figures 3a & 3b ) can finish solving spatiotemporal climate puzzles.
Dust Bowl scale hydrological failures are a big deal in North America.
California droughts are directly coupled to IPO.
Decadal IPO can be forecasted using spatial info about BDO.
USA doesn’t take this lightly.
all those vicious blog activists from California & the western USA in general…
see what they have to lose?
((hint: water))
Bill Illis June 22, 2015 at 6:45 pm
=
This adjustment better be right.
I’m tired of history being re-written just to serve someone’s personal viewpoint.
There should be a point where criminal consequences are used for people who adjust history just because their personal opinion goes a certain way without proving it beyond a shadow of a doubt.
All of these adjustments to history are now costing the human race $100 billion at a time which rises to the level that adjustments better be f’ing right or there needs to be very very serious consequences.
=
Don’t worry Bill.
Put it in perspective.
An alien heart has more intelligence than a western mind.
intermodal interhemispheric unbiasing:

“It is commonly assumed that NMAT and SST anomalies should be similar on seasonal and longer timescales.” — http://www.ocean-sci.net/9/683/2013/os-9-683-2013.pdf
Anomalistic ignorance of wind field orientation & strength isn’t helping …and
anomalistic ignorance of differential wind field coupling to MAT & SST manifolds also isn’t helping…
What will they realize when they pause reflectively to carefully interpret their unbiasing?…
(hehe….. to be continued……)
“4. Methods
a. Analysis of SST–NMAT differences
In order to compute bias corrections we made several assumptions. We assumed that air–sea interactions on large time- and space scales were the same over historical periods as over our most recent period. Specifically, we assume that for each calendar month the relative shape of observed SST–NMAT differences is constant. Any changes in the magnitudes of the patterns were attributed to measurement or instrument changes, and these changes are assumed to affect only SST.”
Bias corrections for historical sea surface temperatures based on marine air temperatures
Click to access Smith_Reynolds_2002.pdf
d = SST – NMAT
“The largest d extremes occur in winter, off the mid-latitude east coast of continents where very cold air may move over much warmer ocean waters (e.g., Trenberth et al. 1992). Weather events responsible for these large d values may have timescales of several days, and sampling during such an event would not be representative of the climatic monthly value of d. Negative d extremes are smaller, and tend to occur in the summer when warm continental air may move over cooler oceans.”
“Most outliers are found in the Northern Hemisphere, where during winter arctic and continental sub-polar air masses sometimes move over the warmer oceans.”
“Climate variations such as the North Atlantic oscillation may also cause changes in the SST–NMAT difference.”
“Our C estimates for January have largest values in the extratropical Northern Hemisphere, especially in western boundary regions.”
“Because bias is primarily caused by systematic changes in sampling methods, changes in the coefficient that we relate to SST bias should have little variation on timescales shorter than decades except, as noted by Parker et al. (1995), during the 1940s. In addition, the results of Christy et al. (2001) suggest that differences of less than 0.18C may not always be related to measurement bias. Thus, we decided to smooth the annual coefficient estimate using straight lines.”
“When we do not adjust NMAT as discussed in section 2, our computed 1854–1941 bias correction is about constant, and the annual and 608S and 608N average is similar to the FPK84 average. The slope of the SR SST bias correction shown in Fig. 5 is a direct consequence of the adjustments to NMAT, which are strongest in the nineteenth century.”
— SR2002 (linked above)
They knew better back then.
Administrative “thinking” has apparently since drifted towards desire to adjust statistically-insignificant “biases” …presumably born out of some desire & expectation to have the record match CO2?
Administrative minds are terrible with these sorts of things. Administrators are accustomed to being pushy and forcing suboptimal solutions out of a practical desire to simplify the efficient pursuit of an agenda by ruling out inconveniences. Untempered, that sort of blindered managerial spirit opposes the free mindset needed to efficiently learn from exploration.
…So an exploratory question arises:
What was different with the agenda in 2002 compared to now?
Digging into more of the literature is sure to help clarify the evolution of the thinking …and the contaminating “thinking” too…
It will be remarkable if I simply learn I’ve quickly rediscovered FPK84 independently from scratch. That would certainly cast a historically informative light on what has been going on with (seemingly corrupt & desperate, as if having lost all sober objectivity and capacity to diagnostically self-check) administrative record adjustment philosophy in recent years.
“Fields of bias corrections […] show concentrated maxima off the east coast of Asia and North America during the boreal winter. In those regions and times, the prevailing winds bring cold and dry continental air over warm western boundary currents, enhancing the heat loss from buckets due to latent and sensible heat loss.”
“We made several assumptions in the development of our corrections. Our most questionable assumption is that historic changes in SST–NMAT reflect only SST changes.”
“Our validation studies suggest that more work is needed to fully understand the local differences.”
— SR02
“The correction uncertainty is largest in the nineteenth century and in the early 1940s. In the nineteenth century uncertainty is large because of sparse sampling and the need for strong NMAT adjustments. Increased uncertainty in 1942–45 is caused by decreases in sampling and nonstandard NMAT measurement practices in that period.” — SR02 [bold emphasis added]
_
“Anomalies were damped toward a zero anomaly when sampling was insufficient to analyze the climate-scale signal. […] In SR05 these decisions were conservative to ensure that data noise would not contaminate the analysis in sparse-sampling periods.”
“In Smith et al. (2005) error estimates were used to show that most Arctic and Antarctic anomalies are unreliable and those regions were removed from the global-average computation. “
Click to access Improvements-NOAAs-Historical-Merged-land-Ocean-Temp-Analysis-1880-2006_0.pdf
_
“South of 45°S there is little in situ data in COADS, between the Antarctic Circumpolar front and Antarctica. That front, located between 40°S and 50°S, separates a nothern and a southern region, which may not be reliably correlated with each other. Thus, we set our southern limit to 45°S.”
http://journals.ametsoc.org/doi/pdf/10.1175/1520-0442%281996%29009%3C1403%3AROHSST%3E2.0.CO%3B2
Sampling Uncertainty:
“Typically the average correlations are highest in the tropics, particularly in the eastern Pacific. They are lower in the region of the western boundary currents, on the northern boundary of the Southern Ocean and at the edges of the field near areas of seasonal sea ice cover.”
Got that?
Look at Figure 1(d).
“A map of […] the sampling uncertainty of a grid box average calculated from a single observation, is shown in Figure 1. Sampling uncertainties are highest in the western boundary currents and along the northern boundary of the Southern Ocean where SST can change rapidly and spatial temperature gradients are strong. Sampling uncertainties are smaller in the tropics — particularly in the Indian and Atlantic Oceans — where the spatial and temporal correlations are large. In the eastern tropical Pacific there is an area of higher variability in the region of the El Nino cold tongue. In the North Pacific the Kuroshio extension increases sampling uncertainty as far east as Hawaii. The pattern and magnitude of the sampling uncertainty is similar to that calculated from sub-sampling complete satellite data (Rayner et al. [2009]).”
Now:
Try to put 2 & 2 together.
Sure there’s bias during WWII …BUT IS IT SYMMETRIC??
Ah…
Hint: It’s not …and if you diagnostically (or maybe I should say DIAGONALostically) SORT the observations reflectively (hint, hint) to check for pattern, lo and behold, you’ll find a simple TRIANGLE ….diagonal, triagonal… ….triagnosics anyone?… NO(!) wwii spike — just a plain triangle …with a well-known El Nino at the apex.
Prescribed: interhemispherics …a new class of climate drugs to alter your perception.
Go for it Kennedy…
Take some…
…And for the 1st time: SEE the triangle ….the simple interhemispheric bias triangle.
Who would have thought that all of these “nonstandard recording practices” would cancel interhemispherically to reveal something so simple as triangular sampling bias?
Sometimes you just have to laugh at the silly mainstream notion that ONLY instrument changes cause bias. According to that view, (sarc) NOTHING natural EVER happened to coincide anthropogenic sampling practice changes …and during eras punctuated by lots of technological change/switching/outages/whatever, it’s guaranteed that nature TOOK A NAP FOR THE WHOLE ERA AND DID NOTHING (/sarc). Right? (silly academic philosophizing, divorced from careful empirical diagnostics…)
Various recording practices/outages/changes/whatever only scramble the code. They don’t erase it. They just invite diagnostic decoding.
In this case, by looking across the thermal equator, a common source of signal scrambling is cancelled to reveal spatiotemporal aliasing on a key climate mode (NAM). NH ICOADS SST is biased low before & after WWII, while SH ICOADS SST is biased high during WWII. Prior to then the uncorrected (biased) record clearly reveals the aliasing WITHOUT asymmetric wartime decoding, underscoring that conventional unbiasing shifts the interhemispheric record intermodally.
After ~1950 (better sampling) no anti-NAM decoding is needed …and there’s statistically significant decadal bias to correct in exactly NONE of the following: global, north, south, interhemispheric. (Do the diagnostics and see firsthand.)
…And that’s how to do COWL (cold ocean warm land) properly (…nevermind the 2009 publication that tried but missed …by aliasing (and getting distracted by) interannual).
SST Variance:
Sun: 82%
interannual: 18%
After properly correcting for WWII & NAM-aliasing, sun goes higher (…& interannual equally lower).
Just to clarify a little further:
The (academic) uniformity assumption fails systematically before ~1950.
The more academia and others try to accelerate the CO2 (gravy) train, the bigger the crash when it finally hits the buffers at the end of the line aka reality.
They’re a little slow OB.
We’ll slow-walk them through it.
Later I’ll break the animation down into still frames so they can cut-&-paste and overlay.
They’re not paying sufficient attention to ENSO’s moments.
You see, ENSO has both a mean & a variance …and they haven’t yet realized that both ENSO mean & variance have a role in shaping what Box nicely outlines…
Greenland T’s a mixed mode:
(to be continued…)
All they seem to have ‘learned’ so far is that if the real-world data doesn’t agree with the models, alter the data and say ‘look – we were right all along’. LOL.
From Doug Hoffmann: ‘4. Finally, over the period of the 26.5°N observations, the AMOC has been declining at a rate of about 0.5 Sv per year, 10 times as fast as predicted by climate models.’
– See more at: http://www.thegwpf.com/atlantic-oceans-circulation-yields-inevitable-surprises/
Paul this may be of interest:
Interesting yes Andrew.
This character uses Metallica’s “Ride the Lightening” icon.
…but Metallica’s “Kill ‘Em All” icon better matches the vengeance of NOAA’s violent spike.
“Motorbreath“ (lyrics):
“Don’t stop for nothing it’s full speed or nothing
I’m taking down whatever is in my way”
…and of course “Jump in the Fire“ (lyrics) reads evangelically like CAGW conversion instructions:
“Jump by your will or be taken by force
I’ll get you either way
Trying to keep the hellfire lit”
These people just don’t know how to sensibly restrain their darkest urges.
They’re determined to put red stains in the Southern Ocean …and they’re the double-or-nothing-every-time-no-matter-what types.
They have the nerve to suggest we’re the bad guys.
Let us pray…
LOD NAO ICOADS ERSST HadNMAT; SCD = solar cycle deceleration; RI = sunspot integral; Gb = Globigerina bulloides abundance = Atlanctic multidecadal (AMO, AMOC) proxy
Does NOAA realize that interhemispherically their global temperature “unbiasing” of spatiotemporal NAO aliasing amounts climatically to intermodal discovery that “It’s the sun”?
They’re concerned more with politics & the next election than with clear vision & integrity.
They want you to see a sea of red …and nothing more ….forevermore.
Here’s what I’m planning…
We have the new “adjusted” ERSST.
Soon we’ll also have the new “adjusted” sunspot numbers.
All of this is happening because there’s an American election coming.
If time permits I’ll animate the multidecadal sun-climate wave (misnamed “stadium wave” by dark sun-climate [laws of large numbers & conservation of angular momentum] denial agency) before & after ERSST & sunspot number history “revision”.
interhemispheric (north-south across the thermal equator) intermodal sun-climate “unbiasing”:
What a blind bunch of innumerate clowns …or they coldly calculated sharp-as-a-tack to secretly protect their nation if you prefer a noble conspiracy theory. Everyone can choose what they want to believe = what it means to be free. Everyone please do feel free to believe in a lack of violation of the laws of large numbers & conservation of angular momentum.
PV: ‘Soon we’ll also have the new “adjusted” sunspot numbers.
All of this is happening because there’s an American election coming.’
Of course American elections are important, but who knew they could change the behaviour of the Sun 😎
Saw this today, thought the SH patterns were just great
https://twitter.com/bigjoebastardi/status/616189056192372736
as/re:
‘Soon we’ll also have the new “adjusted” sunspot numbers.
All of this is happening because there’s an American election coming.’
Of course American elections are important, but who knew they could change the behaviour of the Sun ”
I wonder who the corporatocracy
will trot out as our “new and improved leader” this time?
The thing to note here:
• Before the opening of the Panama Canal, the “biased” ICOADS SST & MAT interhemispheric sampling uncannily tracks the integral of the North Atlantic Oscillation (NAO).
• After the opening of the Panama Canal and after “unbiasing”, “corrected” SST & MAT follow the sun.
So the question I’m asking NOAA & Hadley is:
Do you adequately fathom what the Panama Canal did to interhemishperic MAT & SST sampling??
I’m encouraging them to explore spatiotemporal confounding of “biased” sampling methods & shipping routes and then write an interesting paper on why the “biased” interhemispheric ICOADS MAT & SST estimates follow the NAO integral.
The overall objective in abstractly encouraging them to pursue this is to raise broader appreciation for & awareness of the simple role of wind in non-linear (3rd power) sun-driven spatiotemporal ocean-atmosphere coupling (both estimated & ‘true’).
I suspect they have insufficient awareness of the role wind (3rd power) plays in determining the location of land & sea ice margins.
Bear in mind that the whole THC (thermohaline circulation) — including AMOC (Atlantic Meridional Overturning Circulation) — is shaped by the shifting location of the ice margin.
Mainstream interpretation of the (time-space) confounded sampling to date has been retarded by clumsy lensing based on delinquently stubborn false spatiotemporal assumptions that fail 101-level diagnostics.
Equator-pole & pole-pole gradients are straight-up NOT FREE to evolve randomly according to the naive, misleading mainstream stochastic models that COMPLETELY IGNORE rigorous constraints on probability density functions (PDFs) from annual & semi-annual earth orientation parameters.
For years this has been THE issue and I’ve become increasingly suspicious about why the lukewarmers in particular are SO insistent that the modelers should be given a pass on WELL-RECORDED cyclic volatility. It makes NO SENSE WHATSOEVER to give them such a pass UNLESS the goal is full-on sun-climate corruption …AS IF CO2 RATHER THAN INSOLATION (!) controls equator-pole & interhemispheric heat engines.
I would say it’s well past time to call the lukewarmers out as full-on corrupt.
If the lukewarmers understood what I’m saying about the Panama Canal, they would immediately exploit it to rewrite EOF1/PC1. I question whether people possess the awareness needed to appreciate the importance of this. Rigid coherence with the sun-climate attractor can be re-hinged with one clever adjustment onto a CO2 framework using nothing more than the Panama Canal. (I don’t think they realize this yet.)
Updated:
Multidecadal-Centennial Sun-Climate Variance
North of Thermal Equator: 81.49%
South of Thermal Equator: 83.15%
Global: 82.43%
The remainder is BDO & ENSO.
Remember that we’re currently in the upswing of BDO.
None of the EOF/PC combos matches CO2 even in the wildest imaginative stretch of integrity
…but a clever Panamanian adjustment can make it so for a steep consultant’s fee. Interested parties can get in touch with me to discover the price at which I sell out. I can tell you exactly how to do the adjustments that will make EOF1/PC1 perfectly match CO2. Conveniently the same single Panamanian adjustment destroys every single skeptic talking point you’ve ever head about multidecadal oscillations. I’ll never volunteer this information to anyone …and I’ll never record it anywhere …but for a steep, self-indulgent fee (so I can retire), it could become your private leadership edge on the evangelical guideway of global salvation. Can you afford to buy that leadership edge Mr. President? …and can you afford not to?…
Van Halen’s (1984) Diamond Dave advises CO2 modelers on mother nature’s weaving ways …and adjustments:
“[…] we’re runnin’ a little bit hot tonight.
I can barely see the road from the heat comin’ off of it.
[…] reach down […] ease the seat back.
[…] […] You’l lose her in the turn. […] Panama…“
NO – don’t do it PV…LOL
OB,
Metallica’s “Jump in the Fire” lyrics exactly describe Lukewarmism & lukewarmist blogging:
“[…] the depths of my fiery home […] join our sinful kind […] pull you down into this pit […] hell in my eyes […] death in my veins […] feeding on the minds […] my disciples all shout […] they always shall obey […] do just as I say […] keep the hellfire lit […] stalking you as prey”
Candid, provocative, brutal honesty:
I’ve come to regard Lukewarmism as Satanic:
“Living your life as me, I’m you. You see?
There’s part of me in everyone.”
— Metallica – “Jump in the Fire”
I recommend that sober, sensible leaders step away from the flames.
Clean, healthy respect for & appreciation of nature & natural beauty is the way.
–
More clean nature appreciation on the way:
• I’ll have multidecadal interhemispheric heat engine map-animations based on updated records forthcoming soon…
• I’ll have an even tastier heat engine treat to share late in the (northern) summer….
I’ve advised the community many times of the following, but it seems to have registered with few (if any):
1. In long-run central limit BDO (bidecadal oscillation) shares a spatial pattern with ENSO and we’re currently on the upswing of BDO. (In the current specific instance of BDO, expression is notable in the northeast Pacific sector of the long-run BDO attractor. Those calling the current regional feature “The Blob” appear to have neither appreciated nor understood it in the broader context of the BDO.)
2. SCD (solar cycle deceleration) is still increasing NH SST (northern hemisphere sea surface temperature).
Observations:
The new graphs above include 17 more months of sunspot numbers than any illustrations I’ve shown previously.
Wake-Up Call:
Note that NH SST is currently tracking SCD and getting a boost from BDO.
Bill Illis (June 24, 2015 at 5:58 am) wrote:
“The entire climate science community should repudiate these adjustments and ask for changes to be made at the NCDC leadership.”
…and it will be damningly informative if they don’t, helpfully mapping the extent of incompetence & political corruption.
PV: see also the next comment after Bill Illis:
The problem goes much higher than NCDC leadership….“If you aren’t lying, you aren’t trying.”
With v4 is NOAA deliberately provoking Hadley to revise their interwar suggestion downwards?
Averaging high-biased HadSST3 with low-biased ERSSTv4 would give something closer to unbiased ERSSTv3b2 during the interwar period.
There’s a lot more to be said about a whole lot of things on this file. It’s going to take years.
OB, yes I did think about quoting some of that:
“The lies, half-truths, and […] deceptions are now flowing fire-hose like from the White House on down through all the politicized agency and department heads. It is a full onslaught of Information Warfare spewing propaganda lies from all these agencies to support the radical agenda […]” [bold emphasis added where commentary pierces target with merciless accuracy]
I 100% concur with this forthright, concise description of what’s happening.
Somehow wuwt & ce were lured into the service of this orchestration.
It’s creepy and it spawns mature cynicism.
I recommend a 2-pronged approach:
1. Call out the dark agency, but:
2. at the same time healthily explore the beauty of nature.
We can’t succumb to the darkness.
We have to keep shining light.
There’s a lot of darkness out there.
Shine brightly enough to make it go away.
If the darkness tries to encroach again:
Shine even brighter. Light the way.
If public servants are getting involved in state propaganda the question is: what happens if/when the political leader/party changes? Hard to see how they have a future unless they would be allowed to confess their ‘sins’, recant and get a pardon 😐
Btw the next wuwt commenter is even funnier: ‘Fiddling scientific data is like corporations fiddling their financial data, a process known as fraud.’
Others point out that not only does NOAA want to make the ‘slowdown’, ‘hiatus’ or ‘standstill’ disappear, they want to obliterate the current El Nino as well, in order to pre-empt claims that any 2015 warming is due to natural causes.
So they have to become El Nino deniers – LOL XD
The Australian BoM has joined the data-mangling party too it seems.
Jo Nova reports: ‘Scandal: BoM thermometer records fiddled “by month” — mysterious square wave pattern discovered.’
‘There is some major messing with data going on.’
http://joannenova.com.au/2015/07/scandal-bom-thermometer-records-fiddled-by-month-mysterious-square-wave-pattern-discovered/
Is this the new normal?
Most adjustment work is assigned to the lowest-ranking, newest, most inexperienced employees since it’s tedious, repetitive work that senior staff would rather avoid. It’s done with little or no supervision and with (grossly) insufficient diagnostics, so it’s not surprising that blunders like BoM’s end up being discovered by the public.
In many fields of research the public has little or no interest, so errors go undetected. Climate stimulates enough interest that there are watchdogs and for some of these simpler types of adjustments, the watchdogs are more-than-adequately qualified to catch the inexperienced newbie errors that senior staff didn’t bother diagnosing before publication.
Speaking of mysteriously changing data….
Community Advisory:
I didn’t mention this sooner because I wanted to first look into diagnostics a little more deeply. I’m still going to do even deeper diagnostics, but I’m not delaying in announcing this much now:
The climatologies for ERSSTv3b2 at KNMI Climate Explorer changed sometime during the past 17 months in such a manner that:
a) The globe warmed substantially.
b) The thermal equator moved northward by something like a half a degree of latitude.
Anyone looking ONLY at anomalies NEVER would have noticed this.
Bear in mind that physics is a function of absolutes, not anomalies.
I’m currently running sensitivity analyses to explore the range of impacts such “mysterious” HIDDEN, UNANNOUNCED adjustments on various analyses. Another sidetrack delay slowing down other stuff…
Just exploring and keeping track of the extensive adjustments being made to climate data is quickly ballooning into a full time occupation in forensic accounting. Department of Commerce for sure… (influence on imagined futures?…)
Maybe their aim is to crank up the rate & complexity of adjustment to exceed the escape velocity that places them untouchably outside the range of volunteers. Juggle so furiously & so rapidly that….
If I was an enterprising young, upcoming climate “scientist” I’d hitch my wagon to a lab successfully milking the exponential growth of generous Department of Adjustment grants.
In short, I would specialize in Adjustment “Science”, a ballooning new branch of climate “science”, sure to take a lion’s share of the funding if the public appears to believe more in observations than models.
If models are unconvincing (which they are), I suppose we should not be surprised if we see such a funding shift …as persuasion is a key aim of these agencies.
If skeptic members of the public stubbornly put observations ahead of models…
((…then hello safe secure career in adjustment “science”))
_
Here’s something they’re worried about (representation of ENSO in ERSST) for some insight into the corner-shaving (supposed “bias” shaving off ENSOs) I mentioned way, way upthread:
Wittenberg, A.T. (2015). Low-frequency variations of ENSO.
Click to access wittenberg_variations2015.pdf
It’s based on equatorial Pacific ERSSTv4. Perhaps along with recent decadal trends this shiny interannual thing has motivated them to (accidentally or deliberately?) compromise the integrity of other aspects of the record.
This is another tangent I’ve begun exploring in detail and I think those of you into planetary stuff will like where preliminaries point, which is toward further confirmation of Dickey & Keppenne (1997 NASA JPL). (Recall ERSST EOF/PC2&3.)
I would sternly advise NOAA to REVERSE the unjustifiable poleward Southern Ocean infilling with equatorward pattern as it is SURE to impede the advance of sound exploratory science. I’m being quite serious. There are certain types of pristine territory upon which you simply should not tread. Either wise up or be replaced. This is too important, so it needs to be nonnegotiable. I recommend using this as a primary criterion for deciding who needs to be replaced at NOAA. It’s clear-cut so it’s fair. Anyone obstructing this reversal is making thoroughly transparent their intention to be not only corrupt but darkly & even vengefully corrupt. Maintenance of this infilling is strictly untenable as it’s physically impossible.
Do the laws of large numbers & conservation of angular momentum ever cross these “researher’s” minds??
Inferred changes in El Niño–Southern Oscillation variance over the past six centuries
http://www.clim-past.net/9/2269/2013/cp-9-2269-2013.html
Click to access cp-9-2269-2013.pdf
Have they ever heard of earth orientation parameters??
Have they understood the implications of Dickey & Keppenne’s (1997) figures 3a & 3b?? (surely not)
Imagine I worked for a special agency privy to classified information and there was something so fundamental, so beautiful, & so important that I lusted for years contemplating public jailbreak …and then one day it occurred to me that I could evade text-censors graphically…
Dickey & Keppenne are subtle geniuses. True heroes of the highest order.
Their daring mark on climate history resounds as a fair judge’s gavel.
Let’s say a prayer for their well-being, as they’ve offended the devil.
Inconvenient climate data? No worries…

[apologies to Apple]
Sun-Climate 101 Update:

Solar cycle deceleration (SCD) accounts for 82% of sea surface temperature (SST) variance north of the thermal equator. Sunspot integral (RI) accounts for 83% of the variance southwards.
oldbrew (July 4, 2015 at 12:23 pm) suggested:
“If public servants are getting involved in state propaganda the question is: what happens if/when the political leader/party changes? Hard to see how they have a future unless they would be allowed to confess their ‘sins’, recant and get a pardon”
In USA the elite of both the left (alarmists) (innocent incompetents who would do a lot of damage by accident) & the right (lukewarmists) (devilish agents of calculated distortion who will do a lot of damage on purpose) are pushing this deception.
So it’s: Take your choice between naive ignorance & mature deception.
In USA these civil servants have the support of the elite and the elite control both the left and the right, so when public opinion swings it reallocates priorities on a temporal axis (some elite objectives are easier to accomplish under one wing than the other), but it makes no difference to who’s in charge of agenda-guidance long-term.
The Abstract Approach…
The elite may look like they’re stuck on one path, but they’re not necessarily. Where nature’s beauty appeals compulsively, they’ll find another way respecting the wiser alien or god much as a dog is loyal to a benevolent master.
NOAA contradicting itself?
‘NOAA Fudging Turns Into A Mess …Bangor 2015 Sets 6-Month Cold Record Amid NOAA Claims It’s Warm!
http://notrickszone.com/2015/07/06/noaa-fudging-turns-into-a-mess-bangor-2015-sets-6-month-cold-record-amid-noaa-claims-its-warm/
http://notrickszone.com/2015/07/07/noaas-data-debacle-alterations-ruin-120-years-of-painstakingly-collected-weather-data/#sthash.aMaUR2gI.dpbs
Btw J Curry is now promoting (‘the most interesting thing I’ve read in a long time’) a PhD thesis that claims some kind of upside-down greenhouse effect over Antarctica as a way to account for increased sea ice – or something 😐
‘Antarctic specific features of the greenhouse effect’
[…] GWPF Let’s see if this new paper in the same journal as the ‘what hiatus?’ effort gets the same level of publicity as the other one, given that ‘Nieves et al…find […]
I’m working on this more and I have some notes to report:
• Interhemispheric sampling before ~1960 & BDO sampling before ~1880 bias ignorant interpretation.
• We may need a new metric: NIN (pronounced “neen”), which is an interhemispheric (inter-THERMAL-hemispheric to be precise) variant on standard ENSO indices like MEI …so NIN is a contrast, while MEI is a blend. Some remarkable insights fall right out of the air with exceptional correlations when the conceptual framework is extended to accommodate both global blends & axial contrasts …right up there in the “why didn’t we think of this before??” category.
Given constraints on time & resources, this is going to take an awfully long time to explain …but I’m noting this now as this pushes the unexplained variance right down to near-0.
interhemispheric temperature contrast, polar ice, systematic bias, systematic aliasing, rotational energy, & polar wobble tip:
ERSST PC4 (interhemispheric mode) & -LOD (negative length of day) before & after Panama Canal:

…a phase shift in polar wobble (chandler) right after a shift of BDO/2 in the phase relationship of LOD & a leading interhemispheric SST mode. Recall that the high frequency component constrained inside the BDO envelope equals the Chandler wobble period, as I outlined on the BDO thread. (BDO = bidecadal oscillation)
Sea Ice extent & export vs. SCL (solar cycle length):

The authors who write about Greenland & Antarctic ice should contact Jose Rial (…who knows how to think in complex numbers & fractional differintegrals …and more generally has a $@&#! clue).
BDO/2 phase-relation shift is a key clue.
(transfer of rotational energy to wobble with interhemispheric polar ice changes)
Chandler frequency is constrained inside the BDO envelope.
Reminder: For a price mainstream admins (see upthread) i can make it look for you like it was magically just anthropogenic sampling bias (!!) due to the opening of the Panama Canal. (hehe!…) Taunting: Haven’t you guys figured out the cause of the kink in PC1 yet?… Oops, there goes the CO2 storyline if you don’t figure out the fix at which I’m hinting to “hide” this inconvenient problem that authors like Dai (writing about California droughts & IPO) chop off their SST PC1 graphs (always informatively truncated at 1920, attentive observes will notice). It’s hilarious that they still don’t understand the nature of the kink. I think their minds would only be open to understanding the WWI kink if the CO2 record kinked there …but since it didn’t, they just pretend the kink doesn’t exist. Reminds me of the song by Chemical Brothers that repeats throughout the whole long trance-like song, “It doesn’t matter. It doesn’t matter. It doesn’t matter” etc.
FYI, adding BDO to this sun-climate 101 graph raises r^2 to 86.5% in both hemispheres …and FYI the new “adjusted” sunspot numbers don’t ruin this fact (and keep in mind that some of the leftover variance is WWII bias). ENSO takes the accounted variance up into the low 90s and frankly there’s only about 6-7% left for exploration …and its pattern in no way whatsoever (needs to be underscored, bolded & otherwise stressed) resembles CO2 — it’s so far from the shape of CO2 you’d have to be clinically insane (literally) to suggest it (no sarcasm).
The leftover 6-7% is related to Dickey & Keppenne (NASA JPL 1997) and all serious efforts should be focused on finishing that piece of the puzzle, which is down to the detail of annual interhemispheric & semi-annual equator-pole heat engines and the impact on the variance of regional interannual indices, particularly near Greenland.
I’m running increasingly detailed diagnostics on the BDO comparatively between v3b & v4.
A few quick notes:
1. The climatological thermal equator moved (v3b to v4), but not by a concerning amount.
2. The northern BDO increased notably in amplitude either side of the Chandler wobble phase reversal in a window spanning roughly 1910-1950. This is at least partially attributable to artificial interhemispheric contamination of northern hemisphere pattern using methodological assumptions based on southern hemisphere sampling. In other words they’ve made a mess. I suggest the people in charge over there get started on this problem by directing the subordinates to familiarize themselves with the details of the interhemispheric contamination mess they’ve made …but of course I think we all realize the problem probably originates with the most highly-ranked leaders …so that leaves the problem of what to do about that. Even the most brilliant internal technicians will be pushed off the rails by insistent bad leadership. The most effect way to influence high-ranking leaders is through external hard-constraints.
3. The southern BDO has increased dramatically in amplitude across much of the record, notably from 1890 to 1960 and especially from 1900 to 1950. Some of the amplitude increase is unbelievable. This sort of thing rouses stern mistrust & suspicion. If these sorts of egregious tactics are to be allowed in adjustment science then correction might as well skip the negotiation stage and move straight to abrupt, harsh displacement of corruption, allowing opportunity for neither feedback nor debate. This stuff is pretty creepy.
4. The recent northern BDO decreased substantially in amplitude. (I’ll take a look into the root of that more deeply when time permits. Of course it raises a suspicion that’s consistent with other notes far above in this thread. Even though I find notes 2 & 3 in this list 2 orders of magnitude more interesting, I suspect it is note 4 that will stimulate digging in other camps focused on the adjustments to the recent past even though adjustments to the deeper past are the most egregious.)
Further to note #4:
They’ve substantially decreased the amplitude of the BDO in both hemispheres.
This global change has the effect of straightening the recent record.
–
I’ve just finished running further diagnostics and again (as above) the conclusion remains that they’ve vandalized the record so badly that if people aren’t turfed over this we’re effectively waving a white flag of defeat announcing to them clearly that they can get away with even crazy adjustments.
Frankly it’s looking to me like the skeptic community in broad aggregate is too weak to successfully confront them on this. A few strong people won’t be enough for a job of this nature.
The articles on the topic at wuwt & ce continue to appear deliberately designed to further undermine, with the appearance that skeptics have nothing worthwhile to say on this file. The most egregious issues haven’t even been broached on those sites. Of course that just rouses further suspicions about the true nature & agenda of those sites.
Community Advisory:
Reevaluate strategy.
v4 should have been retracted by now.
– –
Further elaboration on #4:
Here you can see what they did to the recent BDO:

Here’s a still-frame for reference (based on v3b2, updated with 18 more months of sunspot numbers than the graphs above featuring HadNMAT2):

You can see that their adjustment is an anthropogenic cancellation of nature.
The v4 graph goes like a straight line through the tail end of the record.
FYI the wavelet parameters on that graph immediately above are tight & conservative. When relaxed slightly, r^2 for both hemispheres goes to 86.5% (and when relaxed a lot r^2 goes to 94%, but that number’s easily misinterpreted with lack of awareness of spatial modes shared by BDO & ENSO).
Here’s the interhemispheric mode the mainstream seems reluctant to acknowledge:


That’s a loose end I introduced over here:
If/when time permits maybe I’ll do a map animation of that composite mode in the complex plane.
I’m not sure why they’re so evasive of interhemispherics. They seem to want to do all of their modeling based on a global blend (the average), without having to bother being constrained by EOP & interhemispheric contrasts.
The appearance is that climate modelers are intent on violating laws of large numbers & conservation of angular momentum.
It’s not clear why they think EOP are independent of the amount of ice at the 2 poles. I would expect them to be more thankful to have opportunity to place a joint constraint (Polya’s sound problem-solving tip: use symmetry) on the global blend & interhemispheric contrast.
Generally I applaud NASA JPL’s climate work over other agencies, but one time when they messed up egregiously was when they used LOD to constrain climate inference based on a global blend, ignorant of interhemispheric contrast. They should take Polya’s (ice asymmetry) advice and fix their error.
You can be sure I’ll have more to say about this, including how the BDO blinded so many to all of this.
A little more on notes 2-4:
You can see here that they would have added more BDO in some eras and less BDO in others had they used lowess 0.2 instead of lowess 0.1:
They probably don’t even realize they aliased a real, natural, known wave into their “bias” estimates and then spread it across the thermal equator artificially. (I put “bias” in quotes because they’ve corrupted the definition of bias.)
OK, cross-community 5-alarm wake-up call:
This is very d*mning.
We can issue a deathblow to v4.
I’ve just split “bias corrections” according to before-&-after the big ~1940 step (with pre-1886 removed since that’s based on completely different methodology).
The “bias corrections” show a VERY strong correlation with IPO (interdecadal pacific oscillation).
The correlation reverses sign right at the big ~1940 step.
Can you hear that sound?
***SNAP***
That’s NOAA’s credibility breaking brittly in half …right at the big ~1940 step.
…so the interpretive clue here is that the “bias corrections” are confounded with a leading spatiotemporal mode of WIND — a MASSIVE factor in air-sea dynamics. (Go ahead and contact John Kennedy at the UK Met Office and ask him about “cool ocean warm land” if you lack faith in your own competence about this.)
This is a deathblow for v4. If they won’t concede defeat and retract within 2 business days, they’ve fatally lost not only credibility, but also any hope of being given another chance to demonstrate willingness to make the required effort to restore credibility.
__
I’ll be back later to illustrate…
To make the decadal IPO check really quick & easy for others, I’m illustrating with the annual average of the UK Met Office’s Table 1 here:
http://www.iges.org/c20c/IPO_v2.doc
Here’s the smoking gun:
ERSSTv4 supposed “bias” adjustments match decadal IPO.
Those of you doing the clip-art check can vertically flip everything after 1941 here and slide it down by ~0.25°C. It’s that simple. You get the IPO.
My initial very strong instinct when I first explored v4 on New Year’s Day was that it was a deliberate attempt to attack and sabotage what I illustrated in ERSST EOF 1234. Be sure to review the first thing I illustrated in that document (IPO) with the benefit of hindsight.
Now does everyone understand how they straightened the recent record?
Take a minute to step back from this and let it sink in just how bad this is.
ERSSTv4 is another nadir in climate “science” history.
NOAA literally canceled nature.
Are you going to let them do that?
If so it’s certainly
GAME OVER
for you and your credibility in the climate discussion …and I want nothing further to do with you …unless you pay really well. (Yes I’m pragmatic…)
If ‘NOAA cooled the data before the hiatus’ (PV: July 19, 2015 at 3:47 am) they created another problem i.e. how to explain all that supposed global cooling during a time of rising carbon dioxide, contrary to AGW theory.
We’ve heard the aerosol excuse but it’s just that – an excuse. Can’t be invoked every time expected warming doesn’t ‘deliver’.
OB, they ripped the decadal-IPO out of the record post-WWII and they put the pre-WWII record on decadal-IPO-steroids.
Folks: This is serious business.
Folks, sometimes a situation demands that differences be put aside and that people work together across the aisle to correct a serious problem. This is one of those times.
Paul,
I got the same sort of shape as your IPO chart by just taking 9th harmonic of PDO, so I think I can see what you’re talking about. (I didn’t know IPO was a synonym for PDO.)
http://woodfortrees.org/plot/jisao-pdo/normalise/fourier/low-pass:9/inverse-fourier
Seems what you are implying is… NOAA are the PDO Grinch.
Or at least, the PDO was cancelled in their SST picture after the WWII industrialisation.
So this just reinforces the constant refrain that after MLO began measuring a CO2 rise, that CO2 was the only thing affecting the climate. Funny how that turned out.
Could this mean a new HadSST4 is on the way, sans PDO?
Well, I like my eggs poached, not scrambled, and I like my PDO intact, not cancelled.
But what could anyone do to unmake the distortion – or contain it within a publication quarantine?
At the moment the barrier is understanding what has happened, and your descriptions so far are all over the shop. As with so much of your writing I have not found it coherent. Only with your most recent comment above have you kindof spelled out the effect of the adjustment. But I don’t want you to dumb it down. You should assume your audience has all the technical analysis skill you have but none of the climate domain knowledge. (If they don’t have the analysis skill, well you can cross that bridge when you get to it, or maybe they will just have to do more homework.) How would you explain the ERSST4 changes to such a person, in a concise way?
I reckon that’s what to aim for. It may even help you organize your own thoughts when you challenge yourself to explain it to someone who’s approaching the issue cold.
It will also help bring experts from outside of climate science into understanding the problems with contemporary avantgarde cosmopolitan climate science.
Review:
v4 jacks up the IPO amplitude before WWII and cuts it down afterward relative to v3b2.
v4 IPO:

v3b2 IPO:

v4 decadal IPO:

v3b2 decadal IPO:

That’s the differential shaving I mentioned several times way upthread …for example when I promised “to be continued” 3 times.
(sarc) Now, don’t all rush to applaud this careful detective work all at once. (/sarc)
When you make a lot of enemies they won’t give you credit when you deserve it.
Andrew,
What I’ve shown conclusively (you can take this to the bank whether you’re left or right; catholic or atheist; black or white; alarmist, lukewarmist, skeptic, or denialist) is that their “bias“ adjustments are an alias of the IPO with a sign switch at the WWII step.
There’s no ambiguity. This is so clear cut & simple that it can form the basis of a FAILSAFE test of who in the climate discussion is corrupt &/or incompetent. Anyone unwilling to immediately fully concede is an untrustworthy write-off advertising stubborn pride while embarking on an ethically untenable course.
“it is possible for an observer to change to a reference frame that overtakes the spinning particle, in which case the particle will then appear to move backwards, and its helicity (which may be thought of as ‘apparent chirality’) will be reversed.”
A sign-switch at a step-change overtook the political spin.
A retraction by NOAA before the Paris talks in November (or at all) seems highly unlikely.
OB, any competent climate scientist looking at this graph will know instantly.
To deny something like that they’d have to have no integrity.
2 business days is generous.
Andrew M. (July 19, 2015 at 4:00 pm) wrote:
“You should assume your audience has all the technical analysis skill you have but none of the climate domain knowledge. (If they don’t have the analysis skill, well you can cross that bridge when you get to it, or maybe they will just have to do more homework.) How would you explain the ERSST4 changes to such a person, in a concise way?
I reckon that’s what to aim for.”
Andrew, you & I have different target audiences and goals in mind, but we of course still have opportunity to cooperate &/or harmonize where there’s common ground, each playing a different.
Other issues I’ve raised above are more advanced, but in this particular (trivial, dead simple) case it’s just addition & subtraction of 2 columns in a spreadsheet and the intended target audience (most certainly) has the prerequisite climate knowledge to instantly understand.
It’s going to hit them instantly. The reason to give them 2 days is just to be psychologically humane.
PV: are your ‘intended target audience’ in fact already readers of this blog?
OB, they can’t pretend this is bias because it’s signal:
The right thing to do is put a straight line through it and then reverse the translation & reflection (built into the formulas written on the graph). In other words, authors of the past who used simple (straight line) adjustments were respecting nature. This is one of those simple, beautiful insights that make the waters more placid. This clarity eventually floats to the top, so what is left to observe is only the duration of administrative delay. Are those administrators reading this exact comment? Dunno. Maybe some readers will help point them to it today.
Sincerely
Don’t get your hopes up PV. Propaganda is still the name of the NOAA game it seems.
‘National Oceanic and Atmospheric Administration says first half of year was warmest ever and Earth experienced hottest June’
http://www.theguardian.com/environment/2015/jul/21/climate-scientists-say-2015-on-track-to-be-warmest-year-on-record
‘Warmest ever’?

[credit: Wikipedia]
It’s a knock-out punch OB.
v4’s dead.
a little visual help for people who can’t add & subtract
ERSSTv4 adjustments (based on ICOADS SST2.5 minus HadNMAT2):
flipping the right portion of the graph vertically at the abrupt (~1940) step and then sliding vertically:
The so-called “bias” is the IPO (interdecadal pacific oscillation).
Maybe someone who has time will write to John Kennedy at the UK Met Office and ask him to advise his counterparts at NOAA.
PV: check this out…
‘I can reveal that the US House of Representatives science committee, led by the Texas Republican Lamar Smith, also has doubts. At the end of last month, committee staff sent emails to several experts in Britain, saying Mr Smith ‘is making climate change data within NOAA a priority’. The committee, they added, was seeking outside help to ‘analyse’ NOAA’s claims – apparently, it would seem, because some members do not trust NOAA’s ‘input’ alone.
A committee aide told me: ‘NOAA released a conclusion it claims is based on scientific analysis. It has provided the Committee with documents to show their methodology and we’re seeking to confirm that their conclusions are accurate.’
http://www.thegwpf.com/was-the-global-warming-pause-a-myth/
OB, each day now it’s looking more & more certain that the Americans won’t clean up their climate corruption without help from Chinese superiors.
As Tony Heller points out, re NASA/NOAA data:
‘If they weren’t crooks, they would be very concerned about the discrepancy versus satellite data. But they don’t even mention it. A dead giveaway of their mindset.’
http://realclimatescience.com/2015/07/biggest-fraud-in-science-history-the-nasanoaa-surface-temperature-record/
I’ve just e-mailed the following to Kevin Cowtan, John Kennedy, & Boyin Huang:
Subject: ERSSTv4 ”bias” adjustments & ethics
Gentlemen:
Please do the right thing.
Kevin Cowtan (July 22, 2015) wrote
“[…] Tom Karl and Boyin Huang are really interested in getting a better handle on the relation between SSTs and NMATs […]”
Problem-solving tip from mathematician George Pólya:
“Use symmetry [14] […]
[…] 14. ^ Pólya 1957 p199”
https://en.wikipedia.org/wiki/How_to_Solve_It#Second_principle:_Devise_a_plan
3-step visualization:
1.

2.

3.

decadal IPO (Interedecadal Pacific Oscillation) illustrated
= annual average of UKMO’s Table 1 here:
http://www.iges.org/c20c/IPO_v2.doc
Recommendations:
1. Sober reflection.
2. Public acknowledgement without (cynicism-inducing) delay.
3. Prompt retraction of ERSSTv4.
Sincerely,
Paul L. Vaughan, B.Sc., M.Sc.
explicitly mapping what should be obvious to everyone who can understand deeply firsthand
spatial mode of adjustments:

for comparison, ENSO:

For now I’m leaving this mysterious:

I may or may not comment further, depending on how things play out.
[mod note] this link and previous two are dead
NOAA still whistling the same tune…
‘NOAA scientists say the global warming “hiatus” is nothing more than an illusion resulting from flaws in the way data was collected.’
http://www.thegwpf.com/noaa-global-warming-pause-is-an-illusion/
In other words, after they apply their ‘adjustments’ the whole picture changes.
No surprise there
Another way of looking at it (from icecap.us site):
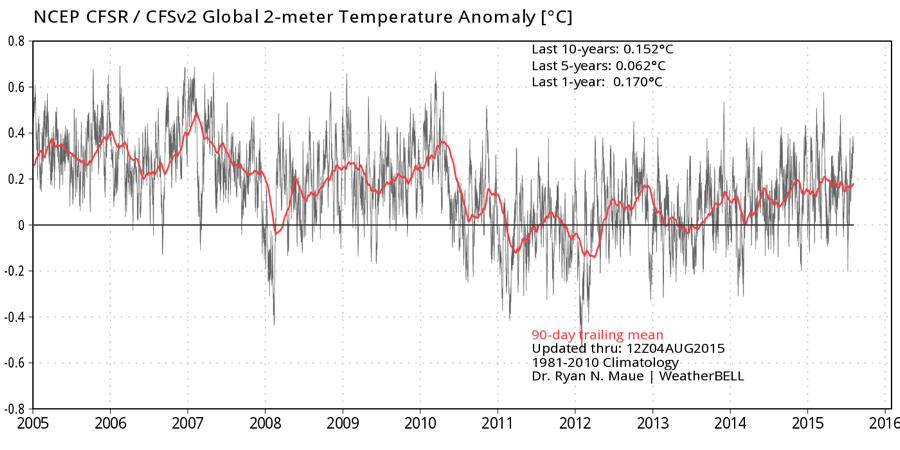
By this point in time it’s clear a high office firing will be needed:
http://joannenova.com.au/2015/08/former-noaa-meteorologist-tells-of-years-of-censorship-to-hide-the-effect-of-natural-cycles/#comment-1740690
PV: Why should the public have to put with such arrogant garbage from publicly funded bodies?
OB: We’ll see if people can and will follow the cookbook recipe I’ve given here:
(For reasons I’m not going to announce) I strongly suspect that wuwt supports — and even likes — the IPO distortion in v4 …and so far all signals are that I’m on the bull’s eye with this suspicion. How many days before we conclude we’ve witnessed an informatively turned blind eye? Not many more.
Paul Vaughan says: August 31, 2015 at 5:49 am
OB: We’ll see if people can and will follow the cookbook recipe I’ve given here:
(For reasons I’m not going to announce) I strongly suspect that wuwt supports — and even likes — the IPO distortion in v4 …and so far all signals are that I’m on the bull’s eye with this suspicion. How many days before we conclude we’ve witnessed an informatively turned blind eye? Not many more.
Indeed Paul,
Definitive evidence of widespread intentional crimes against humanity!
‘Alaska’s Recent Warmth is Mostly Due to the Pacific Decadal Oscillation’ – Dr Roy Spencer
‘NOAA’s official average temperature product for Alaska, even after they’ve made innumerable and controversial adjustments, shows cooling from the 1920s to the late 1970s, then sudden warming associated with the Great Climate Shift of 1977:
[graphic – see link below]
This shift was due to a natural reversal of the Pacific Decadal Oscillation, a 60 year cycle which affects the atmospheric steering currents in Alaska, determining whether cold polar air or warm Pacific air tends to win out as the two air masses continually battle for control over Alaska weather.’
http://www.drroyspencer.com/2015/08/summer-snow-to-greet-obama-on-alaska-climate-trip/
Will, that’s quite an unhelpful extrapolation.
– – – – – – –
I’ve posted a kindergarten-level cookbook recipe to help people detect NOAA’s corruption of the natural record firsthand:
This isn’t something esoteric. On the contrary it’s clear cut, simple, immediately tangible, and within full local control. Anyone who can subtract one column of numbers from another in a spreadsheet can fingerprint NOAA’s corruption of the natural record firsthand.
I’m going to suggest that all community members have a responsibility to pursue this dead simple exercise that shines a bright light exposing taxpayer-funded corruption of the natural record.
In ‘official’ climate science, data corruption is the new normal.
NOAA Data Show Outgoing Long Wave Infrared Radiation Higher This Decade – Planet Cools Slightly!
‘The data is monthly outgoing long wave infrared radiation (OLWIR) provided by the National Oceanographic and Atmospheric Administration (NOAA).’
http://notrickszone.com/2015/09/02/noaa-data-show-outgoing-long-wave-infrared-radiation-higher-this-decade-as-planet-cools-slightly/
So the NOAA disagrees with its own data it seems
Updated Nov. 21, 2015:
SST = Sea Surface Temperature
MAT = Marine Air Temperature
NMAT = Night Marine Air Temperature
—
North of Thermal Equator
ERSST ICOADS HadNMAT Solar Cycle Deceleration (SCD)
—
South of Thermal Equator
ERSST ICOADS HADNMAT Sunspot Integral (RI)
—
Alternating North & South of Thermal Equator (comparative 2 frame animation)
ERSST ICOADS HadNMAT Solar Cycle Deceleration (SCD) & Sunspot Integral (RI)
mean Thermal Equator = 8 degrees North
Sun-Climate 101 ERSST ICOADS HadNMAT
Solar Cycle Deceleration (SCD) & Sunspot Integral (RI)
North & South of Thermal Equator (8 degrees North)