


My interest was piqued yesterday when I thought it might be an idea to compare Tim Channon’s simple model of solar variation with the Carbon 14 record. Carbon 14 is thought to be an indicator of solar variation. Wikipedia has this plot:

Wikipedia plot of Carbon 14 related to solar activity events. Caution: this is completely wrong – Do not re-use
The problem with this plot, as with so many things in climate science, is that it is upside down and completely wrong.
For example, Wikipedia’s plot puts the Maunder minimum in the early 1700,s around 80 years late. No wonder they didn’t show any actual solar data on it. I found that I could get a better fit to Tim’s model by turning the Carbon 14 plot the other way up:
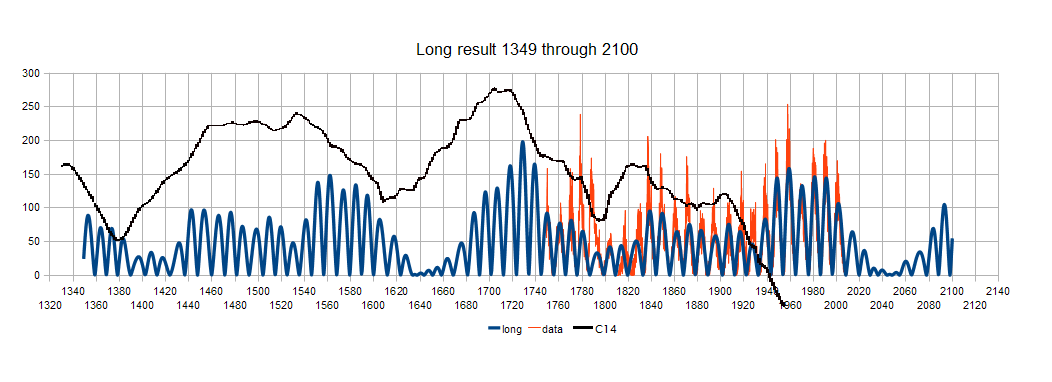
Comparing Carbon 14 to Tim Channon’s solar activity model. The positive correlation of C14 to SSN is a better fit to the model, and sunspot data than the inverse correlation claimed by Wikipedia.
Is inverting th C14 curve in Wikipedia’s plot a reasonable thing to do? Let’s take a look at their justification for their orientation of the data.
Wikipedia’s section on Carbon 14 on their solar variation page has this:
“The production of carbon-14 (radiocarbon: 14C) also is related to solar activity. Carbon-14 is produced in the upper atmosphere when cosmic ray bombardment of atmospheric nitrogen (14N) induces the Nitrogen to undergo β+ decay, thus transforming into an unusual isotope of carbon with an atomic weight of 14 rather than the more common 12. Because cosmic rays are partially excluded from the Solar System by the outward sweep of magnetic fields in the solar wind, increased solar activity results in a reduction of cosmic rays reaching the Earth’s atmosphere and thus reduces 14C production. Thus the cosmic ray intensity and carbon-14 production vary inversely to the general level of solar activity.[52]“
Footnote 52 takes me to “Astronomy: On the Sunspot Cycle” – a personal webpage http://users.zoominternet.net/~matto/M.C.A.S/sunspot_cycle.htm which gets a big fat 404-not found. Where is ‘matto’ now?
UPDATE: https://web.archive.org/web/20041130182313/http://users.zoominternet.net/~matto/M.C.A.S/sunspot_cycle.htm
Further intrigued, I hunted around for a Carbon 14 time series with sufficient decadal resolution to settle the issue. They are thin on the ground. I eventually found a plot of C14 in a 1981 study:

Stuiver, M., and P. D. Quay. 1981. Atmospheric 14C changes resulting from fossil fuel CO2 release and cosmic ray flux variability.Earth and Planetary Science Letters 53:349-62
Taking a section of their plot where there seemed to be at least some possibility of discerning some coherent decadal variability I produced the following figure:

But what of the sciency sounding argument about cosmic rays bombarding Nitrogen, causing beta-decay and ” thus transforming into an unusual isotope of carbon with an atomic weight of 14″?
Oliver Seely, Emeritus Prof of Chemistry at California state University says:
Carbon-14 is formed in the upper atmosphere by the bombardment of nitrogen-14 by cosmic rays. Cosmic rays are protons, particles and some heavier ions.
UPDATE: The argument struck out below is incorrect. I’m now of the opinion the tree ring samples used to construct the 14C curve used by Wikipedia have opposite to expected 14C content for a different reason connected with growth rates and density. I suspect that the unexpected data is due to the sampling methodology. Trees grow faster at solar minimum when the GCR flux is high and there is more 14C production, because the light is diffused into the forest canopy, and there’s extra moisture. The tree rings are therefore wider, but also less dense than rings growing at solar maximum. This means samples of equal volume from the rings growing at Solar max and min will have opposite sign 14C content to the atmospheric content at solar max and min. See this paper by Dengel et al 2006 for more information on the close correlation between the GCR flux and growth rates.
Sure, but the Sun fires plenty of protons and other particles at the upper atmosphere too. So how do we differentiate between beta-decay of Nitrogen caused by increased solar ‘cosmic rays’ near cycle maximum, and increased interstellar cosmic ray flux at solar minimum? The messy data from Stuiver & Quay isn’t completely conclusive, but it looks to me like heightened solar activity is the dominant cause of the Nitrogen Beta-decay to C14.
But what about the slope of the Carbon 14 data in the first half of the C20th? Well, Carbon 14 levels in tree rings aren’t only affected by solar activity (which was low in the first half of the C20th anyway, but also by co2 levels which started to rise faster and by a multitude of other factors including geomagnetic activity and vegetation extent. So the multi-centennial and longer trends of C14 doesn’t tell us much about the solar-climate relationship in my opinion. The several decade length reversals in trend do probably provide an indication of the ups and downs of solar activity though, so I think the positive correlation of C14 with Tim Channon’s solar activity model is a useful indicator of its likely accuracy.
Further support for my thesis can be found in sunspot records from the Early 1600’s compared to C14 observations in Ural conifer tree rings:

Figure from Kocharov 1995, which studies Maunder era 14C and Vaquero et al 2011 (inset) which studies sunspot records. The sunspot minima align with minima of 14C content in tree ring samples.
So what are the climatological implications of all this?
Restoring the curve to the correct positive correlation orientation enables us to properly understand the data. Which shows us that even at quite low sunspot numbers the sun is strong enough to keep most GCR’s away. But once it’s magnetic activity drops below some threshold, only one half of the Hale cycle has any effect on modulating GCR’s, and they get in in much bigger numbers, as seen in the Kocharev plot above. Paradoxically, despite what this post demonstrates, when the sun is very low, C14 production jumps up higher than when the Sun is even moderately active, and producing C14 with its own ‘cosmic rays’ from flares and CME’s etc. So the climatic implication is that a Maunder type solar grand minimum’s cooling effect, once it is into it’s stride after a couple of cycles, is likely to be more strongly amplified by extra cloudiness than previously thought, cooling the surface with its strong negative feedback – Another thing the warmies have managed to get upside down. Which means that if the prognosis is correct and we are heading into a Maunder type minimum, we’ll be OK for a couple of decades yet as the solar cycles ramp down, and the historically high ocean heat content dissipates, but it might then get a lot colder very quickly if the sun’s magnetic activity dips below a threshold level which allows galactic cosmic rays to enter the inner solar system in much greater quantity.

Hmmm.
Well I’ve already suggested that to get the observed climate zone shifting the sign of the solar effect on ozone in the atmosphere above the tropopause needs to be of the opposite sign to established climatology, namely less ozone when the sun is more active and more ozone when the sun is less active.
Recent findings have provided some support for that above 45km.
Could that apply to C14 production too ?
Hi Stephen. Very good question. I’m no expert in this field, so let’s hope someone who knows arrives to provide enlightenment.
NOAA doesn’t want to commit on the issue:
http://www.esrl.noaa.gov/gmd/outreach/isotopes/decay.html
“Where does new 14C come from?
Cosmic rays are high energy particles that originate in outer space. When they collide with matter in the atmosphere they can shatter a nucleus into smaller pieces (a process called spallation), including neutrons. The latter slow down, again by colliding with matter in the atmosphere. Once they have slowed down enough a neutron can be absorbed by a nitrogen-14 (14N) nucleus while kicking out a proton, resulting in a 14C nucleus.”
Below the text is a cartoon with a little lightning bolt labelled ‘cosmic ray’ and above that a little cartoon Sun. Ambiguity reigns.
http://anthro.palomar.edu/time/time_5.htm
Radiocarbon dating is based on the fact that cosmic radiation from space constantly bombards our planet. As cosmic rays pass through the atmosphere, they occasionally collide with gas atoms resulting in the release of neutrons. When the nucleus of a nitrogen (14N) atom in the atmosphere captures one of these neutrons, the atom subsequently changes into carbon-14 (14C) after the release of a proton.
From where in “space”? More ambiguity.
Free Dictionary definition
cosmic ray
n.
A stream of ionizing radiation of extraterrestrial origin, consisting chiefly of protons, alpha particles, and other atomic nuclei but including some high-energy electrons, that enters the atmosphere, collides with atomic nuclei, and produces secondary radiation, principally pions, muons, electrons, and gamma rays.
“of extraterrestrial origin” huh? How edifying… not.
Another of Wikipedias chronicly ambiguous illustrations:

“In 2009, supernovae were said to have been “pinned down” as a source of cosmic rays, a discovery made by a group using data from the Very Large Telescope.[37] This analysis, however, was disputed in 2011 with data from PAMELA, which revealed that “spectral shapes of [hydrogen and helium nuclei] are different and cannot be described well by a single power law”, suggesting a more complex process of cosmic ray formation.[38] In February 2013, though, research analyzing data from Fermi revealed through an observation of neutral pion decay that supernovae were indeed a source of cosmic rays, with each explosion producing roughly 3 × 1042 – 3 × 1043 J of cosmic rays.[2][3] However, supernovae do not produce all cosmic rays, and the proportion of cosmic rays that they do produce is a question which cannot be answered without further study.[39]”
[39]Jha, Alok (14 February 2013). “Cosmic ray mystery solved”. The Guardian. Guardian News and Media Limited. Retrieved 21 March 2013
http://www.theguardian.com/science/2013/feb/14/cosmic-ray-mystery-solved
The results are published on Thursday in the journal Science and were announced at the annual meeting of the American Association for the Advancement of Science in Boston.
Another question is whether the majority of cosmic rays come from supernovae, or just some of them. “We have taken the first crucial step of demonstrating that cosmic rays are accelerated in supernova remnants, but there is still work to be done to fully understand the origin of the cosmic rays,” said Funk.
The Graun links to the study, which ends up at another 404 http://dx.doi.org/10.1126/10.1126/science.1231160
[mod] see: http://dx.doi.org/10.1126/science.1231160
[…] Rog Tallbloke: Carbon14 and solar activity: Wikipedia has it wrong … […]
Hmm… seems that this is a little understood area, to say the least.
How about neutrons from lightening bolts creating C14 from nitrogen, as per summary of abstract from paper below?
Neutron generation in lightning bolts
G. N. Shah, H. Razdan, C. L. Bhat* & Q. M. Ali Bhabha
“…Suggested that neutrons are generated in lightning flashes, as a result of the fusion of deuterium contained in the atmospheric water vapour;..
…They have predicted a yield of ~10^15 neutrons per lightning flash…
…Experiments by Fleischer3, however, using fission track detectors placed near lightning arrestors, have estimated an upper limit of 2.5×10¹⁰ neutrons per lightning stroke…
…In our experiment, we present the first experimental evidence that neutrons are generated in lightning discharges, with between 10^7–10*10 neutrons per stroke…”
Looks like Earth itself is responsible for the production of many neutrons. Could their be a link between solar activity and thunderstorm numbers and/or intensity?
Full abstract available here…
http://www.nature.com/nature/journal/v313/n6005/abs/313773a0.html
tenuc: Interesting, thanks. Sounds like the sort of question the global electrical circuit experts might have the answer to. The other question is, do these neutrons have to be travelling above a certain velocity in order to be sufficiently energetic to cause the proton-neutron swap in a Nitrogen atom?
Perhaps looking at the energy lost by a decaying atom gives clues about the energy required
http://en.wikipedia.org/wiki/Decay_energy
Nitrogen not mentioned
It is here though:
http://www.newton.dep.anl.gov/askasci/chem07/chem07557.htm
the binding energy per nucleon for nitrogen-14 is 7.475614 MeV
TB:
In relation to your question “where in space do cosmic rays come from”, according to Nir Shaviv they come from galactic spiral arms:
http://www.sciencebits.com/ice-ages
Hi Roger: Yes, the question is, what proportion, and are solar originating protons able to do the job of causing the beta decay of Nitrogen to C14? My plot suggest they are.
This supports the contention:
http://physics.info/half-life/
Cosmic rays rain down continuously. These highly energetic nuclear bullets wreak havoc on the atoms in the upper atmosphere: tearing electrons from their orbitals and setting them free, knocking neutrons and protons from the tight confines of the nucleus and setting them free, generating x‑rays and gamma rays as they decelerate, and creating exotic particles like muons and pions directly from their excessive kinetic energy. These secondary cosmic rays are also highly energetic and will ionize atoms, transmute nuclei, and generate x‑rays themselves. A secondary cosmic ray neutron of sufficient energy striking a common nitrogen 14 nucleus can force it to eject a proton.
147N + 10n → 146C + 11p
This is the process by which all of the carbon 14 on the earth is produced. (Produced naturally to be more precise. More on that later.) … Nuclear bombs generate large numbers of high energy neutrons, which can in turn transmute nitrogen 14 into carbon 14 in exactly the same way as naturally occurring secondary cosmic rays. By 1965, atmospheric 14C concentrations were double their pre “atomic age” values.
Cosmic radiation has the energy to 10 ^ 21 eV, and solar radiation to 10 ^ 9 eV. Thus, increasing the number of neutrons near the surface, which produukują more C14 from nitrogen,
http://cosmicrays.oulu.fi/
Thanks ren. That indicates solar originating protons have plenty enough energy to cause the production of C14 I think. As my plot of the Stuiver & Quay’s data shows.
Primary cosmic rays are a stream of particles with energies of 10 ^ 7 to about 10 ^ 20 eV reaching the vicinity of the Earth from interstellar space. It is composed of different types of particles: electrons and positrons, protons, alpha particles and heavier nuclei (up to uranium) and gamma quanta with high energy. This radiation does not reach directly to the surface of the Earth and can be seen above the Earth’s atmosphere on satellites and balloons.
The particles of primary cosmic rays entering the Earth’s atmosphere produce an avalanche of particles called. secondary cosmic rays, which is part of the natural radioactivity observed on the surface of the Earth.
Carbon-14, 14C, or more correctly – a radioactive isotope of carbon discovered February 27, 1940 by Martin Kamen and Sam Ruben. 14C nucleus contains 6 protons and 8 neutrons.
Carbon-14 is formed in the upper troposphere and stratosphere as a result of neutron absorption by the nitrogen atom. Neutrons are the result of interaction of cosmic rays with atmospheric atoms.
The resulting carbon is oxidized to carbon dioxide, which enters through photosynthesis to the organic carbon cycle.
TB
I got a preliminary match to the carbon dating record using the Tidal torque model.

The carbon dating number have 40 added to them for viewing purposes.
You contributed to this model 🙂
This was quick so I have not had the time to fully explore any changes that could be made.
RJ
Tallbloke not just increase the number of C14 is the result of low solar activity and increased cosmic radiation.
Among the lesser-known effects of these are the cosmic ray intensity relationship with the content of ozone in the atmosphere, with the durability of artificial satellites as well as the impact of geomagnetic disturbances on human health, in particular the occurrence of heart attacks.
In my opinion they are wrong method of determining the amount of C14 in time. I do not know what assumptions come from?
RJ: Where is your C14 data from please?
Chaeremon: I’m thinking more of electromagnetic effects than gravitational ones here.
ren: good background info, thanks.
There seem to be several different ideas about when the Maunder minimum started and ended. Ian Wilson put up a post a while back about the synchronisation failures of JEV at the start and end of the Maunder, which he reckons to be from 1618 to 1698.
http://astroclimateconnection.blogspot.co.uk/2012/04/v-e-j-tidal-torquing-model-maunder.html
Does inverting the C14 record have any climate implications?
As far as know the climate effect is from ozone amounts with the level of cosmic rays / C14 production simply being proxies of the level of solar activity generally with no specific climate implications.
Stephen You’re right of course, but the conditions change. The period effects of cosmic radiation during high cycles was limited to the period of solar minima. Now that period has been going on since 2006 and the current level is similar to that in 2006. What will the next cycle will be even worse?
Tallbloke I wanted to ask you showed graph of Oulu since 1964, the more it shows.
Here I’ve combined two plots, from Kocharov 1995, which studies Maunder era C14 and Vaquero et al 2011 which studies sunspot records.
This seems to support my thesis that C14 is higher at solar max rather than solar min as claimed by Wikipedia and elsewhere.


I got the Vaquero image from Ian Wilson’s post on his tidal torque theory here
http://astroclimateconnection.blogspot.co.uk/2012/04/v-e-j-tidal-torquing-model-maunder.html
Note that the magnitude of the C14 swings in the early 1600’s is around 1.6 whereas on the plot in the main post it’s around 3. These are conifers in the Urals.
Clearly something wild happens to the C14 levels later in the 1600s, a puzzle.
Is this the slower moving particles arriving after Kepler’s supernova in 1604?
Or does the quiescent sun allow GCR’s to flood in when it’s magnetic activity drops low enough
Speculation on a postcard to the usual address. 🙂
I think clue is given by a change in frequency to around 20 years for the C14 cycles in the later C16th. The Hale magnetic cycle.
Special request for ren:
Thank you, by the way an interesting article about the role of ocean temperature and source.
http://www.accuweather.com/en/weather-blogs/climatechange/scientists-successfully-hindca/16957750
http://www.geomar.de/en/news/article/klimavorhersagen-ueber-mehrere-jahre-moeglich/
tallbloke wrote: Speculation on a postcard to the usual address.
An unexpected phenomenon was found some time ago which seems to relate radioactive decay (C14, etc) and the activity of solar flares: The strange case of solar flares and radioactive elements.
TB wrote: RJ: Where is your C14 data from please?
Here is the NOAA location of Historical 10 year average sunspots based on Radio Carbon Dating.
ftp://ftp.ncdc.noaa.gov/pub/data/paleo/climate_forcing/solar_variability/solanki2004-ssn.txt
RJ
Thanks ren. From the linked study:
“The winds change the ocean currents which in turn affect the climate. In our study, we were able to identify and realistically reproduce the key processes for the two abrupt climate shifts,” says Prof. Latif. “We have taken a major step forward in terms of short-term climate forecasting, especially with regard to the development of global warming. However, we are still miles away from any reliable answers to the question whether the coming winter in Germany will be rather warm or cold”. Prof. Latif cautions against too much optimism regarding short-term regional climate predictions: “Since the reliability of those predictions is still at about 50%, you might as well flip a coin”
.
🙂
Relevant paper from Usoskin on the 20 year fluctuations in 14C during the Maunder Minimum
“Heliospheric modulation of cosmic rays and solar activity during the Maunder minimum Author USOSKIN Ilya G. et al.
“In the present paper we compare the variations of cosmic ray intensity with solar and auroral activity during the Maunder minimum (1645-1715) when the Sun was extremely quiet. We use the newly presented group sunspot number series as a measure of early solar activity and the radiocarbon data as a proxy of cosmic ray intensity. We find that both cosmic ray intensity follows the dominant 22-year cyclicity with sunspot activity during the Maunder minimum. Moreover, the strict antiphase between the 22-year variation of cosmic ray intensity and sunspot activity suggests that the 22-year variation in cosmic ray intensity can be explained by the diffusion-dominated terms of cosmic ray modulation without significant drift effects.” http://cat.inist.fr/?aModele=afficheN&cpsidt=1124791
And another:
Variation of the cosmic ray intensity during the Maunder Minimum deduced from carbon-14
29th International Cosmic Ray Conference Pune (2005) Presenter: K. Masuda
“We investigate the features of the eleven-year and the twenty-two year variation of the carbon-14 content. The carbon-14 records show remarkable twenty-two year structure which may be due to cyclic magnetic reversal of the Sun. The variation of carbon-14 content suggests that the polarity of the Sun was negative when the Maunder Minimum occurred. It is evident from the carbon-14 records in Figure 2 that the GCRs had retained cyclic variation through the Maunder Minimum with almost constant amplitude, even though such significant variation is not seen in the sunspot record.”
Click to access jap-masuda-K-abs1-sh34-oral.pdf
Stephen asked: “Does inverting the C14 record have any climate implications?”
Stephen, I’ve replied in the form of an update at the foot of the headline post.
RJ: Thanks for that. I’ve no idea how Sami Solanki has manipulated the data, so I can’t make much of it. He did an update in 2005 I believe. I haven’t read the paper.
I’m confused on what you are asking about cosmic rays Rog.
Think I pretty much covered this a little while ago. Didn’t get much reaction.
Does this help?
Where do they originate? We don’t know. (add hand waving)
From which direction? We don’t know. (add hand waving)
There is a large range on energies possessed by these. Strongest just tramp right on through.
Some directions and energies make those canon fodder for deflection by the magnetic field associated with the earth and hence as the magnetic field varies so does the flux of cosmic rays.
This is the web site you need http://www.c14dating.com/
Tim, I’m fine with all that. I was after info on what makes people think GCR’s from outside the solar system are what cause most of the beta decay of Nitrogen when the data show that the Sun’s emission is doing most of the job.
Tim said:
Where do they [CR} originate? We don’t know. (add hand waving)
From which direction? We don’t know. (add hand waving)
This is not true Tim.
There is well developed observational and theoretical framework set up to show that most of the cosmic rays that produce Be10 and C14 originate in supernova blast waves where compressed and distorted magnetic fields accelerate sub-atomic particles up to near light speed.
The range of energies and types of the sub-atomic produced by the Sun are very different to those produced by the supernova remnants. This alone can rule the Sun out as a major [note my use of this word] source of the cosmic rays that produce C14 and Be10.
Tallbloke,
I’m not sure if this helps but I think you can invert the graph and then implicate the Sun- not directly via solar wind but indirectly via magnetic field reversal modulating the influx of interstellar GCR’s.
I sometimes wonder if there are glimpses of a missing link in what appears to be quite ordinary data. The recent Voyager data suggests that the heliosphere is being buffeted by cosmic winds in a similar manner to to the way in which the Earth’s magnetosphere is buffeted by solar winds. This was because Voyager started crossing the outer, concentric magnetic field lines in July 2012 but then appeared to cross back again as if reversing its direction of travel- this betrayed the drifting in and out of the concentric field lines. The probe actually measured precipitous dips and recoveries in solar particles, each dip lasting a few days. This was accompanied by a commensurate rise and fall in interstellar GCR’s. The two were very strongly inversely related (see Sciam link at bottom for graph showing a startlingly crisp anti-correlation over a few days). Both particle types (solar were much weaker) were being guided down the magnetic field lines at about right angles to the probe’s travel and in opposite directions. These magnetic field lines had suddenly become stronger, very bunched together and smooth. That had to mean the dips and recoveries really meant the probe was crossing over and then back over one single threshold to what was coined ‘the magnetic highway’. From NASA:
“Voyager data from two onboard instruments that measure charged particles showed the spacecraft first entered this magnetic highway region on July 28, 2012. The region ebbed away and flowed toward Voyager 1 several times. The spacecraft entered the region again Aug. 25 and the environment has been stable since.”
That’s a quote from this NASA article dated 3rd December 2012:
http://www.nasa.gov/mission_pages/voyager/voyager20121203.html#.UhoZAra9K0c
Another NASA article on the Voyager news page and dated 27th June 2013 mentioned 3 NASA papers published online in the journal, Science, that concentrated on the magnetic highway jump. I remember reading an article at the time, either the 27th June article or another which suggested one inference to be made was that the movement back and forth of the threshold was a function of the Sun’s magnetic activity and its consequent ability to keep the “interstellar” wind (GCR’s) at bay. It mentioned calculations, presumably in the 3 paywalled papers, showing that the speed back and forth of the meandering threshold was 10-15,000 km per hour. On revisiting the NASA article that assertion isn’t there. I could’ve sworn it was but perhaps it was elsewhere.
Anyway, a buffeting of the heliosphere by the interstellar wind implies an increase of cosmic ray flux entering the solar system at magnetic reversal ie solar maximum when the heliosphere field lines would decay somewhat. This, in turn, would increase the GCR flux buffeting the Earth’s magnetosphere at the 11 year (short term) solar max and imply that the same might happen for long term grand maxima and minima due to a more robust magnetic field evidenced by a quiescent sun (grand minimum) and vice versa for a maximum.
There’s a loose correlation even to the 11 year cycle in your last graph. If the magnetic field reversal link is correct for the 11 year cycle and proves a principle that can be extended to the longer term, that would mean that the positive correlation shown in your inverted graph is robust in the long term but due to the magnetic field weakening at grand solar maxima. That would mean that the usual suspected culprits, proper, paid-up GCR’s from interstellar space, are doing the damage (nitrogen knock-out) but with a positive correlation to solar max as opposed to an inverse correlation. This departure from the commonly held view might be explained by the following.
I think the widely held idea that solar max is correlated negatively to GCR flux could be an extrapolation too far from the well-documented Forbush decreases seen when a CME passes near the Earth. The CME sweeps all before it and the GCR’s are swept to the sides for up to several days after the pass. This causes a 10-20% reduction in GCR’s for that time. This all sounds very spectacular but it is a tiny pocket of ejected protons carrying its own anomalous magnetic field outwards and right through the Earth. True, the CME fields are millions of km across but the rest of the 300 million km diameter sphere we sit in remains relatively untouched by CME’s and with a weakened magnetic field due to the impending reversal. After the flurry of CME activity the Earth resumes its passage around the periphery of that sphere and the GCR’s return with a vengeance due to that weakened solar magnetic field.
It may be true that solar wind of any strength keeps GCR’s at bay but it is a question of degree: even if the baseline wind strength during a solar max rises, is it enough to overcome the proposed greater influx of GCR’s due to the reduced solar magnetic field? I can see that solar wind and field strength have a negative correlation over the 11 and 22 yr cycles but it would be a vanishingly small chance that they’d cancel out. I would tentatively suggest that the solar wind flux through the vastly greater part of the heliosphere is simply modulating the much bigger and opposite effect of the solar magnetic field on GCR’s. The CME’s may be the focus of our attention but they are like ball-bearings being fired off from the centre spot in a football stadium. We are passing through the (relatively) quiescent part of the heliosphere for most of the solar maximum while the door to the solar system is left unguarded against GCR’s.
The 3 paywalled papers are here:
http://scholar.google.co.uk/scholar?hl=en&q=voyager+magnetic+highway&btnG=&as_sdt=1%252C5&as_sdtp=
Here’s a good Scientific American article with impressive graphs of the hourly particle count halfway down the page:
http://blogs.scientificamerican.com/basic-space/2013/06/27/voyager-is-in-a-new-region-of-space-and-now-that-place-has-a-name/
Scute
Hi Ian, thanks for weighing in. Any comment on my evidence that C14 production rates are higher at solar max when there are less GCR’s incoming?
Scute: Ok, thanks for lots of interesting stuff there. But doesn’t the oulu graph above show more GCR’s at solar min and less at solar max, even though polar field reversal is at solar max?
We often disagree Ian, two opinions are shown. Perhaps I am being overcritical, some is more or less known.
A new model of cosmogenic production of radiocarbon 14 C in the atmosphere
Gennady A. Kovaltsov a , Alexander Mishev b,c , Ilya G. Usoskin b,d, n
Figure 4 will probably answer Rog’s question about solar related rates.
Click to access EPSL_2012.pdf
First time using all the tools we can verify the old theories of time series seems to be low solar cycles. Hence the importance of current information.
There is another issue, whether in periods of low magnetic activity of the Sun, cosmic rays will enter the evenly or abruptly.
It seems to me, watching the charts of Oulu, the more the latter. Such pulses can cause anomalies.
There is also another article that you can use.
Click to access lrsp-2013-1Color.pdf
Hi Tim. It changes the question, but it doesn’t alter my finding that Wikipedia (and others) have got the curve upside down.
The question is now: If C14 production in the atmosphere is greater during solar minimum, how come more of it ends up in trees during solar maximum as my evidence shows?
Ren: Thanks for the link, that is a really useful document.
There is also the issue of the width of growth rings of trees, by which we can determine the solar activity and temperature. In cold periods, assimilation is weaker.
Ren: Yes, and growth ring width follows cosmic rays:
http://onlinelibrary.wiley.com/doi/10.1111/j.1469-8137.2009.03026.x/full
Which makes the question of why there is more 14C in tree rings at solar max even more interesting. Is it a result of the higher wood density in slower growing, narrower rings?
There is an amusing back-story to this paper:
More complex is the issue of exposure of aircrew members who spend a year in the air after a few hundred hours. As is clear from the study, they received annual doses of the order of 2-6 mSv for a Boeing-767, and about half those for Boeing-737. So there are already twice as high doses of radiation protection. Related dose levels were also obtained in studies conducted in other countries.
Click to access bilski.pdf
Rog,
Don’t ask such simple questions, gets long answers. 🙂
Lets go back to a 2009 version of the plot (original is missing from the chain), because it is less visually confused by tarting up (blinds people like me).
This is an exercise in comprehension where I think you blinded by familiarity with a different context, something we all manage from time to time. Doh.
http://upload.wikimedia.org/wikipedia/commons/archive/5/5c/20090709160732!Carbon14_with_activity_labels.svg
Whether this plots a good idea, needs clarifying or whatever is a call.
In my opinion a more comprehensive method is needed, 14C being compromised by the 1950s bomb testing; a means to show information up to recent is needed but without confusing the reader by side issues.
Brevity, clarity are damn hard.
Bottom line, well this is written last, the plot trace is in the context of 14C: upside down.
refs
1. A main Wikipedia article refering to the questioned plot
http://en.wikipedia.org/wiki/Solar_variation
2. Current plot page
http://en.wikipedia.org/wiki/File:Carbon14_with_activity_labels.svg
This includes plot dataset reference.
3. File history page
http://en.wikipedia.org/wiki/File:Carbon14_with_activity_labels.svg#filehistory
The source of that c14 data in wikopedia is
http://www.radiocarbon.org/index.html
http://en.wikipedia.org/wiki/File:Carbon14_with_activity_labels.svg
wikopedia gives links to when and who constructed the graph and the data source
All data are from publicly available sources.
quote
(red trace) Carbon 14 record: http://www.radiocarbon.org/IntCal04%20files/intcal04.14c
Author This figure was produced by Leland McInnes using gnuplot and is licensed under the GFDL. Original uploader was Leland McInnes at en.wikipedia. Later version(s) were uploaded by Dragons flight at en.wikipedia
————————————
Sunspots were declining at 1600 as was Carbon 14

Sunspot data is minimum from ~1620 to 1680
Carbon 14 commences downturn in 1620
Carbon 14 minimum bottoms out at 1700-1720
C14 goes down with the sunspot number but bottoms out some 20 yrs later
A lag in phase of 20 yrs is not un reasonable ?
Is this a trick question? What is the issue?
Carbon 14 in phase with sunspot number but there is a lag component..
More a question of definition of maunder minimum
Is it defined byCET temp’
C14 levels
or sunspots
Traditionally it is defined by temperature.. and the CET.. and so the coldest period in CET records is?
Tim, yes. What I’m saying is that ‘upside down’ really *is* upside down in terms of the relationship between 14C and its uptake by trees (or at least the measurements of that uptake – -there may be an issue with wood density). While it is true that MORE 14C is produced at solar minimum than at maximum IN THE ATMOSPHERE, *LESS* 14C is measured in tree rings that were growing at solar minumum than at solar maximum. That’s what my plots following the wikipedia nonsense show in the headline post. Look at the numbers on the Y-axes, positive at the top, negative at the bottom.
So when you take a 14C tree ring series and plot it against solar activity, it needs to be orientated with positive numbers at the top and negative numbers at the bottom of the Y-Axis if you want the curve to represent solar activity, rather than GCR flux.
What I’m also saying is that while inflections in the curve at the 1-4 decade scale probably do reflect *the timing* of changes in solar activity, amplitudes and longer term trends should be treated with great caution because of confounding factors such as changes in Geomagnetism, vegetation extent and co2 levels among them. E.g. the ‘modern maximum’ is an artifact of increasing industrialisation, increasing temperature and who knows what else since the turn of the C20th. It is actually a dilution of 14C (going more negative in Wiki’s plot) by changing ocean dynamics, industrial co2 output, increasing natural co2 levels, etc.
Crikey: C14 goes down with the sunspot number but bottoms out some 20 yrs later
A lag in phase of 20 yrs is not un reasonable ?
Is this a trick question? What is the issue?
The issue is that in the wikipedia plot at the top of the headline post, 14C doesn’t go down with the sunspot number, it goes up. Look at the Y-axis. Negative at the top, positive at the bottom.
My detailed plots at the decadal level show that whatever is happening with 14C in the atmosphere, the measurements of 14C in tree rings show more 14C at solar max, and less at solar min. So although I now readily accept that GCR’s cause more 14C production than the Sun, and so more 14c is produced at solar min than solar max, the fact remains that Wikipedia have their 14C curve the wrong way up, because that curve is derived from tree ring measurements, not atmospheric 14C levels, and not from underground based neutron monitor counters.
Roger,
The graphs isn’t really upside down. Some sneakey devil reversed the key on the left so that negative values are on top. Someone wanted to point out the hockeyschtick shape of the graph. As if CO2 could have something to do with cosmic rays. They never stop!
TLM, Maybe you are joking, but just in case, I don’t think you are correct. See the full plot from Stuiver & Quay
As sometimes happens between blog moderators we talk for real. I hope I have understood.
Rog is concerned about the 14C as found in actual wood in relation to the 14C production from the air.
The intermediate step is 14C joining with atmospheric oxygen to form radioactive carbon dioxide, which is eventually taken in by the trees, atomic bonds broken, 14C then laid down as a constituent of wood.
Some nasty biting animal comes along and bores holes, ouch.
Sun is highly active, higher magnetic field, deflects more cosmic rays, lower ray flux, lower 14C production, lower laying down in trees.
The earth biosphere is protected from excess radiation by a magnetic field.
–http://www.srl.caltech.edu/personnel/dick/cos_encyc.html
” the intensity of cosmic rays at Earth also varies, in anti-correlation with the sunspot number”
Therefore: high sunspot number == low intensity of cosmic rays at earth == low 14C production == low value in wood
Therefore the plot is correct.
Hi Tim, if you’re analysis was correct, then the measurements taken from tree rings would show that the samples of those tree rings which grew near solar minimum contained more 14C than the samples of those tree rings which grew near solar maximum. The evidence I have presented in my plots shows the opposite is the case. Therefore we’ll have to disagree, because I go with the data, not the expectation.
I suspect that the unexpected data is due to the sampling methodology. Trees grow faster at solar minimum, because the light is diffued into the forest canopy, and there’s extra moisture, and so the tree rings are wider, but less dense. This means samples of equal volume will have opposite sign 14C content to the atmospheric content at solar max and min. But this makes no difference to the fact that Wikipedia’s plot is upside down. The data is the data, and must be used in the correct orientation, no matter what theory says.
Sorry Roger,
I was talking about the wiki graph. Obviously I walked in late and don’t have a handle. Ignore me when I say something stupid. It will be appreciated.
TLM: No problem, but It’s the same data. Stuiver and Quay show it with positive at the top, but with the trend to negative values in the C20th, same as Wikipedia. But Wikipedia turned the whole plot, data, Y-axis and all upside down because they think, like Tim does, that the tree ring samples the curve is derived from *must* have more 14C in when the sun is less active. My plots show that is not the case, probably for the reason I explained to Tim. I’ve updated the headline post.
Tim says:
Therefore: high sunspot number == low intensity of cosmic rays at earth == low 14C production == low value in wood
Therefore the [Wikipedia] plot is correct.
I’ve produced two datasets that show the samples taken from tree rings have higher 14C content when atmospheric 14C production is low, and lower 14C content when atmospheric 14C production is high. So if you are going to disagree with me, I think he onus is on you to find some tree ring sample data and line it up with the solar cycles. Otherwise you are skating on the thin ice of insisting that theory trumps data. And no self respecting sceptic gets caught doing that. 😉
The Stuiver graph looks wrong to me also. A weaker magnetic field should mean more C14 to be absorbed by trees. I can’t believe Stuiver would forget to reverse the signs in a major research paper. If Stuiver had reversed the sign the two graphs definately would not match. Now I’m really confused. I’ll reread your argument and look at it again.
TLM: A weaker magnetic field should mean more C14 to be absorbed by trees.
It should, but if the wood is less dense because trees grow faster at solar min (as they do according to Dengel et al 2006), and the sample size the same as with denser, narrower rings growing at solar max, less 14C will be found in the less dense wood and more in the denser wood. QED
Roger,
The fact that both graphs showed a downtrend and their sign was reversed was really throwing me off. It took me all this time to figure out that the wiki graph was from 800-2000 and the Stuiver graph was from 1800-2000. Both graphs appear to be correct and I am wrong (go figure). Hey…… I come here for the free physics lessons.
About your idea that trees grow faster at solar minimum. Maybe solar max years are more prone to drought. Just a thought.
Thanks for that. It’s not just an idea of mine though, the paper is here: http://onlinelibrary.wiley.com/doi/10.1111/j.1469-8137.2009.03026.x/full
This has nothing to do with rate of tree growth. 14C measurement is designed to be independent anything else, such as mass.
The units say delta, it is a ratio, a ratio of isotopes. This is independent of how much material is used (common quantity so it cancels exactly), or the width of a tree ring.
A good text is here on most of this from commerce, manufacturer of mass spectrometers for purpose http://www.radiocarbon.com/PDF/Beta-AMS-Methodology.pdf
Quite a few snippets in there such as the French Beet crop, grow your own. The moving target nature of the business makes things fun.
I have a question. Is in 2009-2010 were conducted studies of radiation doses in airplanes? In those years it was a record cosmic radiation, with minimal solar activity. It is worth to know the scale of the action of cosmic rays.
It seems that NASA announced the summit in the autumn of this year. Meanwhile, what is happening on the Sun?
http://www.solen.info/solar/indices.html
This article is interesting data from previous years.
Click to access lrsp-2013-3Color.pdf
SpaceWiki
Radiation belts
Skip to end of metadata
Added by Reijo Rasinkangas, last edited by Reijo Rasinkangas on Oct 13, 2008 (view change) show comment Go to start of metadata
The trapping regions of high-energy charged (cf. ring current) particles surrounding the Earth are called radiation (or van Allen) belts (Van Allen et al., 1958; Van Allen and Frank, 1959). The inner one, located between about X = 1.1 – 3.3 Re (Earth radii, geocentric) in the equatorial plane, contains primarily protons with energies exceeding 10 MeV. Flux maximum is at about X = 2 Re. (Distances given here are approximate, since the location of particles is energy dependent.) This is a fairly stable population but subject to occasional perturbations due to geomagnetic storms, and varying with the 11-year solar cycle. The source of protons in this region is the decay of cosmic ray induced albedo from the atmosphere.
As a result of the offset between the Earth’s geographical and magnetic axes, the inner belt reaches a minimum altitude of about 250 km above the Atlantic Ocean off the Brazilian Coast. This South Atlantic Anomaly occupies a region through which low-orbiting satellite frequently pass. Energetic particles in this region can be a source of problems for the satellites and astronauts.
The outer belt contains mainly electrons with energies up to 10 MeV. It is produced by injection and energization events following geomagnetic storms, which makes it much more dynamic than the inner belt (it is also subject to day-night variations). It has an equatorial distance of about 3 – 9 Re, with maximum for electrons above 1 MeV occurring at about X = 4 Re. ‘Horns’ of the outer belt dip sharply in towards the polar caps.
Recently a new belt has been found within the inner belt. It contains heavy nuclei (mainly oxygen, but also nitrogen and helium, and very little carbon) with energies below 50 MeV/nuc. The source of these particles are the so called “anomalous cosmic rays” of interstellar origin.
The radiation belts are of importance primarily because of the harmful effects of high energy particle radiation for man and electronics:
it degrades satellite components, particularly semiconductor and optical devices
it induces background noise in detectors
it induces errors in digital circuits
it induces electrostatic charge-up in insulators
it is also threat to the astronauts
The investigation of the Earth’s radiation environment was one of the main tasks of the CRRES satellite. It has observed, for example, a rapid (1 min) formation of a new radiation belt due to a SSC on 24 March, 1991 (Vampola and Korth, 1992).
References
Vampola, A. K. and A. Korth, Electron drift echoes in the inner magnetosphere, Geophys. Res. Lett., 19, 625-628, 1992.
Van Allen, J. A., G. H. Ludwig, E. C. Ray, and C. E. McIlwain, Observations of high intensity radiation by satellites 1958 Alpha and Gamma, Jet Propul., 28, 588-592, 1958.
Van Allen, J. A., and L. A. Frank, Radiation around the Earth to a radial distance of 107,400 km, Nature, 183, 430, 1959.
Thanks ren, some background
And WUWT discussions
ren,
the PDF figure 6 is data from South Africa. This is close to the magnetic equator and under quite a thick atmosphere.
Magnetic polar regions have differences so I am not clear on the intent of the article. I suspect the focus is off terrestrial effects.
I am a novice to the c14 proxy data but may as well start somewhere
After reading the MIYAHARA et al research paper on this topic. I was not thrilled by the correlations
This is what l observed.
I have correlated both of their graphs to see more clearly the correlation between sunspots and C14
.
Have a look at their graphs l have highlighted here first… and then below some observations l made from the time series graphs
——————————————————————-
Carbon 14 rises increases linearly from ~1610 to 1700 and then at the 1700 inflection point C14 falls and is decreasing still at the year 1750 . This linear triangle signal does not correspond to the changes to sunspot number during this period
Sunspots dropped below 50 around the year 1650 and remained that way until about 1725
The carbon 14 cycle may have responded with an increase in amplitude of the C14 cycle about 10 yrs. after the drop below 50 sunspot range.
The C14 cycle is the length of the magnetic Hale cycle.(22yrs)
The C14 cycle does not respond to the amplitude of the solar cycle convincingly
The loss of sunspots appeared to create both increases and decreases in C14 in the 22 yr cycle ( Hale?) An Increase in amplitude of the C14 cycle
The return of sunspots did not reduce the amplitude of the C14 cycle from 1725 -1750?
The C14 had its largest amplitude some 20yrs after the sunspots returned !!
The C14 was increasing before the drop in sunspot numbers ..and continued increasing well after sunspots resumed..
NOTE: This study also has inverted the 14 C values.(.pos and neg are inverted on one graph but are not on inverted the other. Wikopedia may have taken this practice from the Miyahara 2005 study)
I Find the correlation between C14 cycle and its amplitude weak against the sunspot number in this short time frame of the maunder period?
I wouldn’t mind seeing some other research and time series graphs on this subject. to cross verify.
If C14 is a proxy for sunspot number. and vice versa. I wouldn’t use the Miyahara et al study.
http://www.docstoc.com/docs/50404630/Variation-of-the-cosmic-ray-intensity-during-the-Maunder-Minimum
I’m just starting the article so I don’t have much to say yet except that the author of the original figure in question seems to be one “William M. Connolley” which I believe is some species of ferret. He also seems to have left bloody little footprints all over the edit history, deleting any improperly cited addition with the admonishment, “…you need a proper journal for a claim like that” – this could be half the problem here.
Of course to give Herr Stoat his due, Wikipedia is an encyclopedia, the first stop on researching a subject, not the final authority, and that truly scientific and technical subjects should cite only high quality and published sources – “404” doesn’t seem to be one of them. There are also strict guidelines against “original research”, so if anyone here is interested in changing the ‘status quo’ on this particular subject find some defensible published sources, preferably in print and peer reviewed, or get your own work published first. I would be happy to assist on the editorial side of the project under my Wikipedia user name Atani.
W^3
Well, thank you Atani. If I can get a , dare I say it, consensus on this, and ‘ferret’ out some more peer reviewed information to confirm my findings, I’ll take you up on that offer.
You’re welcome,
I will add that Stoat has a reputation for riding roughshod over anyone he doesn’t consider a ‘worker in the field’ – if you didn’t know this already. He will probably put up a fight and things will likely wind up in WikiHell for a while.
Best strategy is to build a very strong, well documented argument in advance, present it to the editors who have been working on the article on its ‘talk page’ to build some support for your position. Connolley will probably show up at this point and may or may not start a fight. Having the respect of the other editors already on the article will be key, or he will just come back in six months and ‘revert’ you while you’ve got your back turned. This is not much different than any other business enterprise, good and bad.
Also, if you and anyone else planning on embarking on this expedition are not already registered Wikipedians, get yourselves accounts now and get some edits under your belt – minor ones at first. Learn the ropes. Be familiar with the Five Pillars of Wikipedia & etc. You won’t get much respect from anyone charging in as outsiders wanting to ‘fix’ things. This is not much different from any other business enterprise as well. Commitment to the project gets respect.
W^3