


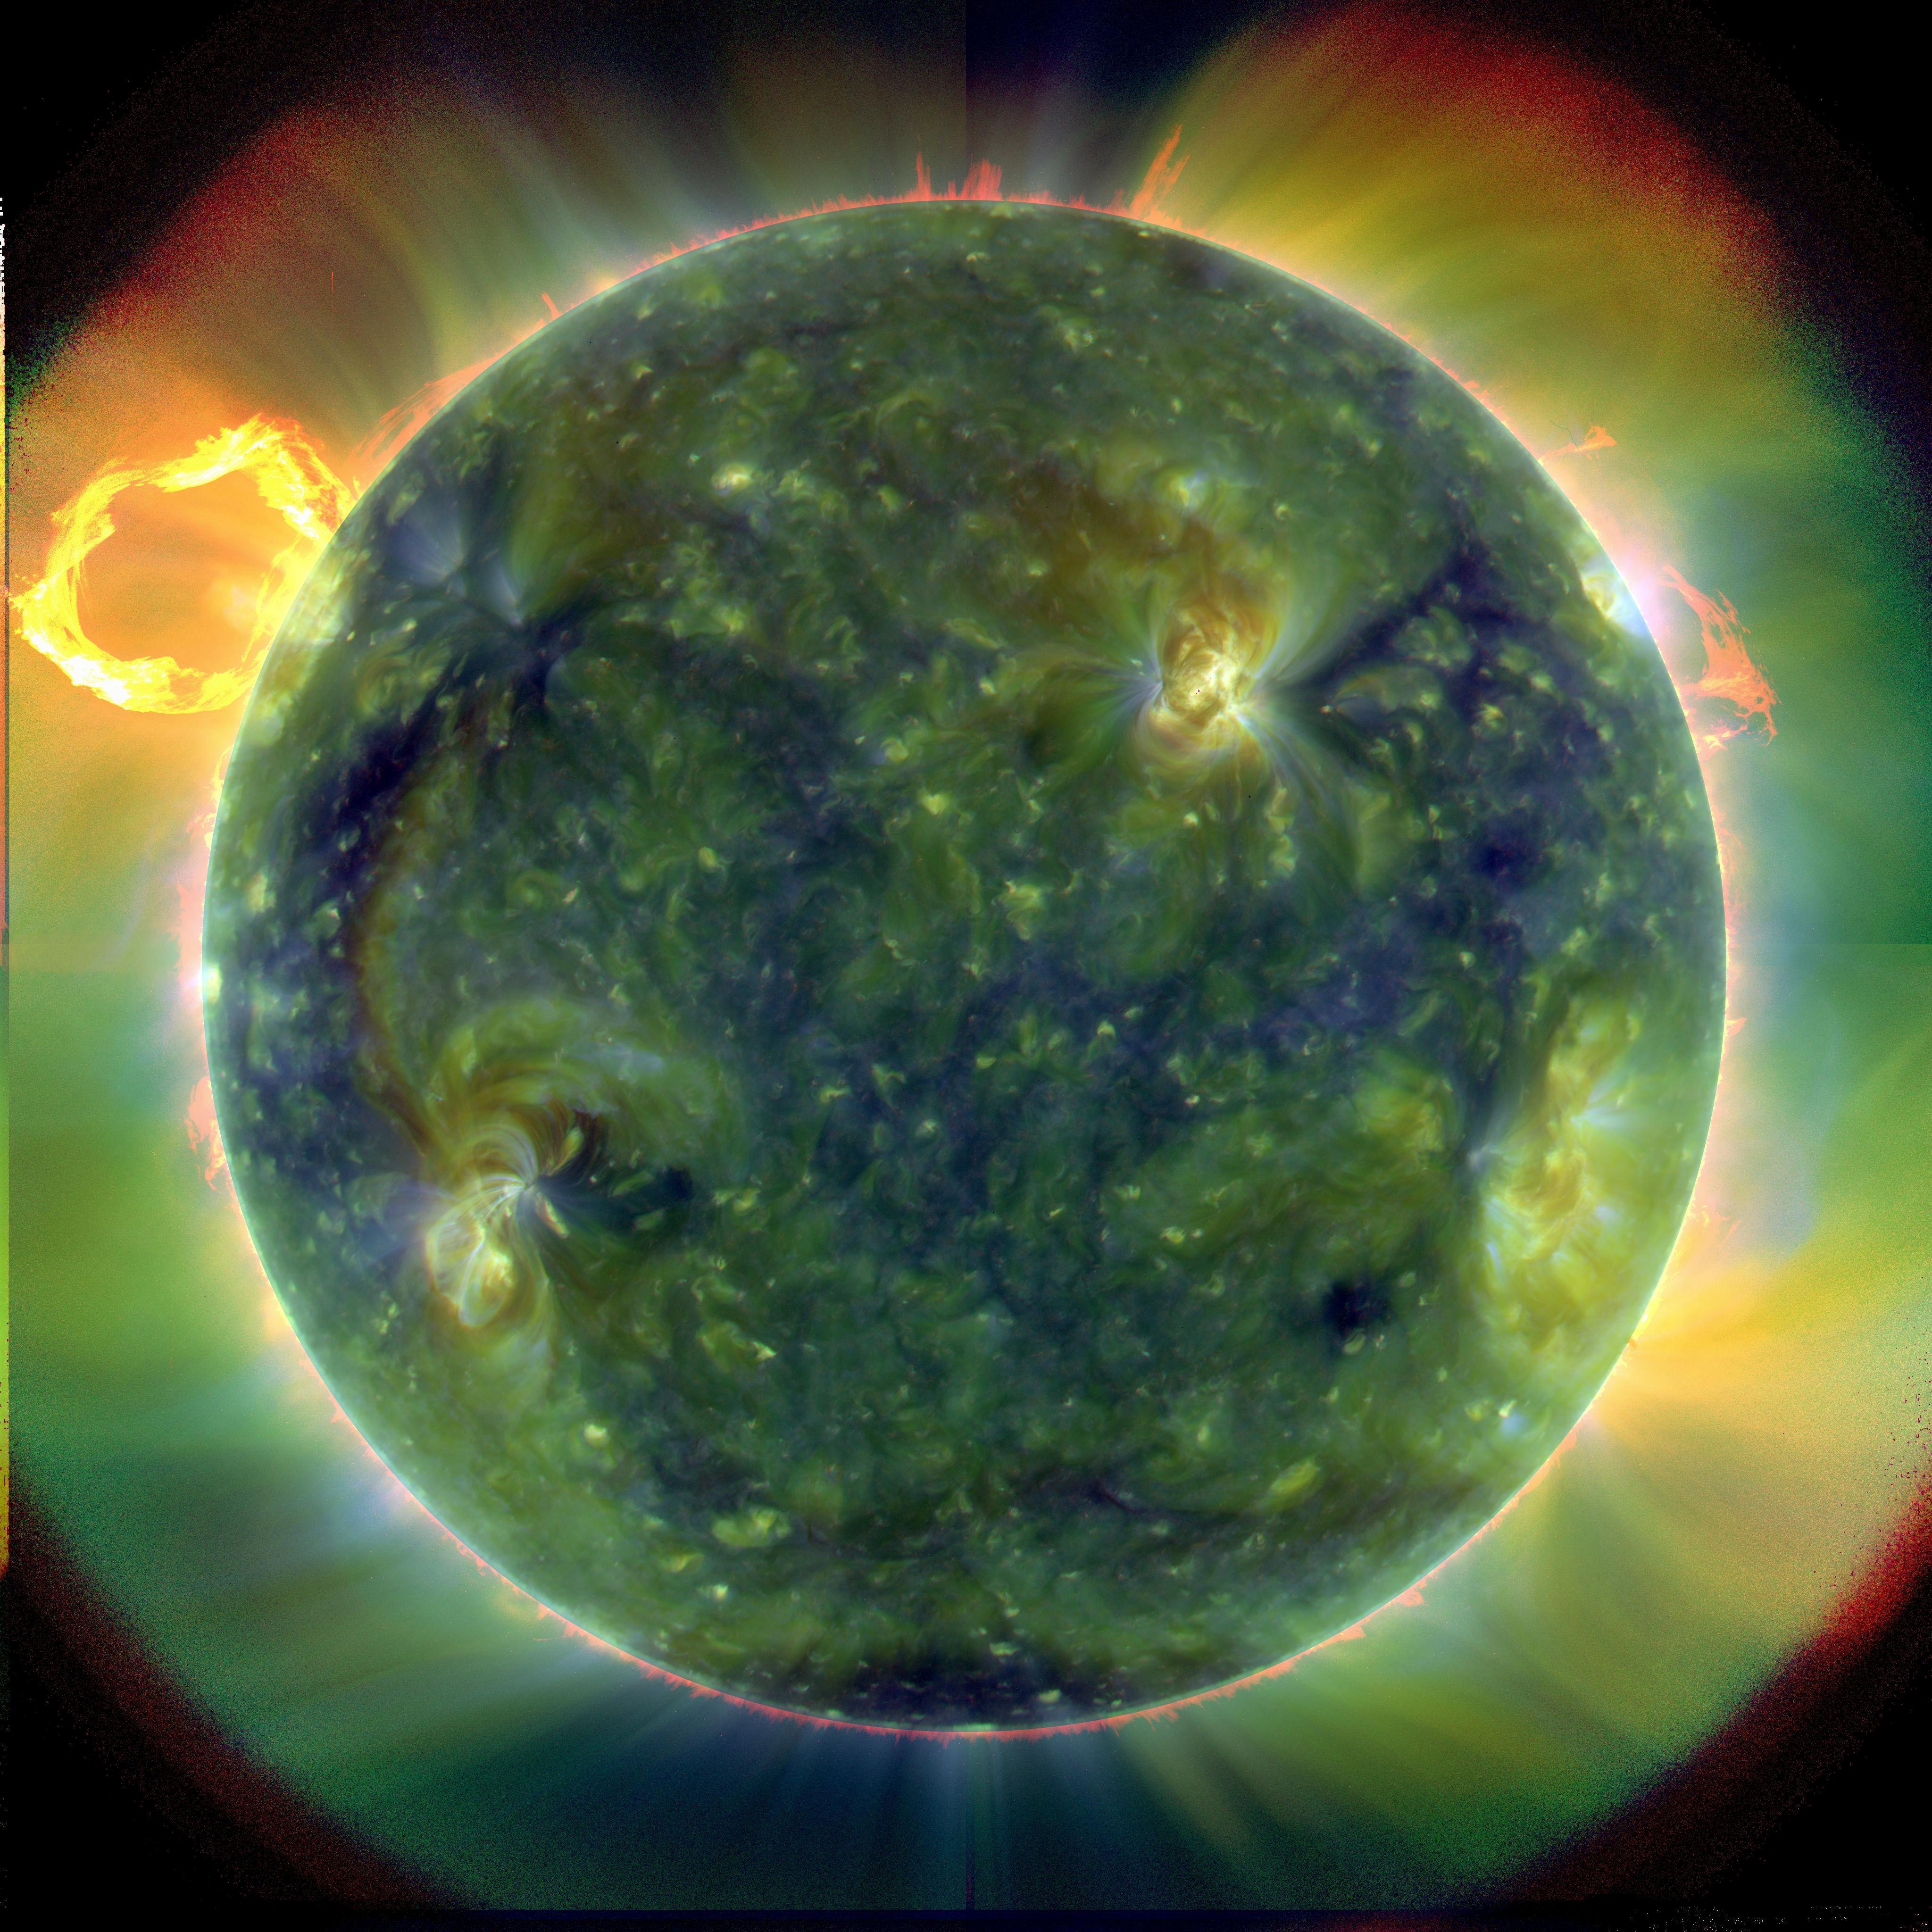
The Sun from NASA’s SDO spacecraft
Solar Cycle 25 has begun, according to this NASA press release.
During a media event on Tuesday, experts from NASA and the National Oceanic and Atmospheric Administration (NOAA) discussed their analysis and predictions about the new solar cycle – and how the coming upswing in space weather will impact our lives and technology on Earth, as well as astronauts in space.
The Solar Cycle 25 Prediction Panel, an international group of experts co-sponsored by NASA and NOAA, announced that solar minimum occurred in December 2019, marking the start of a new solar cycle.
Because our Sun is so variable, it can take months after the fact to declare this event.
Scientists use sunspots to track solar cycle progress; the dark blotches on the Sun are associated with solar activity, often as the origins for giant explosions – such as solar flares or coronal mass ejections – which can spew light, energy, and solar material into space.
“As we emerge from solar minimum and approach Cycle 25’s maximum, it is important to remember solar activity never stops; it changes form as the pendulum swings,” said Lika Guhathakurta, solar scientist at the Heliophysics Division at NASA Headquarters in Washington.
Continued here.
– – –
Talkshop note: the next predicted maximum is July 2025
See also: Analysis determines we are in Solar Cycle 25 — NOAA / Weather Service

NOAA forecast (issued Dec. 2019) for SC 25…
https://www.swpc.noaa.gov/news/solar-cycle-25-forecast-update
– – –
Cycle length looks ambitious – over 13 years?
Great update.
IIRC, this may not be the first time this cycle has been declared.
“…an international group of experts co-sponsored by NASA and NOAA, announced that solar minimum occurred in December…”
Consensus predictions…
Like the sun cares what they group-thought. Does what it does as entropy proceeds.
El Nino next Winter I think since the solar cycle lately is of the longer length of bimodality ~12.1yrs.
NOAA: La Niña—the cool phase of the El Niño-Southern Oscillation climate pattern—emerged in the tropical Pacific in August 2020. Forecasters estimate a 75% chance these conditions will last through Northern Hemisphere winter.
https://www.climate.gov/enso
September 2020 ENSO update: La Niña is here!
Author: Emily Becker
September 10, 2020
https://www.climate.gov/news-features/blogs/enso/september-2020-enso-update-la-ni%C3%B1a-here
– – – – –
BoM: ENSO Outlook
An alert system for the El Niño–Southern Oscillation
15 September 2020
La Niña ALERT maintained as shift towards La Niña continues
http://www.bom.gov.au/climate/enso/outlook/
(overwritten every 2 weeks)
Agree, not this winter, but next.
Reblogged this on Climate Collections.
We are in the 27th day of a spotless Sun. So far this year it has been spotless 70% of the time. Some ham radio operators are jokingly saying that SC25 peaked in August and we now have to wait for SC26 for radio propagation to improve. The longer the Sun remains spotless, the farther to the right on the Silso chart the depth of the Minimum moves. I agree with JB, the Sun doesn’t care what the consensus says. Jupiter and Saturn both align electromagnetically (Late October — early November) and along the ecliptic (December 16) later this year. I personally think that’s when solar activity will pick up dramatically.
Correction: J-S Syzygy December 21st
“As we emerge from solar minimum and approach Cycle 25’s maximum, it is important to remember solar activity never stops; it changes form as the pendulum swings,”
In other words SC25 has been here some time but was the minor player as far as solar activity goes, now with SC24 waning away it has (maybe) become the dominant solar cycle.
I will laugh my socks off if, for no previously known reason, SC24 makes a last dying gasp and pops out a few sunspots to stay in the game before really ending! 🙂
Here are ENSO cycles since 1954…markers for zero years, 10.4yr and 12.25yrs (similar to the bimodal cycle length of the sun that has been documented). It is somewhat subjective to define the length and the exact starting point, there was some nuclear testing I believe which shows up during the late 1950s, and I think the sun had both cycle lengths within the same cycle (northern hemisphere and southern hemisphere seem to have possibly represented both bimodal cycle lengths).The rest are much cleaner. It is what it is, but thought I’d throw it out there for thought
It seems to me that whatever is causing these massive transients of 3C into our climate system (and they end up ratcheting up or down the AMO) can easily cause 0.1C rises over 10 yr periods. Longer lower amplitude cycle have little energy in El Nino strength, and have a longer period between El Ninos, while with the much more active shorter cycles, there is much more energy and more frequent El Ninos. Very easily the cause of the 60yr PDO/AMO cycle, though no idea as to causation (looking at my earlier image of the solar magnetic field vs ENSO I can never look at the sun or ENSO the same again).

Here are the short cycles…
Here are the long cycles…
Looking at this image, it seems that every solar min when activity kicks up we get a solar min El Nino. The approximately when the high polar fields shift (before the end of the cycle, slightly after the peak) we get another El Nino. It is almost like where the spots are aligning with our orbital plane hit us twice, or it is the magnetic field we cut through (HCS) expanding and contracting with the cycle, or some unknown parameter but it sure seems to be much more predictable than a pseudorandom 3-5 yr cycle IMO.
And bimodal just like the sun…
Edward – leave out the ‘?’ and the rest of the link if posting images, then they should display. Your comments above have been edited accordingly on this occasion.
Readers can click on the images for an expanded view.
– – –
edwardt says:
September 18, 2020 at 4:22 am
Tallbloke has had similar thoughts I believe.
Reblogged this on WeatherAction News and commented:
IIRC SC24 was called more than once so is this the minimum? Time will tell.
Solar cycle 24-25 transition still ongoing – currently 33 days with no sunspots.
https://spaceweather.com/archive.php?view=1&day=23&month=09&year=2020
– – –
18% increase in cosmic rays from 2015 to 2018.
https://spaceweather.com/archive.php?view=1&day=22&month=09&year=2020