


It’s finally happening. Thanks to Herculean efforts by Niklas Morner, we are presenting a two-day conference in central London on the 8-9th September. Speakers are coming from all over the world to present their work, and it is not to be missed!
![]()
Take the 8-9th September off work and join us for this historic event. The first UK climate conference in decades which will counter the scaremongering of the IPCC with a cool, rational approach to the study of climate change, presenting alternative explanations, new data, theory and commentary. Topics include solar-planetary theory, causes of ENSO, sea ice extent, sea level, ozone depletion, volcanos, regional forecasting, journal gatekeeping and many more.
The list of contributors is long, we are packing a huge number of presentations into this two day event. Speakers include Niklas Morner, myself, Ned Nikolov and Karl Zeller, Nicola Scafetta, Per Strandberg, Jan-Erik Solheim, and thats before lunch on day one! Piers Corbyn will be there! So will Christopher Monckton! See the full programme and the extended abstracts in this 35 Megabyte document for full details. There are also some travel and booking details on the geoethic.com website. An updated version is available on reseachgate
Due to a last-minute venue change, we now have large amounts of extra space for attendees. Please come along and help fill the hall with enquiring minds. We don’t have a charging structure and contributions are non-compulsory. However, the venue change was forced on us by UCL getting huffy about “members of the UCL community expressing concern that we are giving a platform to speakers who deny anthropogenic climate change”, and the only venue we could get at short notice was Conway Hall, which costs a lot to hire.
So please donate to help offset costs. The sudden venue change (isn’t that what happens to all sceptics these days) means we need about £5000. Amazingly we already have nearly half that, and just need a bit more help. If 100 attendees donate £15 per day each, we will be set (thank you). If this were a government funded gravy train, it would cost hundreds to see lame predictable presentations by researchers who aren’t brave enough to question the dogma. Come to London, see ground-breaking presentations, and the opportunity to chat to the scientists and contributors who are pushing the bounds of science (and politics too, though they probably never intended to). If you can’t make it, but still want to support the unfunded efforts of our speakers to bring climate-realism to the public eye, you can join the team and donate via the paypal button top left on this site. I will gratefully pass on any donations received to Niklas Morner and you’ll get a mention in the conference proceedings when they are published.
UPDATE: Niklas Morner just emailed me to say we can make time in the programme to launch CLEXIT – the new organisation seeking to take all nations out of the Paris Climate Treaty.

Reblogged this on WeatherAction News and commented:
“We are packing a huge number of presentations into this two day event. Speakers include Niklas Morner, myself, Ned Nikolov and Karl Zeller, Nicola Scafetta, Per Strandberg, Jan-Erik Solheim, and thats before lunch on day one! Piers Corbyn will be there! So will Christopher Monckton!”
Bet its never mentioned / reported by the main media channels unless it attracts a huge crowd of red or green haired protesters outside
Well as it happens, I have someone who’s quite prominent on BBC Radio 4 interested in coming down to our event, so we’ll see. 🙂
The first donation of £15/day has come in on Paypal from John B in Leicestershire. Shame you can’t join us, but Thank you sir!
I’ve been doing exploration that can help ENSO modelers with diagnostic constraint. (See recent Suggestions threads accessible from the main menu above.)
For example, SLP & SST field observations suggest ENSO has a roughly 96 year volatility envelope (systematically aliased in long-run central limit from predictable overlaps of discrete (off/on) features of QBO, semi-annual, & annual circulations) with a bidecadal oscillation (BDO) discernible even with the naked eye.
The pattern is coherent with a range of geophysical variables (including core angular momentum estimated from geomagnetic records, polar deposition of volcanic aerosols recorded in ice cores, Southern Ocean surface temperatures, and interhemispheric circulation) so I’m strongly advising against ignoring it’s diagnostic utility for realistic model refinement.
I also want to make a brief comment on these forced venue changes that keep happening when people who appreciate and respect natural climate variations gather: It’s transparently unethical to be prejudiced against people who appreciate and respect nature.
I hope they explain the science of why radiative gasses in the atmosphere CANNOT TRAP HEAT.
Richard111, radiative gases don’t ‘trap heat’, but they do absorb radiative energy that would otherwise pass through the atmosphere to space, converting it to internal (kinetic) energy. But this energy is rapidly transferred kinetically to the overwhelmingly non-radiative gases around them.
The issue, therefore, is not whether there is a theoretical tropospheric warming effect due to radiative gases but whether this translates into a discernible increase in tropospheric temperatures. All the empirical data points towards the fact that it does not.
So implying that it is theoretically impossible for radiative gases to affect temperature just walks into the hands of the extremist ‘slayers’ (they have gone quiet recently haven’t they?) and is in danger of making CAGW skeptics (of whom I am definitely one) a laughing stock in the eyes of mainstream scientists.
David, the real point might be that water does not need CO2’s help, but a purely N2/O2 atmosphere (not really feasible) might have to expand too much and be lost.
Have a little read Richard. http://www.drroyspencer.com/2016/07/the-warm-earth-greenhouse-effect-or-atmospheric-pressure/
Okay David. We have an effective black body surface radiating at 15C. About 100 metres up we have a few CO2 molecules at local air temperature of 14C (dry adiabatic lapse rate). Are you telling me those CO2 moles can absorb some photons from the surface?
We know precisely the absorption/emission range of CO2 for all temperatures.
Please explain which range of photons those CO2 molecules are absorbing and how the energy is transferred to the other nearby air molecules.
£15 donated…a pleasure to help with this event. I hope all your generous readers help too. I would very much like to attend but distance and children prevent. Will it be filmed and available thereafter? Thank you so much for your ongoing efforts.
More news. I’ve been asked by Viv Forbes and Christopher Monckton to head-up the Clexit UK campaign. See the post over on Paul Homewood’s site for what Clexit is aiming to achieve.
More donations have come in from Laurie W in AUS, Mark F in Surrey, Caroline K in Bristol, Edward H up in the Borders and Mike B in S. Wales. Thank you all for your support!
Richard III: I hope they explain the science of why radiative gasses in the atmosphere CANNOT TRAP HEAT.
Come to the conference. You’ll be able to meet and chat with Ned Nikolov and Karl Zeller, the originators of the Universal Theory of Climate.
Nice one TB. Philippines President could be your role model – ‘wants to kick someone’ 😎
Clexit-coming? President of Philippines says Paris climate deal is stupid nonsense. Wants to kick someone.
http://joannenova.com.au/2016/07/clexit-coming-president-of-philippines-says-paris-climate-deal-is-stupid-nonsense-wants-to-kick-someone/
Thanks for the invite TB but as an arthritic pensioner living in South West Wales it is not an option
Will enjoy reading up on it anyway.
I had a read of Roy Spencer’s link and… ahem, he talks about the air warming the surface!
Now I am not any sort of scientist. I rely on my life experiences. What little I know about climate is from my private pilots and ocean yacht sailing escapades in my dim and distant past.
An example… I’ve lived and worked in Saudi Arabia and the Namib Desert in South West Africa.
On a calm clear day and the sun is up, especially in the summer, the GROUND GETS HOT!
So much so that you can’t walk around with bare feet until well after sunset. Where did the heat go? The air took some and the rest went by radiation. Just before dawn the temperature can have dropped to almost freezing. In fact some 2,000 years ago the Romans would dig a dry well in the desert and place a small tray of water at the bottom. In the morning that water would be ice! A treat for the boss man. I wish I’d known about that back then. Instead I wasted my time building a runway near the work site so I could show off. 🙂
Because of these experiences I’ve NEVER believed in the possibility of AGW from human induced CO2 pollution so I had to read up the science. The science convinced me I am right.
Just to give the argument some bite… radiative gases in the atmosphere do indeed radiate to the surface but none of the energy can warm the surface and NONE OF THAT RADIATION IS BACK RADIATION. The science of this is very simple and straight forward.
The Californian dark agents of climate ignorance &/or deception (and their associates) should never be allowed any influence. They’re too corrupt and underhanded. Their methods are intolerably unethical. Any infiltration and/or influence from them (and/or their associates) will sabotage and undermine. Unwisely allowing them artificially engineered dominance on a central platform was a serious mistake. For the trouble they have caused I recommend not only exclusion from new organizations but also expulsion from existing ones.
Tallbloke in sharp contrast appreciates and respects domineering nature and I recommend that those in favor of true justice (rather than artificially engineered Californian & Mainland European communications bubbles that eventually burst) take serious measures to help put TB on a solid footing so that he may focus on achieving his full potential.
James Delingpole takes aim at the writer of this:
“It has been brought to my attention that you have booked a room at University College, London, for an external conference in September for a rather fringe group discussing aspects of climate science.
“If this event were to go ahead at UCL, it would generate a great deal of strong feeling, indeed it already has, as members of the UCL community are expressing concern to me that we are giving a platform to speakers who deny anthropogenic climate change while flying in the face of accepted scientific methods. I am sure you have no desire to bring UCL into disrepute, or to cause dissension in the UCL community, and I would encourage you to think about moving the event to a different venue, not on UCL premises.”
Meet the Bullying Lefty Cockwomble Physics Prof Who Hates Actual Climate Science
http://www.breitbart.com/london/2016/08/02/meet-the-bullying-lefty-cockwomble-physics-prof-who-hates-actual-climate-science/
JD: ‘Are we really sure this left-wing agitator, preeningly self-righteous bloviator and magisterial cockwomble is in any moral position to decide what is and isn’t a suitable subject matter for a scientific conference in his own field – let alone in one he so patently doesn’t understand.’
—
All part of the predictable behaviour of the so-called establishment.
Ach! I was a bit slow finding this…
http://hockeyschtick.blogspot.co.uk/2016/06/new-paper-demonstrates-gravito-thermal.html
If you looked in the left column, you’d also find this.
And this
All their stuff was originally posted here at the talkshop
Not developed the habit of looking at the left column. 🙂
Looking at the suggested tidbits now.
I fall down straight away…
“We start with the undisputable fact that the atmosphere provides extra warmth to the surface of Earth compared to an airless environment such as on the Moon.”
As I stated above I have lived and worked in deserts where daytime temps approach 50C and that same night temps can drop to almost zero.
I can touch a nearby rock and it feels cool. Hit it with a hammer and knock a big flake off and the newly exposed rock is much warmer. How is the air controlling the temperature of that rock?
Get similar here in South West Wales. Get a clear sunny day (not common), little to no wind, and temps can rise to high twenties. After sunset, with clear skies and calm air, temps drop to around 10C or so. And now, as often happens as we are coastal, a cloud layer moves in overhead. Temperatures start rising! Heat from clouds! Of course not. Adiabatic lapse rate still applies and that cloud base at say 1 kilometre up is 10 degrees colder than the surface, the temperature within 1.5 metres of the surface is rising. The answer is back radiation from WATER in the clouds limiting the effective surface radiation.
So from personal observation clear calm air cools quite rapidly in the absence of sunlight. As far as I can work out from the science this is due to land surfaces cooling rapidly compared to sea surfaces. Do some night time sailing to experience this.
Rock surfaces can lose heat rapidly by radiation, the warm air above has little to no effect as the air in contact with the rock cools and cannot provide warming. Wind effects can change that but that is another story.
May Clexit be PURE SUN.
Boot out anyone who doesn’t think it’s the sun. No apologies.
Hard Line: NO more anti-sun corruption.
Richard III; read on, the warmth provided by the atmosphere is NOT due to its composition so much as its mass.
Consider the effect of the surface pressure caused by gravity acting on the atmosphere’s mass on the rate of evaporation from the oceans for example.
Paul V; I’m currently co-authoring a paper with Pavel Kalenda which will show quite clearly that it’s the sun. 🙂
Interesting factoid I stumbled on, Pan evaporation rate has decreased over the last 50 years as this AGW warming has progressed. Now why would evaporation DECREASE as temperatures INCREASE? Maybe the surface density/altitude has Increased…pg
CLEXIT…………….I love it.
That bird might fly!
David Cosserat,
Great comment.
Once the atmospheric pressure exceeds 0.1 bar, “Greenhouse Gases” absorb radiation much more strongly owing to collision broadening. The collisions transfer energy to the “main bulk of the atmosphere” (to quote the 1896 Arrhenius paper on which the false CAGW hypothesis is based) with the result that surface radiation is captured by gases that can’t absorb thermal IR radiation directly. The mathematical basis for this theory can be found in the appendices to this NatGeo letter:
Click to access Robinson2014_0.1bar_Tropopause.pdf
Richard III,
“So from personal observation clear calm air cools quite rapidly in the absence of sunlight. As far as I can work out from the science this is due to land surfaces cooling rapidly compared to sea surfaces. Do some night time sailing to experience this.
Rock surfaces can lose heat rapidly by radiation, the warm air above has little to no effect as the air in contact with the rock cools and cannot provide warming. Wind effects can change that but that is another story.”
The surface of a desert cools rapidly at night owing to thermal radiation but very little of this radiation is lost directly into space owing to the presence of CO2 (a Greenhouse Gas). Most of the outgoing energy is captured by the atmosphere thanks to collision broadening and the high surface pressure (1 bar at sea level). Whether the energy is captured by the atmosphere or is lost directly into space makes very little difference to the surface temperature.
Here in Florida water vapour usually captures the IR that the surface radiates even more efficiently than CO2 can. As the surface cools condensation often occurs within a foot of the ground (due to conduction) which tends to prevent the surface temperature falling any further owing to the high heat of vaporization of water (540 calories per gram). Deserts cool much more dramatically at night owing to the lack of water vapour.
Okay GC, I read you, please explain which bands of surface radiation are captured by CO2 anywhere in the atmosphere and what happens to that energy.
So you understand where I’m coming from I believe black body theory explains temperature limitations of any IR frequency range from ANY material. This applies to absorption AND emission.
Looking forward to learning that ‘greenhouse gases’ really exist (not).
If the 33 degree temperature difference in the atmosphere is a problem consider the MASS of the atmosphere which consists mainly of nitrogen, oxygen and argon, some 99.9% in total. These are essentially NON-RADIATIVE gases and are warmed by surface heat mostly and with some help from radiatively active gases in the atmosphere BUT ONLY when the sun is shining.
It is generally believed that warmed air expands, rises and cools. Now where did that energy go? 99.9% of atmospheric gases CANNOT cool by radiation!
Interesting world we live in.
Richard III: warmed air expands, rises and cools. Now where did that energy go?
The temperature falls because the energy is spread over a larger volume as the gas expands in the less dense higher region of the atmosphere.
[…] koottua joukkojaan tulevaan tieteelliseen seminaariin Lontooseen (Linkki). Asiasta uutisoi Tallbloke-blogi (Linkki) ja suomeksi nimimerkki Mörri_Möykky Suomi24:n Ilmastonmuutospalstalla. Konferenssin […]
Another donation this morning from Freddie S in Switzerland – thank you sir!
Nothing yet from our regulars here. Please help – we need to pay a big and unexpected bill for the hire of the venue, and have lots of room for more attendees. Come on down!
Hi TB, my lack of formal education on this subject limits my ability to explain my thinking but here goes.
I read in many science papers that energy can neither be created nor destroyed, only transformed.
As air molecules move apart with increasing altitude the kinetic collision rate reduces. This will
indicate a temperature drop but the molecules will have acquired some gravity potential. An
instance of energy transform.
As for the radiative molecules I read that “mass density alters the ratio between conduction and
photon emission at any given temperature.” In other words as kinetic collisions reduce photon
emission becomes more effective. I take this to mean radiative cooling works better in low density air.
It is a given that radiative molecules in the atmosphere emit over 360 degrees cubed thus at altitudes
of say 5 miles and above far more than half the emitted photons can escape to space.
Consider the emission from the 6kg of CO2 in any 1 square metre column of atmosphere radiating
away over the 13 to 17 micron bands of which less than half that photon energy reaches the surface.
There will be no warming of the surface, at best a very slight delay n the cooling of the surface by some six thousandths of 1 percent and that can only happen when the sun is absent.
Well good luck with the meeting TB. I hope to read some good science on how and why ‘greenhouse
gases’ are a meaningless concept with regard to ‘climate change’.
@Richard111; It appears to me, you understand very well.
“Those that can, will learn. Those that can’t, must be taught.” pg
This Green House Gas mime is a word contradiction lie. Oxygen and Nitrogen are Insulators, while Carbon dioxide and Water vapor are conductors of energy.
While I may be “uneducated”, I am a builder, inventor and farmer and know a bit about gases, greenhouses and refrigeration.
Specialists are trained to use their own special “Buzz Words” in their communications as a verbal short hand and a means to confuse outsiders. This leads to confusion of everyone involved. Just read the comments on this blog to see this in action. Lots of noise and little real communication…pg
@ Tallbloke, I am Impressed! You seem to be becoming a central figure to the dawn of this new age.
The Elites think that the Internet is their communication tool for world dominance. Fools!
Now all of the people of the World can communicate in real time and with their own languages, outside the control of the main stream media Elites.
Knowledge and information is now available to all that wish to take part in decision making, Large and Small.
As for the Ruling Elites, WE Don’t Need Them!…pg
Its director says part of the Olympic ceremony in Rio tonight is going to be promoting ‘climate change’. Yawn 😦
The usual climate fearmongers are already banging their Olympic drum e.g.
http://www.climatechangenews.com/2016/08/05/landslides-zika-and-beach-loss-rio-de-janeiro-prepares-for-climate-change/
Folks, can I suggest you do a search for “water vapour dimers” and you will learn that the true spectrum for water vapour is more than DOUBLE the published level.
Read this abstract!
http://centaur.reading.ac.uk/19345/
Richard: here’s a 2014 study by two of the same authors…
http://onlinelibrary.wiley.com/doi/10.1002/qj.2385/full
Section 4 = Possible climate change implications
Richard111 says:
August 5, 2016 at 2:21 pm
I read in many science papers that energy can neither be created nor destroyed, only transformed.
As air molecules move apart with increasing altitude the kinetic collision rate reduces. This will
indicate a temperature drop but the molecules will have acquired some gravity potential. An instance of energy transform.
I also think this is explanation of the atmospheric lase rate because it uses this minimum set of laws of physics:
Energy can be transformed and is then conserved. (Thermodynamics)
Mass as gas has temperature caused by rate of colliding molecules. (Kinetic theory of gas)
Gravity acts on mass to cause change of velocity. (Newtons Laws of Motion)
It does not use:
the concept of expansion or mass density.
the theory of continuous fluid dynamics
the gas law
Phew! Thanks… I think. 🙂
Richard III, you’ll find this of interest too.
Click to access 2578.full.pdf
“In the2500 cm−1 region, the model does not allow for the nitrogen fundamental collisioninduced absorption (CIA) band intensity enhancement caused by H2O:N2 collisions and underestimates the actual absorption by over two orders of magnitude.”
Richard111, August 4, 2016 at 6:36 am
“Okay GC, I read you, please explain which bands of surface radiation are captured by CO2 anywhere in the atmosphere and what happens to that energy.”
The effect of atmospheric gases on surface temperature can best be understood by constructing mathematical models and then testing them against observations. Over the years such models get “tweaked”.
Here is a link to a NatGeo letter that describes a model that achieves an impressive correlation with reality:
Click to access Robinson2014_0.1bar_Tropopause.pdf
The answer to your question is contained in the 35 pages of “Supplementary Information” attached to the letter. To save you the trouble of wading though the mathematics I will attempt a qualitative explanation of what the model does.
The model is based on heat transfer equations in gases by radiation and convection (conduction is ignored).
The radiative processes are simplified into “Channels”. There is one “Down Channel” representing incoming solar radiation and two “Up Channels” representing outgoing thermal IR radiation.
When pressure is low (0.2 bar) pressure broadening kicks in with the effect that absorption eventually varies as the square of pressure.
As a result three distinct regions are formed in most planetary atmospheres:
Stratosphere……where radiation dominates and temperature rises with altitude.
Tropopause…….a transition region usually found at around 0.1-0.2 bar.
Troposphere……where radiation and convection work together so that temperature falls with altitiude at a rate of -g/Cp.
Using physical properties that you can look up in any physics reference book this model works well for five of the bodies in our solar system with significant atmospheres, namely Venus, Saturn, Jupiter, Neptune and Uranus.
The model does not work well for Earth or Titan owing to the presence of oceans on both bodies. Robinson and Catling do not present a “First Principles” analysis to address this problem. Instead they introduce a fiddle factor called “Alpha”. Think of this as the ratio between the dry and wet Adiabatic Lapse Rates.
Using the appropriate “Alpha” the Robinson & Catling model works well for both Earth and Titan. Here is a link that covers Titan:
The model uses pressure as the major variable using polynomials only and does a good job of explaining what is observed. In contrast the Arrhenius theory based on the logarithm of CO2 pressure does not explain what is observed.
Oooops! I pressed the submit button too soon!
“The radiative processes are simplified into “Channels”. There is one “Down Channel” representing incoming solar radiation and two “Up Channels” representing outgoing thermal IR radiation.
When pressure is low (0.2 bar) pressure broadening kicks in with the effect that absorption eventually varies as the square of pressure.”
Here is what I meant to say:
“The radiative processes are simplified into “Channels”. There is one “Down Channel” representing incoming solar radiation and two “Up Channels” representing outgoing thermal IR radiation.
When pressure is low (0.2 bar) pressure broadening kicks in with the effect that absorption eventually varies as the square of pressure.
Apparently it was not my mistake after all. It seems that the use of the “less than” and “greater than” symbols caused WordPress to do something unexpected. I humbly ask Tallbloke to work with me offline to get my comment to come out as intended.
[Reply] There is a way round it, which is to use the sequence ampersand lt semicolon for less than < and ampersand gt semicolon for greater than > Cheers TB
David Cosserat says: August 2, 2016 at 8:42 am
“So implying that it is theoretically impossible for radiative gases to affect temperature just walks into the hands of the extremist ‘slayers’ (they have gone quiet recently haven’t they?) and is in danger of making CAGW skeptics (of whom I am definitely one) a laughing stock in the eyes of mainstream scientists.”
David,
the reason most of the “slayers” went quiet is that many were false-flag, and they won. Lukewarm sceptics now fear, just as you, to challenge the conjecture of a NET atmospheric radiative GHE for fear of being a “laughing stock”. WUWT has intellectually died due to Willis and Viscount Monckton enforcing their lukewarmer position. But “warming but less than we thought” is not a winning argument. Scientifically, less wrong is still wrong. I am not a “slayer”, but base my challenge to the conjecture of an atmospheric radiative GHE on solid repeatable empirical experiments.
So called radiative gases can warm by absorbing LWIR and cool by emitting it. Tyndall’s experiments demonstrated this in 1859 and 1860 respectively. But these empirical experiments give no answer as to the NET effect of these gases in the atmosphere and on surface temperatures.
Some simple questions :
1. How would the atmosphere cool were it not for radiative gases?
2. How hot would the atmosphere get were it not for radiative cooling?
3. How hot would the surface get were it not for cooling by our radiatively cooled atmosphere?
4. Does the surface have an equal ability to conductively warm and cool a gas atmosphere in a gravity field?
5. For an atmosphere without radiative gases, over a planet with a diurnal solar cycle, would the bulk of the atmosphere have its temperature driven by surface Tav or surface Tmax?
6. Can surface incident LWIR heat or slow the cooling rate of liquid water free to evaporatively cool?
7. Does 1 watt of LWIR have the same heating effect on liquid water as 1 watt of SW?
8. Is the hemispherical LWIR emissivity of liquid water .98 or .67?
All of these questions and more can be answered with relatively simple empirical experiments and observations. And the right answers lead to a simple answer: The reason surface temperatures run hotter on our planet than a “near blackbody” receiving 240 w/m2 of solar illumination is because surface of our planet is nowhere near a “near blackbody”. 71% of the surface is ocean, an extreme SW selective surface. Empirical experiment shows solar illumination in a diurnal cycle peaking near 1000 w/m2 would drive our oceans to around 335K were it not for conductive and evaporative cooling by our radiatively cooled atmosphere.
David, lukewarmers avoiding empirical experiment and accepting the flawed assumptions of the AGW conjecture out of fear of looking foolish, is very foolish. Especially in the age of permanent Internet record.
Konrad, thank you for this comment. I was going to reply to gallopingcamel’s radiative channels but your questions cover more than I could think of to ask.
Thanks Konrad and GC.
The key point here as I see it, is that the ocean has to rise to the temperature it is currently at, in order to lose energy as fast as it arrives in it from the Sun. On the average, this is a considerably higher temperature than the average surface temperature of the Moon has to be, even though cloud albedo means around a third less SW arrives at Earth’s ocean surface. This is because the Moon is able to radiate directly into space, whereas the Earth’s ocean has to be warm enough at the surface to evaporate into an atmosphere at 1 bar pressure and radiate into an atmosphere which absorbs its LWIR radiation and warms, reducing the temperature differential, which also slows conduction of energy away from the ocean surface.
Hence R&C’s ‘alpha’ fudge factor, and Konrads ‘effective emissivity’ of seawater at 0.67. In fact, it’s noticeable that the difference between the wet and dry lapse rates is around a third, and the difference between the ‘official’ and ‘effective’ water emissivities is also around a third. Amusingly, this leads to an average global surface temperature on Earth around a third higher than that of the Moon.
For R&C (and the mainstream warmists) it’s an atmospheric effect. For Konrad it’s an ocean effect. What I’m trying to point out is that it’s a bit of both.
Richard111 says: August 7, 2016 at 7:23 am
Richard,
you do not look foolish, let alone a “laughing stock” in my eyes for questioning the assumptions that lukewarmers blindly accept.
David Cosserat is the one who looks foolish. “Warming, but less than we thought”, “immeasurably slight warming” or “Blah, blah bah…”. It doesn’t matter. Either you got that radiative gases cause surface cooling at all concentrations over 0.0 ppm or you didn’t. The truth here is black or white, wrong or right. Degrees don’t matter. Either our radiative cooled atmosphere cases surface warming or surface cooling. The Internet record is permanent. David chose “warming”. The Global warming hoax was in effect a Global IQ test with results permanently recorded on the Internet. David Cosserat failed, and the record of this is permanent.
Despite WUWT intellectually failing, Anthony Watts is in the clear by me. (empiricist). Not so Willis, Monckton and Dr. S. (Modellers). My being a hard sceptic, Anthony has banned me from his site. I still cannot really bring myself to criticise him and what he has achieved. I believe that the AGW hoax was the greatest assault on science, reason, freedom and democracy in human history. Watts stood and fought. Just as I stand and fight.
Richard 111 says “It is a given that radiative molecules in the atmosphere emit over 360 degrees cubed thus at altitudes of say 5 miles and above far more than half the emitted photons can escape to space”
Sorry, but this is not true. Any engineer who has had actual experience with heat transfer knows it is not correct. It is a fraudulent statement by some alarmists to justify their version of surface heating from CO2.
For a summary of heat & mass transfer (including Heat Transfer by Radiation) read chapter 5 of the Chemical Engineering Handbook. There is a similar Chapter in Mark’s Mechanical Engineering Handbook. So-called climate scientists have no understanding or experience in Heat Transfer
The 4th Postulate of Thermodynamics says ” The entropy change of any system and its surroundings considered together resulting from any real process is positive approaching zero when the process approaches reversibility” . That applies to molecules of gas.
Cementafriend,
whoops! Maybe you shouldn’t have typed that…
Richard111 is right. It’s not a two way street.
Buy a LWIR bolometer. Measure the sky. Primary LWIR emission from the atmosphere is not from “radiative gases” such as CO2 or H2O vapour. It’s from clouds! You know, water droplets… condensed H2O?
When a rising moist airmass hits condensation altitude and cloud forms, a massive amount of latent heat is released and dissipates rapidly via LWIR radiation. What’s below the forming cloud? Rising warm moist air, highly LWIR opaque. And above those hot radiating cloud tops…?
Cementafriend, it’s not a normal two way street. Yes gases and liquids in our atmosphere can absorb and emit LWIR. But it’s only one lane back to 29% of the surface and two lanes to space.
(Side note: Where did you get that “5 km” thing from? I’m guessing you don’t have a pilots licence, but US standard atmosphere calcs are available to all. Median density / LWIR opacity should be 7.25 km.)
IT is the Water! ………..under the sun, that has created Earth’s atmosphere. The physics of our planet’s atmosphere is predicated on the physics of Water! and it’s response to the density pressure of the atmospheric pressure of the constituting gasses on H2O.
CO2 is too small an actor to have any relevance ..pg
Big thanks to Konrad for a more than generous donation to the conference venue hire. 🙂
Please help if you can – we still have a way to go to cover costs.
Iceagenow bangs the drum for Clexit.
Clexit Creeps Closer
‘This war on hydro-carbon energy has already caused massive losses to western industry. If allowed to continue as envisaged by the Paris Treaty, economic depression will follow and all nations will suffer.’
http://iceagenow.info/clexit-creeps-closer/
Konrad says:
August 7, 2016 at 3:57 am: please expand a little on the slayers problems with false flaggers. I missed that, being busy at the time. Thanks, Brett
Tallbloke has explained how to play nice with WordPress so I will attempt my reply to Richard111 one more time:
Richard111, August 4, 2016 at 6:36 am
“Okay GC, I read you, please explain which bands of surface radiation are captured by CO2 anywhere in the atmosphere and what happens to that energy.”
The effect of atmospheric gases on surface temperature can best be understood by constructing mathematical models and then testing them against observations. Over the years such models get “tweaked”.
Here is a link to a NatGeo letter that describes a model that achieves an impressive correlation with reality:
Click to access Robinson2014_0.1bar_Tropopause.pdf
The answer to your question is contained in the 35 pages of “Supplementary Information” attached to the letter. To save you the trouble of wading though the mathematics I will attempt a qualitative explanation of what the model does.
The model is based on heat transfer equations in gases by radiation and convection (conduction is ignored).
The radiative processes are simplified into “Channels”. There is one “Down Channel” representing incoming solar radiation and two “Up Channels” representing outgoing thermal IR radiation.
When pressure is low (< 0.1 bar) gases absorb radiation at a rate that varies linearly with pressure.
When pressure is high (> 0.2 bar) broadening kicks in with the effect that absorption eventually varies as the square of pressure.
As a result three distinct regions are formed in most planetary atmospheres:
Stratosphere……where radiation dominates and temperature rises with altitude.
Tropopause…….a transition region usually found at around 0.1-0.2 bar.
Troposphere……where radiation and convection work together so that temperature falls with altitiude at a rate of -g/Cp.
Using physical properties that you can look up in any physics reference book this model works well for five of the bodies in our solar system with significant atmospheres, namely Venus, Saturn, Jupiter, Neptune and Uranus.
The model does not work well for Earth or Titan owing to the presence of oceans on both bodies. Robinson and Catling do not present a “First Principles” analysis to address this problem. Instead they introduce a fiddle factor called “Alpha”. Think of this as the ratio between the dry and wet Adiabatic Lapse Rates.
Using the appropriate “Alpha” the Robinson & Catling model works well for both Earth and Titan. Here is a link that covers Titan:
The model uses pressure as the major variable using polynomials only and does a good job of explaining what is observed. In contrast the Arrhenius theory based on the logarithm of CO2 pressure does not explain what is observed.
Thanks for the links GC, but I will keep an open mind on atmospheric temperature “models”. I feel there is still a lot to learn.
Looking forward to reading reports from the ‘meeting’.
Richard III; chuck some money in the pot and you’ll get a link to the videos of the presentations. Sorry to harp on about it everyone, but we’re stuffed if we can’t cover the bill for the venue hire. Please help out, scientific freedom doesn’t come for free.
Brett Keane says: August 8, 2016 at 10:50 am
Brett,
expanding on that story would take an essay.
I do not know how the PSI (Principa Scientific International) website started, but prior to 2010, a tiny number of trolls, snowstormers and popcorn warriors at WUWT began linking to it. At first glance the website looked glossy, but on closer examination it appeared to be window dressing. The goods on display were dusty and dead flies could be seen. Infrequent posts with few if any comments.
Those linking to PSI typically tried to claim that LWIR emitted from a nearby cooler object could not slow the radiative cooling of a warmer object. A ridiculous assertion, easily disproved by simple empirical experiment (at least for all materials that can’t evaporatively cool and are poorly conductively coupled).
Initially the few tried to get sceptics to refer to and link to PSI. This failed as too many sceptics were engineering types, too well versed in physics to buy in. It did not matter that there were extra voices apparently on the sceptic side, because most sceptics are “principle before side” people. Their advances were rejected.
When these attempts failed, new tactics were tried. Side with and endorse any hard sceptic fighting Willis’ and Monckton’s lukewarmer reign at WUWT. But again they got it wrong. The last thing hard sceptics like myself need is the endorsement of those who have no clue about radiative physics or fluid dynamics.
And when those attempts failed, again new tactics were tried. Flood every thread where hard sceptics are thrashing lukewarmers with diversionary comments in an attempt to make anyone who questioned a net atmospheric radiative GHE look like one of the crazies.
In the end they blew it. Having failed to recruit sceptics, having failed to have hard sceptics gratefully accept their endorsement and having failed to silence hard sceptics at all sites, they threw the towel in. At the time climythoilogists, were frantically offering 70+ excuses for the pause. In a panicked rear-guard action, the BBC tried to claim a difference between “genuine sceptics” and those they had foully vilified as “holocaust deniers”. Informed by warmists, they offered up PSI as a “prominent group” of mainstream “deniers”. But on sceptic blogs they had never be prominent, accepted or endorsed. The warmists informing the BBC revealed they knew far more of PSI than sceptics did.
Did PSI start as a legitimate site? – Unknown.
Was PSI exploited and used in attempt to discredit sceptics? – Certain.
Did it work? – Ultimately, no.
(And “ultimately” is the game changer. For those attempting Alinsky techniques in the Internet age, the age of permanent record, ultimate failure is certain.)
gallopingcamel says: August 9, 2016 at 3:10 am
“The effect of atmospheric gases on surface temperature can best be understood by constructing mathematical models and then testing them against observations.”
Camelus velocitus,
after your work on the difference between S-B assumption and DIVINER measurements, I am shocked you can make that assertion.
The simplest way to determine the effect of atmospheric cases on surface temperatures is to determine a fair figure for “average surface temperature without radiative atmosphere” and compare it to measured average surface temperature.
You know that there is a 90K error between S-B assumption and DIVINER measurements for average Lunar regolith temperatures. Why should an 80K error between S-B assumption and Earth ocean temperature without atmospheric cooling be so surprising?
TB, you are on. I refuse to use paypal but contact me and I will send you debit card fifty smackers.
Tallbloke,
OT, I know. But you had a thread about DLR (downwelling longwave) that gave a source of a long-term dataset. In Switzerland, I think. But search as I might, I cannot find it again. Would you remember which thread that was?
Thanks,
Ralph
Konrad, thanks for the resume on PSI. A few trolls are working WUWT right now. I have seen their style before, even here in NZ where they helped destroy a blog on our equivalent of the BBC. Aided by the usual Journalistic bias to the Left. It became a little Marxist sounding box before it died.
Personally, I’m watching the North Atlantic deepwater flow on climate4you etc……
@ Ralph Ellis – have you tried this search?
site: tallbloke.wordpress.com downwelling longwave
Konrad, August 9, 2016 at 10:52 am
“You know that there is a 90K error between S-B assumption and DIVINER measurements for average Lunar regolith temperatures. Why should an 80K error between S-B assumption and Earth ocean temperature without atmospheric cooling be so surprising?”
Thanks for remembering my efforts (aided by Tim Channon and others) to model the Lunar surface temperature.
My calculations were based on S-B using one down channel to model incoming solar radiation and one up channel to model IR radiation emitted by the Lunar regolith. Because the Moon is not a “Black Body” it was necessary to assume an IR emissivity of 0.95. The incoming radiation was more tricky as the Moon is a non-Lambertian object in the visible spectrum with an Albedo varying from 0.1 to 0.5 according to the angle of incidence.
Tallbloke,
It would have been a blast to attend the conference given the superb set of speakers you have gathered. Sadly I will be house hunting in Colombia that week as a precaution in case Queen Hillary is crowned.
However I would like to contribute a few bucks towards your expenses if you will point me to the right link.
Please say “Hi, from Peter” to my esteemed ex-colleague from the Duke University Free Electron Laser Laboratory, Nicola Scafetta.
Oldbrew…
Thanks, yes I did, but no luck. It had a picture of a page in a book, with references ro radiation datasets. And that led me to a Science direct copy of that same DLR dataset.
No problem, I have a copy of the link on my computer. (but will not get back there for another three weeks).
Tahnks, Ralph.
Ralfellis: I think it was Davos and I think it was shortwave, but search on Davos and see.
Richard III: Thank You! I’ll email you some bank details.
GC: Thank You! The paypal link is at the top of the left Column on this site.
gallopingcamel says: August 10, 2016 at 12:28 am
“ The incoming radiation was more tricky as the Moon is a non-Lambertian object in the visible spectrum with an Albedo varying from 0.1 to 0.5 according to the angle of incidence.”
“non-Lambertian”, I’ll remember that one 😉
Will Janoschka, grumpy as he is, occasionally posts here. His early work lead to the development of the MODTRAN code so sadly abused by climastrologists. Some of this involved studying hemispherical emissivity of water. 40 years later I try to check the same thing and Will laughs at me. My experiments were crude, using a R34 cryo-cooled hohlraum over water and measuring off-zenith emissivity. Yet I found, as Will did all those years ago, that LWIR emissivity for water fell off a cliff after 55 degrees from zenith. The “basic physics” of the “settled science” was clearly wrong.
(Of course, now we have the infinitely tunable quantum cascade LWIR laser. Reflection is the corollary of emissivity/absorptivity. I’ll get Will yet. See if I don’t!)
Camelous Velocitus,
the point is this, standard S-B calcs like the climastrologists use couldn’t get you a match with DIVINER data. The reason is: ultra fine SW translucent basalt dust with sharp edges vacuum insulated. Not a “black body”, not a “grey body”. Surface properties are critical.
Given 70% of solar radiation makes it to our planet’s surface, surface properties are critical here too. SW/UV penetrates but millimetres into Lunar regolith but hundreds of metres into our oceans.
This is an ocean planet. Is “average surface temperature without radiative atmosphere” 255K or 312K? Is the net effect of our radiatively cooled atmosphere surface warming or cooling?
My empirically derived figure for “average surface temperature without radiative atmosphere” is 312K. Our current average for surface with radiative atmosphere is 288K. There are 7 billion bald mutated monkeys just like me on this vertiginous ball of rock and gas. But few prepared to debate in the age of permanent Internet record. If basics S-B didn’t work for lunar regolith, why should it be assumed it works for the surface of our ocean planet?
Hi Rog,
I hope my website might be of your interest:
http://globalenergybudget.com/
Hmm… don’t know what to make of this, assuming it is the same conference.
http://principia-scientific.org/egg-face-monckton-capitulates-slayer-science/
Hi Miklos. I’ll put up a post to draw attention to it. Thanks fro dropping by.
Nothing yet TB. Paypal have been hounding me for years for my bank details. I won’t use your donate button.
Hi Rog. The Guardian wrote yesterday:
“One of the great things about science is that it allows you to make predictions. Three top climate scientists just made a very bold prediction regarding sea level rise; we should know in a few years if they are correct”:
https://www.theguardian.com/environment/climate-consensus-97-per-cent/2016/aug/10/climate-scientists-make-a-bold-prediction-about-sea-level-rise
I made another bold prediction on my website, and we should know in a few years if I am correct:
“If the above-presented numerical relationships are long-standing and valid
and the Earth really maintains the said closed-system character,
then this increase in the greenhouse effect cannot happen.”
http://globalenergybudget.com/#I7
Do not be frightened by this ‘closed-system’ character; it is explained there in full detail.
Thanks.
Miklos.
Miklos Zagoni says: August 10, 2016 at 5:37 pm
———————————————————–
Miklos,
I gave your site a quick read. I do like that you included other historical models for comparison.
But therein lays the problem. Your modelling, just as the failed models you compare to have the same problem. In one word: “Surface”.
Solar SW and UV don’t just reach the surface of our planet, they penetrate 100’s of metres deep below it’s LWIR opaque surface. Deep into the poorly conductive, slowly convecting liquid below.
Empirical experiment and CFD (iterative calcs) are the only ways to get close. Linear maths is a dead end.
How hot would the surface of our ocean planet get were it not for evaporative and conductive cooling by our radiatively cooled atmosphere? This is the question you need to address.
Report says phoney climate claims are going unchallenged on the BBC.
http://www.thegwpf.com/bbc-let-emma-thompson-get-away-with-inaccurate-climate-change-claims-watchdog-finds/
Who knew?
Miklos Zagoni in his second link in the above post has a section “Questions and challenges”. There are three points -very interesting- that invite comment (from me anyway).
1) – Another stable global configuration?
2) — Ice ages? The trigger of the interglacial-glacial transitions?
3) –Where are the limits and the Achilles-heels of the stability of our climate?
They are all about STABILITY. The probable common pointer there is the presently unquestioned ‘ STABLE Obliquity’. I point MZ to this thread here: https://tallbloke.wordpress.com/2014/12/24/dodwells-surprising-study-of-the-obliquity-of-the-ecliptic/
That thread was a year ago. Since then the megalithic calendar has been proven functionally excellent, but it also goes a long way to prove that the indicated obliquity change did really occur during its functional days.
So -a prediction- there will be little sea-level rise, because the ‘blue marble’ gyro may kick in to another stable position. Its a big spanner-in-the-works, I know,,, but do not ignore the evidence..
T/B.
Can you send me bank details so that I contribute to Clexit.
Thankyou.
avro: Thanks for supporting us! Email incoming.
Poll Shows Voters Oppose Investigating Global Warming Skeptics
‘A Rasmussen report published Tuesday found that 69 percent of U.S. voters oppose such measures. Fifteen percent call investigations against so-called “deniers” a worthwhile use of time. A small portion — 16 percent — is undecided.’
http://dailycaller.com/2016/08/09/poll-shows-voters-oppose-investigating-global-warming-skeptics/
Konrad,
Naturally I agree with you when you find fault with S-B when applied to objects that are not “Black Bodies”.
That is one of the factors that causes “Consensus Scientists” to tell us that the average temperature of an airless Earth would be 255 Kelvin. They assume that Albedo can be represented by a simple constant rather than a complex function. However (IMHO) that is a minor error compared with making unrealistic assumptions about the thermal properties of regolith.
A planet with an icy surface will have a different average temperature than a similar one with a regolith surface.
Here’s another spanner-in-the-works. In the above posts it is assumed that incoming solar heating is distributed on the planet in a “Fixed” manner” because the variation in obliquity hovers only minimally around 23 degrees.
That assumption may be/is very wrong. Change the 23 to about ~14.5 degrees (it is measurable) and see what the changes will be. Then, as Miklos Z above correctly asks, “where and what is the trigger?”
Prof. Zharkova explains her solar research…expects 30-35 year ‘Maunder Minimum’…
James Delingpole covers the story.
http://www.breitbart.com/big-government/2016/08/12/winter-is-coming-warns-the-solar-physicist-the-alarmists-tried-to-silence/
Fancy a punt on a cooler future?
http://coolfuturesfundsmanagement.com/
At every moment of an Earth day most of the Earth is in the shade. This obviously includes the night side of the planet, but also every surface feature from mountains to sand grains to blades of grass, depending on the local elevation of the sun. Even sea waves shade other waves. Clouds not only reflect light back to space, they shade the surface which prevents solar energy conversion to LWIR. All this is modulated by the specific longitude/season exposed to the sun. How is this brought into energy conversion calculations when converting solar (non-LWIR) energy to LWIR by surface features?
gallopingcamel says: August 12, 2016 at 4:37 pm
“However (IMHO) that is a minor error compared with making unrealistic assumptions about the thermal properties of regolith”
Camelus velocitas,
While I agree that the miss-application of the S-B equation to lunar regolith lead to errors, I cannot agree that the miss-application to our planet’s surface was “minor” in comparison. For Lunar regolith, ultrafine SW translucent sharp edged vacuum insulated grains confound the use of the S-B equation.
Empirical experiment, both on earth, and on the DIVINER mission, show a 90K error between S-B assumption and reality. I am arguing on the basis of empirical experiment, that a similar error exists for 71% of our ocean planet’s surface. 255K? The S-B assumption is out by 80K for most of the surface of Earth.
How did the DIVINER engineers test their gear before launch?

Empirical experiment!
Can we do that for Earth’s oceans?

Yep!
Rog posted my first climate experiments here at Talkshop in 2011. I first investigated whether surface Incident LWIR could heat or slow the cooling rate of water free to evaporatively cool. Forget the computer, empirical experiment said “No!”. That ruled out atmospheric radiative GHE as to why the oceans were running 33K warmer than theoretical blackbody.
I did not leave it there. I designed and ran further experiments. The “Basic physics” of the “settled science” claimed 1 watt of SW had identical ability to warm the oceans as 1 watt of LWIR. Empirical experiment proves this false.
Lunar regolith is complex, but intermittently solar illuminated liquid water hundreds on metres deep is far harder. S-B can’t work. FEA won’t work. CFD or empirical experiment are the only options.
255K for “average surface temperature without radiative atmosphere”? As Einstein said: “That’s not right. It’s not even wrong”.
oldmanK says: August 12, 2016 at 6:01 pm
“Here’s another spanner-in-the-works. In the above posts it is assumed that incoming solar heating is distributed on the planet in a “Fixed” manner” because the variation in obliquity hovers only minimally around 23 degrees.
That assumption may be/is very wrong. Change the 23 to about ~14.5 degrees (it is measurable) and see what the changes will be. Then, as Miklos Z above correctly asks, “where and what is the trigger?”
I concur oldmanK. IMHO the spectral spread of insolation determines the maxima of/for heating to a receptive surface/atmosphere.
IMHO this has to be within the spectrum of UV and the insolation rate regulated by recent Sunspot activity and atmospheric O3 levels.
I believe that this is a precursor to a cloud formation that also, later, regulates insolation to the surface by way of deflecting insolation that can’t penetrate cloud, but only ‘diffuses’ UV.
Best regards, Ray.
Konrad,
“Lunar regolith is complex, but intermittently solar illuminated liquid water hundreds on metres deep is far harder. S-B can’t work. FEA won’t work. CFD or empirical experiment are the only options.”
Models involving water and clouds are currently above my pay grade. However I hope to be able to improve the Robinson & Catling model by adding cloud layers.
When it comes to modeling the lunar surface temperature here is a list of methods that worked in the sense that they were able to reproduce the Diviner temperature measurements with 1 Kelvin accuracy or better:
One dimensional model………………Ashwin Vasavada
Quickfield FEA…………………………..Gallopingcamel
Berkeley PSPICE……………………….Tim Channon
Linear Technology’s LTSPICE………br (a Tallbloke fan who wants to remain anonymous)
Given that all these models were in close agreement with reality (Diviner measurements) it seemed reasonable to use them to address some “What Ifs”.
TEMPERATURE OF AIRLESS BODIES IN EARTH’S ORBIT
255 K…..According to “Consensus Scientists”
197 K…..Measured by Diviner LRE
196 K…..Modeled using Quickfield
209 K…..Modeled for a rotation period of 24 hours instead of 709 hours using Quickfield.
Thus I estimated that speeding up the Moon’s rate of rotation to once every 24 hours would raise the average temperature by 13 Kelvin. So what if the Moon’s surface was magically converted to ice? Quickfield is well suited to solving such problems:
234 K…..Modeled for a surface made of ice instead of regolith using Quickfield.
While I am a great fan of models I am well aware of their limitations given the simplifying assumptions needed to reduce computations to something that can be done on a laptop. It is noteworthy that four completely different modeling methods are in such good agreement.
The Consensus claim of 255 K is wrong. A more plausible value is 209 K for a regolith surface and 234 K for an icy surface.
While I agree that S-B has the problems that you mention, representing Albedo as a function of the angle of incidence can provide excellent agreement between model and measurement (better than 0.6 K RMS) over the entire lunar day. Vasavada used an 8th order polynomial while Tim Channon and I used different trigonometrical functions.
Let’s agree to disagree about the effectiveness of FEAs or other numerical equation solvers. If you have something better can it estimate the temperature of an Airless Earth?
Latest Antarctica study led by the British Antarctic Survey finds even more ice than expected with gains exceeding losses:
‘“We’re essentially in agreement with other studies that show an increase in ice discharge in the Antarctic Peninsula and the Thwaites and Pine Island region of West Antarctica,” Jay Zwally, a glaciologist at NASA, said of the study.
“Our main disagreement is for East Antarctica and the interior of West Antarctica – there, we see an ice gain that exceeds the losses in the other areas,” Zwally said.
Read more: http://dailycaller.com/2016/08/12/only-0-18-of-antarctica-isnt-covered-by-snow-and-ice-study-finds/
BAS paper: http://www.the-cryosphere.net/10/1665/2016/tc-10-1665-2016.pdf
—
So much for runaway warming, in this region at least.
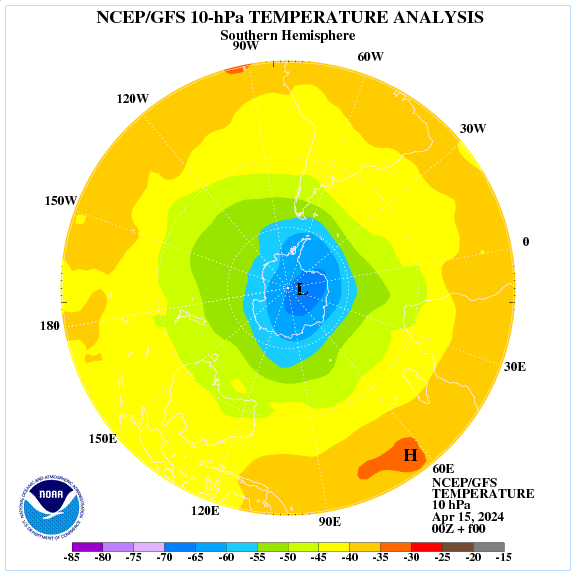
Polar vortex at an altitude of about 27 km.
https://earth.nullschool.net/#current/wind/isobaric/10hPa/orthographic=-213.37,-31.90,600
Temperature at a height of 3.5 km.
https://earth.nullschool.net/#current/wind/isobaric/700hPa/overlay=temp/orthographic=-213.37,-31.90,600
Distribution of ozone at an altitude of 27 km.
Roy Spencer’s latest attempt at a greenhouse effect demo/explanation.
‘The simple experiment is meant to simply demonstrate that the GHE exists…that is, that atmospheric greenhouse gases cause a warming tendency of surface temperatures.’
http://www.drroyspencer.com/2016/08/suggested-backyard-experiment-to-measure-the-greenhouse-effect-of-more-carbon-dioxide/
RS: ‘Suggestions are welcome. I’m only going to attempt things that are easy, cheap, and not time consuming.’
Oldbrew says:
August 15, 2016 at 3:12 pm
Roy Spencer’s latest attempt at a greenhouse effect demo/explanation.
RS: ‘Suggestions are welcome. I’m only going to attempt things that are easy, cheap, and not time consuming.’
“A minimum atmospheric temperature, or tropopause, occurs
at a pressure of around 0.1 bar in the atmospheres of Earth1
,
Titan2
, Jupiter3
, Saturn4
, Uranus and Neptune4
, despite great
differences in atmospheric composition, gravity, internal heat
and sunlight. In all of these bodies, the tropopause separates
a stratosphere with a temperature profile that is controlled
by the absorption of short-wave solar radiation, from a region
below characterized by convection, weather and clouds5,6
.
However, it is not obvious why the tropopause occurs at the
specific pressure near 0.1 bar. Here we use a simple, physically
based model7
to demonstrate that, at atmospheric pressures
lower than 0.1 bar, transparency to thermal radiation allows
short-wave heating to dominate, creating a stratosphere. At
higher pressures, atmospheres become opaque to thermal
radiation, causing temperatures to increase with depth and
convection to ensue. A common dependence of infrared
opacity on pressure, arising from the shared physics of
molecular absorption, sets the 0.1 bar tropopause. We reason
that a tropopause at a pressure of approximately 0.1 bar is
characteristic of many thick atmospheres, including exoplanets
and exomoons in our galaxy and beyond. Judicious use of this
rule could help constrain the atmospheric structure, and thus
the surface environments and habitability, of exoplanets.”
Click to access Robinson2014_0.1bar_Tropopause.pdf
Is ‘global warming’ mainly a Northern hemisphere phenomenon?
http://notrickszone.com/2016/08/15/abundant-scientific-evidence-that-global-warming-is-a-made-up-concept/
La Niña.


ren,
At last someone else who likes the R&C model! Check out how well it works for Titan:
oldmanK, suricat: Yes, external (astrophysical) parameters are important factors of the stability; what I show is that, contrary to common wisdom, there are also internal energetic regulations (flux patterns and constraint relationships) that help to maintain a steady state. See
http://globalenergybudget.com/#Foreword
Actually, the whole site is about the quantitative description of this constrained character of the global energy budget.
“As water evaporates from an area of the earth surface, the air over that area becomes moist. Moist air is lighter than the surrounding dry air, creating an unstable situation. When enough moist air has accumulated, all the moist air rises as a single packet, without mixing with the surrounding air. As more moist air forms along the surface, the process repeats, resulting in a series of discrete packets of moist air rising to form clouds.[5]
This process occurs when one or more of three possible lifting agents—cyclonic/frontal, convective, or orographic—causes air containing invisible water vapor to rise and cool to its dew point, the temperature at which the air becomes saturated. The main mechanism behind this process is adiabatic cooling.[6] Atmospheric pressure decreases with altitude, so the rising air expands in a process that expends energy and causes the air to cool, which makes water vapor condense into cloud.[7] Water vapor in saturated air is normally attracted to condensation nuclei such as dust and salt particles that are small enough to be held aloft by normal circulation of the air. The water droplets in a cloud have a normal radius of about 0.002 mm (0.00008 in). The droplets may collide to form larger droplets, which remain aloft as long as the velocity of the rising air within the cloud is equal to or greater than the terminal velocity of the droplets.”
https://en.wikipedia.org/wiki/Cloud_physics
Warm cloud process
a moisture laiden air parcel rises, cools at dry adiabatic lapse rate (~1oC/100m) until it reaches the dewpoint, at which point condensation occurs. After that, any further rise causes cooling at the moist adiabatic lapse rate (0.5 – 0.9oC/100m), because of the released latent heat.

http://www.ldeo.columbia.edu/~martins/climate_water/lectures/evap_precip.htm
The temperature at the North Pole decreases quickly.

Click.
In the Central Arctic ice extent in August increased clearly.

ftp://sidads.colorado.edu/DATASETS/NOAA/G02186/plots/4km/r11_Central_Arctic_ts_4km.png
https://iceagenow.info/video-headed-ice-age-scientist/
PROFESSOR ZHARKOVA has no agenda which makes what she says meaningful.
Further she has a good chance of being correct.
As far as the climate of the earth this period of time is in no way unique.
The climate in the big picture is controlled by Milankovitch Cycles, Land Ocean arrangements, with Solar Activity and the Geo Magnetic Field Strength of the earth superimposed upon this.
These factors then exert influences on the terrestrial items on the earth that determine the climate.
Terrestrial Items
Atmospheric Circulation
Sea Surface Temperatures
Global Cloud Coverage
Global Snow Coverage
Global Sea Ice Coverage
Enso
Volcanic Activity
All of this gives an x climate over x time. The historical climatic record supports this.
That is WHAT likely makes the climate change, NOT the scam they promote which is AGW.
The historical climatic record showing this period of time in the climate is in no way unique while changes in CO2 concentrations having no correlation in leading to resultant climate changes.
Now how the cooling evolves will have to be monitored. Of course going from an El Nino condition to an La Nina condition is going to cause an initial cooling.
For clues that if solar is involved the depth of the cooling will have to be monitored and if the cooling is accompanied by the terrestrial items I have mentioned above.
Each one of those terrestrial items having been shown to be linked to Milankovitch Cycles Land Ocean Arrangements in the big slow moving picture while solar and geo magnetic variability being factors that can change these terrestrial items on a much smaller time scale.
The solar parameters needed are
Solar Wind sub 350 km/sec.
AP index 5 or lower
EUV LIGHT 100 units or less
COSMIC RAY COUNTS – 6500 or greater
SOLAR IRRADIANCE – off by .15% or greater.
All very attainable going forward and being compounded by a weakening geo magnetic which if attained with sufficient duration of time will translate into bringing the terrestrial items that control our climate to values which will cause the climate to cool gradually if not in a sharp drop off if certain thresholds should be meant.
Related
Roger Andrews: How the Sun Caused All The Recent Global Warming
I think this does not take into consideration a prolonged minimum solar period of time which changes the dynamics as far as ENSO versus global temperatures. It will not apply or work under a prolonged minimal period of solar activity.
‘In 2009: Warming would stop 2020 Olympics. Now disaster moved to 2084’
http://joannenova.com.au/2016/08/in-2009-warming-would-stop-2020-olympics-now-disaster-moved-to-2084/
No gold medal for that failed warmist prediction. Add it to the ever-growing junk heap of climate alarmist nonsense.
ren: there’s a lot of confusion about lapse rates that I’ve been trying to sort through. I’ve written up my findings and new physics in
brindabella.id.au/downloads/Energy&Atmosphere-160816.pdf
I start with the definitions:
Dry adiabatic lapse rate, DALR or ALR: with no radiative gasses
Gravitational lapse rate, GLR: my preferred name for ALR
Moist lapse rate, MLR: air with moisture levels below saturation
Saturated lapse rate, SLR: air with water vapour at saturation levels
Environmental lapse rate, ELR: an actual lapse rate at a particular place and time
ALR, to be adiabatic, must have no radiative transfer, so is an abstraction because air always has radiative gasses. I’ve presented a simplified derivation of ALR that is easier to follow than the usual thermodynamic one and show them to be theoretically equivalent. It gives 9.66 Cº/km. The thermo. one gives 9.73 Cº/km using a measured Cp, or 9.66 Cº/km if you use a theoretical Cp. Both these values have gravity slightly adjusted to 5.5 km height.
The moist lapse rate allows radiative energy transfer and drops the lapse rate by short circuiting the temperature gradient, so increasing the height of the tropopause.
The saturated lapse rate allows for condensation.
In the article I also look at the skeptic’s hockey stick – plot of atmospheric water column against surface temperature that hits a wall at 30 Cº and provide evidence for why it is 30 Cº.
anyone: I’d really like some feedback and substantive criticism on this.
I think we need some summaries of the main skeptical arguments. Many will have points of disagreement with me. If you spell them out I want to add an appendix to the article summarising differences of opinion – an anti-consensus approach.
dai
Ahh. Went off and had lunch, came back refreshed, looked at the paragraph that was in the centre of the screen and noticed a serious omission.
The paragraph below Figure 2 now reads, with addition in italics:
Apart from energy that may be transported for centuries in deep ocean currents, and a little energy used in chemical reactions, all heat arriving from the sun is rapidly radiated back out into space.
dai
Miklos Zagoni says: August 15, 2016 at 10:26 pm
Hi Miklos, and thanks for your link.
Yes, the ‘depth to extinction’ is fundamental to our understanding of ‘OLR’ and ‘SW insolation’ in any scenario of/for ‘Earth’s energy budget’.
However, IMHO you need to make your understandings more ‘understood’ by using ‘plain English’ to describe this!
Your ‘papers’ explain this with a ‘math speak’ that doesn’t reach the ‘math’ compromised!
Please elucidate where this is possible. 🙂
Best regards, Ray.
To gallopingcamel’s comment regarding the Moon’s mean global temperature at https://tallbloke.wordpress.com/2016/08/01/new-dawn-of-truth-london-climate-change-conference-2016/#comment-118928
I strongly suggest reading this open-access paper, which explains in details the correct method for calculating the average surface temperature of airless spherical bodies:
Volokin and ReLlez (2014). On the average temperature of airless spherical bodies and the magnitude of Earth’s atmospheric thermal effect. SpringerPlus 3:723 DOI: 10.1186/2193-1801-3-723
https://springerplus.springeropen.com/articles/10.1186/2193-1801-3-723
Hi suricat,
You know, English is my second language and my experience is when I ‘explain’ something in plain text I typically confuse the reader even more. As I note in my website: In a sense, I am a Kepler-follower: “… a mind to whom all ultimate reality, the essence of religion, of truth and beauty, was contained in the language of numbers.”, as Arthur Koestler says about Kepler in The Sleepwalkers.
Rog wrote: “I’ll put up a post to draw attention to it”; I am thankful to him for this in advance as I think a learned Englishman will be able to describe this in words much better than me. I must confine myself to the data as much as I can.
Miklos, I am very English, we suffer the same way even when individuals share a common specialist language. Not everyone sees the same even via drawing.
Maybe keep trying.
Dai davies
Is worth remembering that water vapor is lighter than air.
“As water evaporates from an area of the earth surface, the air over that area becomes moist. Moist air is lighter than the surrounding dry air, creating an unstable situation. When enough moist air has accumulated, all the moist air rises as a single packet, without mixing with the surrounding air.”
Dai davies
Here you can see how warm and humid air rises in the east the USA. Clearly visible boundary between warm and cold air mass.
http://en.blitzortung.org/live_lightning_maps.php?map=30
ren
I usually don’t have time to do much more than skim over blog comments looking for key words. Yours jump out at me because of your use of graphics. I need to visualise data. I can sit back and absorb visuals without tiring my sad old eyes reading. Sometimes I can’t make much sense of yours because I’m not familiar with the topic, and you are often light on explanation.
In your comment at August 16, 2016 at 10:25 am, I presume you are referring to current data not yet showing the rise of the green one (average? things like ERA40 throw me). Any indications of cooling interest me. It’s a topic that needs a focussed summary page that’s regularly updated – somewhere doubters can be pointed to for an overview. Do you know of one?
dai
Miklos Zagoni says: August 17, 2016 at 10:30 am
“Hi suricat,
You know, English is my second language and my experience is when I ‘explain’ something in plain text I typically confuse the reader even more.”
There was no malice in my posting Miklos. Yes, I already understand this, but ‘mathematics’ also has its ‘dialects’. A little ‘explication’ (French for ‘explanation’) to the ‘algebra’ (scientific notation) wouldn’t be unappreciated.
“As I note in my website: In a sense, I am a Kepler-follower: “… a mind to whom all ultimate reality, the essence of religion, of truth and beauty, was contained in the language of numbers.”, as Arthur Koestler says about Kepler in The Sleepwalkers.”
I was not aware that a ‘paperback’ was pertinent to this discussion. However, ‘interaction’ IS.
‘DISCUSS’ (if we don’t understand, We’ll ask).
Best regards, Ray.
The question is: how diffuse CO2 has an impact on the growth of evaporation on warm oceans?
Heat capacity of water
In liquid water, hydrogen bonds are constantly formed and broken as water molecules slide past each other. The energy to break the hydrogen bonds comes from the kinetic energy, or energy of motion, of the water molecules. The average kinetic energy of a group of molecules is called its temperature.
It takes a lot of heat to increase the temperature of liquid water because some of the heat must be used to break hydrogen bonds between the molecules. In other words, water has a high specific heat capacity, which is defined as the amount of heat needed to raise the temperature of one gram of a substance by one degree Celsius. The amount of heat needed to raise the temperature of 1 g water by 1 °C is has its own name, the calorie. [Like in nutrition information?]
Because of its high heat capacity, water can minimize changes in temperature. For instance, the specific heat capacity of water is about five times greater than that of sand. The land cools faster than the sea once the sun goes down, and the slow-cooling water can release heat to nearby land during the night. Water is also used by warm-blooded animals to distribute heat through their bodies: it acts similarly to a car’s cooling system, transporting heat from warm places to cool places, causing the body to maintain a more even temperature.
Heat of vaporization of water
Just as it takes a lot of heat to increase the temperature of liquid water, it also takes an unusual amount of heat to vaporize a given amount of water, because hydrogen bonds must be broken in order for the molecules to fly off as gas. That is, water has a high heat of vaporization, the amount of energy needed to change one gram of a liquid substance to a gas at constant temperature.
Water’s heat of vaporization is around 540 cal/g at 100 °C, water’s boiling point. Note that some molecules of water – ones that happen to have high kinetic energy – will escape from water even at lower temperatures.
Sorry.
https://pl.khanacademy.org/science/biology/water-acids-and-bases/water-as-a-solid-liquid-and-gas/a/specific-heat-heat-of-vaporization-and-freezing-of-water
The inflow of cold and dry air causes an increase in condensation in the eastern United States.

Sun’s magnetic field. After rapid growth decline.

Ned Nikolov, August 17, 2016 at 4:58 am
To gallopingcamel’s comment regarding the Moon’s mean global temperature at https://tallbloke.wordpress.com/2016/08/01/new-dawn-of-truth-london-climate-change-conference-2016/#comment-118928
It would have been a blast to finally meet you and the other luminaries on September 8-9 but I will be house hunting in Columbia on those two days while enjoying perpetual spring in the coffee region.
I hope you will find time to talk to Nicola Scafetta my esteemed ex-colleague from Duke university. He probably understands Hölder’s inequality!
Turning to the paper you linked I am amazed that my amateur computation of the Moon’s surface temperature (196 K) is in such good agreement with professionals like Volokin and ReLlez (197 K). We can add those two gentlemen to the “Consensus” consisting of Tim Channon, Ashwin Vasavada, “br” and this camel.
Such rapid increases and decreases in temperature can be explained only by the rise and fall of evaporation on the equator.
http://woodfortrees.org/graph/uah/from:2010
Another wave of severe storms in Louisiana.
See above for water vapor over the USA.
tchannon says: August 17, 2016 at 11:23 am
Nice to see you back TC. 🙂
I concur. Data is shared here, but it needs a dialogue to promote the meaning behind that data to readers of ‘other’ disciplines.
Isn’t this, partly, why this is a ‘talkshop’?
Bestest regards, Ray. 🙂
Yes Ray, Thanks to the Tall Bloke, there is lots of discussion in the discourse and little “cussin”.
The Talkshop is always a pleasant place to stop a spell and visit. Maybe even learn something…pg
‘The sun not only reached its maximum at the end of the 20th century, but was apparently stronger than at any time over the past 10,000 years. Matthes et al. showed this in a very recent publication in the journal Geoscientific Model Development Discussions in 2016’
http://notrickszone.com/2016/08/20/austrian-solar-charts-expose-small-sensation-fractures-co2-warming-theory/
Konrad, re your reply to mine far above: I have always been wary of the warmer/cooler object interaction in relation to atmospheres, when used as an example.. Seems like an irrelevant straw horse to me. Significant new mass is introduced, and mass of a different phase i.e. solid. Gases can and do react differently. As in the gas laws and Maxwell’s Treatment of atmospheric gases And your and Prof. Woods etc. demonstrations. Not to mention most gassy bodies.
However, it would be a useful tactic if used to discredit ‘slayer’ and all non-warmists.
oldbrew says: August 21, 2016 at 9:35 am
“‘The sun not only reached its maximum at the end of the 20th century, but was apparently stronger than at any time over the past 10,000 years. Matthes et al. showed this in a very recent publication in the journal Geoscientific Model Development Discussions in 2016’”
I assume you relate to ‘TSI’ (Total Solar Irradiance) which covers ‘all spectra’?
The term ‘TSI’ can cause confusion because Sol irradiates at differing wavelengths that interact with differing outcomes for Earth’s absorption of Sol’s irradiation during the ‘cyclic’ wave-band variation of the ‘Sunspot cycle’.
‘TSI’ is ~constant, but the variation of ‘wavelength’ to Sol’s insolation alters greatly. For example; do we look to ‘the source’, or ‘the sink’, for ‘TSI’?
In the first case let’s look at ‘the source’. Sol’s ‘output’ before this encounters Earth’s atmosphere whilst reminding ourselves of how this ‘may’ be received by Earth’s atmosphere and surface.
‘EM emission’ (‘Electromagnetic’ emission) from Sol is ~constant, but the/this ‘EM emission’ varies greatly WRT ‘wavelength’ (the ‘frequency or, Hertz’ of the ’emission’). The EM emission from Sol ‘encompasses’ the spectrum/spectra of and through ‘LW Radio’ to ‘Gamma Ray’ and varies WRT sunspots and ‘CMEs’ (Coronal Mass Ejections), but EM emission isn’t the only consideration. ‘Particle emission’ also needs to be addressed (which also forces change to any EM emission) by way of the velocity of the ‘Solar wind’.
In the second case let’s look at the ‘sink’ of Earth’s atmosphere and surface that ‘may’ receive Sol’s insolation ‘of the day’, or perhaps not (this is really complex).
Its a ‘mess’ that needs to be pulled together though. Isn’t it? 🙂
Best regards, Ray.
The sudden geomagnetic storm and earthquake in Italy.

Lerwick picked it up clearly.

Source: http://www.geomag.bgs.ac.uk/education/current_activity.html
This is the caption for the graphic below:
Figure 17: The annual number of magnetic storms is represented by each bar of the histogram. Superimposed is the smoothed sunspot number. The dashed lines indicate solar minima and the dotted lines indicate solar maxima. Note the correlation of magnetic activity with solar activity and the apparent increase in magnetic activity with time during the 20th century [bold added]
Source: http://www.geomag.bgs.ac.uk/education/earthmag.html#_Toc2075558
Look at solar/magnetic activity now – cycle 24.
This is not the end of geomagnetic storms.
ren and oldbrew.
I’ve made a search for this subject and the return was rubbish. I’ve, unknowingly, read an ‘advert’ @ Volume: 27, Issue: 6, Nov 1991, at AIP where a ‘paper’ was ‘advertised’ for the use of a particular ‘sensor’.
This is/was not within my remit for the search!
However, the search turned up a site that may be of interest to you both:
http://www.bgs.ac.uk/home.html
See;
http://www.geomag.bgs.ac.uk/education/earthmag.html
to improve understanding of Earth’s magnetosphere.
Best regards, Ray.
Keep up the good work.
Thanks Ray. There’s also:
http://earthquakes.bgs.ac.uk/
Ren, thanks for all the information but it would be better in a separate post.
By the way the “calorie” in nutrition and food labeling is actually a kilocalorie (kcal), The comparative kJ on food labels is correct. 4.186kJ = 1 kcal
I suggest that you only use the ISO system rather than the old cgs system. That goes for pressure as well -in Australia we use kPa for tyre pressure and that is what should be used for atmospheric pressure instead of mbars (or sometimes hPa). I atmosphere pressure is 101.3 kPa. The correct ISO system goes up in 1000’s (example micron, mm, m, km, Mm etc- can’t type the micro symbol in html it seems to be µ )
It is visible in the the zone Jetstream significant amount of ozone. This is a direct connection to the stratosphere and the troposphere above the polar circles.


Sorry.
New paper finds “the equilibrium greenhouse sensitivity is zero.”
http://link.springer.com/article/10.1007/s40328-015-0138-0
Miklos, would have been nice to see the full article. The diagram with the abstract appears wrong. The past figures for downward SW was 168, For outgoing the convection was 24, The evaporation 78 and the radiation window was 66 (confirmed by Dr Trenberth). These figures are in balance (SW down 168, LW and other 168) so there is no need for the that ficticeous downward LW of over 300 w/m2. Of course the sensitivity is zero as I wrote here http://notrickszone.com/2016/08/25/uncovered-incoherent-conflicting-ipcc-beliefs-on-climate-sensitivity/#comments
The full article by Miklos Zagani is available at the link above.
From the Summary: ‘These relationships indicate that the distribution of energy in the system is not a free variable of the atmospheric greenhouse gas composition but predetermined by the boundary conditions. Physical explanation and theoretical interpretation require further research.’
cementafriend: 161 is better for SW surface absorption than 168. Convection 27, evaporation 80. The 66 is the correct clear-sky window; all-sky window is (1-beta)xWindow(clear). Surface LW radiative cooling 399. All with 1sigma = ±5 W/m2. Downward LW of 345 is OK.
oldbrew: Thanks. The article was written last year; now a proposed physical explanation is available at
http://globalenergybudget.com/#Intro
oldbrew says: August 26, 2016 at 6:23 pm
Thanks for the ‘heads up’ link OB, but the browser I’m currently using (MS Edge) doesn’t arrange the ‘place markers’ so well (some writings are unreadable). However, ‘MS Explorer’ presents the page as I believe it should be read.
Best regards, Ray.
Miklos Zagoni and the cosine of the solar zenith angle (μ) on are thoroughly considered, leading to an effective parameterization of as a nonlinear function of these three quantities. The parameterization is proven able to estimate with a mean bias error of 0.32 W m−2, which is one order of magnitude smaller than that derived using earlier linear or nonlinear functions. Applications of this new parameterization to estimate τa from , or vice versa, show that the root-mean-square errors were 0.08 and 10.0 Wm−2, respectively. Therefore, this study establishes a straightforward method to derive from τa or estimate τa from measurements if water vapor measurements are available.
Abstract
Aerosols impact clear-sky surface irradiance () through the effects of scattering and absorption. Linear or nonlinear relationships between aerosol optical depth (τa) and have been established to describe the aerosol direct radiative effect on (ADRE). However, considerable uncertainties remain associated with ADRE due to the incorrect estimation of (τa in the absence of aerosols). Based on data from the Aerosol Robotic Network, the effects of τa, water vapor content
http://www.nature.com/articles/srep14376
‘Climate change has less impact on drought than previously expected’
Recent studies have estimated that more than 70 percent of our planet will experience more drought as carbon dioxide levels quadruple from pre-industrial levels over about the next 100 years. But when researchers account for changes in plants’ water needs, this falls to 37 percent, with bigger differences concentrated in certain regions.
The reason is that when Earth’s atmosphere holds more carbon dioxide, plants actually benefit from having more of the molecules they need to build their carbon-rich bodies. Plants take in carbon dioxide through tiny openings called stomata that cover their leaves. But as they draw in carbon dioxide, moisture escapes. When carbon dioxide is more plentiful, the stomata don’t need to be open for as long, and so the plants lose less water. The plants thus draw less water from the soil through their roots. [bold added]
Read more at: http://phys.org/news/2016-08-climate-impact-drought-previously.html
“There’s a lot we don’t know, especially about hot droughts,” Swann said.
there is a lot about climate that seems to be unknown.
A month or so ago I was resurching a methiod to determine the amount of irrigation needed to be applied and looked up “Pan Evaporation” as a way to make up for the dayly water lost by my crop. One of the paragraphs involved remarked that for some unknown reason, in most locations the amount of water evaporation from the pans has decreased over the last 50 years.
AGW seems to reduce the evaporation rate! 😉 !
An ignorence of cause and effect in things of Climate seems to be quite wide spread amoung “Climate Science” practicioners…pg
The increase in the level of lava in the volcano Kilauea as a result of strong geomagnetic vibrations.

[mod] click on image for full size
Sorry.
http://losyziemi.pl/wzrost-aktywnosci-sejsmicznej-video
[mod] click on ‘translate’ option in link
pg sharrow says: August 31, 2016 at 3:43 am
“AGW seems to reduce the evaporation rate! 😉 !
An ignorence of cause and effect in things of Climate seems to be quite wide spread amoung “Climate Science” practicioners…pg”
I share your concern pg.
I’ve decided to grow tomato plants in my car port, in a ‘grow bag’, since previous failures of growing tomato plants in the ‘back garden’ per se (the ‘back garden’ scenario resulted in the over-production of ‘green tomato chutney’).
My decision to grow in near ‘poly-tunnel’ conditions (the ‘car port’ has a upvc canopy) is bearing fruit. Ripe tomatoes to be accurate.
I’ve only grown three plants in a ‘grow bag’, but the uptake of water by the plants varies when I open the ‘back door’ to the ‘car port’ and increase the ‘advective flow’ to the plant’s ‘reactive response’ when the ‘back door’ is open, rather than closed.
The plants ‘transpirate’ more when ‘wind-speed is higher’ (back door is open), but this isn’t an indication that plants draw more water from regolith/soil depth for this scenario. ‘Rainfall’ also plays its part.
Meagre ‘rainfall’ promotes a plant’s development towards a greater depth of ‘root growth’, but an ‘over supply’ of water (as in ‘hydroponics’) negates the need for the plant to produce a ‘root system’.
What we need to learn from this, IMHO, is how to predict the land surface precipitation for the type of crop planted in the forthcoming year. My enterprise seems to suggest that, primarily, ‘wind speed’ needs to be addressed.
‘Wind speed’ not only increases the rate of plant transpiration, it also determines the geographic interchange of gasses above land and ocean.
That’s all I can add.
Best regards, Ray.
ren says: September 2, 2016 at 7:59 am
“The increase in the level of lava in the volcano Kilauea as a result of strong geomagnetic vibrations.”
Question ren! Do you think that the ‘geomagnetic vibrations’ were mediated by ‘solar wind’ variation/variance, or other processes?
This occurrence is documented, but rarely observed AFAIK.
Best regards, Ray.
ren says: September 2, 2016 at 12:37 pm
“[mod] click on ‘translate’ option in link”
We can’t do that ‘mod’!
The ‘page’ is ‘hidden’ by a ‘Polish option’ before the ‘page’ is active!
Best regards, Ray.
[mod] works in Google Chrome, other browsers may vary
suricat says: September 5, 2016 at 2:35 am
“…”
“[mod] works in Google Chrome, other browsers may vary”
Too right mod! 🙂
I installed Chrome and was able to translate the script written on the ‘main page’, but ‘links to that page’ were still ‘untranslated’.
Whilst I remain sceptical on the point of ‘auto-translation’, it has its merits.
Moreover, ‘Chrome’ disclosed further postings by Tallbloke over and above the disclosure that MS ‘Edge’ disclosed/published to its readership.
Best regards, Ray.
Ray: I tried that link and ran the ‘translate’ option in Google Chrome. The only thing not translated was the title on the Youtube video, all the links were in English.
It can’t translate words embedded in an image.
Suricat, Oldbrew, I have Mozilla Firefox and ad blocker working (red icon on toolbar with letters ABP) , the Polish page comes up fine. I have Google Translate on the Tool bar (near the download arrow as a red capital T) this detected the web page language and translated to English. However, for this site there is a second option – on the Polish site there an area with some flags -if you press the English flag Angliski the page will be shown in English. but with some writing from the HTML to show the page layout. The Translate is better.
Chrome also has a Translate but I find Chrome difficult with regard to the bookmarks, history etc.
I find Mozilla the best. By the way it still works in updated form with all the abs on a XP .where Edge and Chrome no longer work as XP is no longer supported by Microsoft.
The Met Police could be using Mozilla then…
London’s Met Police has missed the Windows XP escape deadline
27,000 PCs still compute like it’s 2001
http://www.theregister.co.uk/2016/08/09/metropolitan_police_missed_xp_migration_deadline/
oldbrew says: September 6, 2016 at 10:27 am
“…”
I believe that is what I said.
cementafriend says: September 8, 2016 at 2:13 pm
“…”
I’m an old fool cementafriend. Looking at this site on my mobile phone I didn’t realise that the ‘top post’ was ‘sticky’! Thus, in my experience, the ‘first presentation’ of a site’s content is presented in ‘temporal format’. The ‘sticky thing’ came/comes later.
‘Windows’ is a commercial enterprise. Shouldn’t we be looking towards a more ‘democratic’ O/S like ‘open suse’ for our coms? After all, O/Ss and web pages ‘evolve’. Perhaps our confidence should be placed in a ‘viable’ foundation that can fulfil our need to communicate the truth (I’m not into ‘conspiracy scenarios’).
Best regards, Ray.
Ray, I wish they would not update so often. On one computer, I updated from Windows 7 Ultimate to Windows 10 Pro? for free. Everything was fine but with recent updates as they resolve problems some drivers have failed. The printers needed uninstallation and reinstallion. A video driver failed a few days ago which caused problems for almost a day while I shut down and rebooted in safe mode about 5 times. Eventually, a new video driver downloaded in a windows update when I shut down.. I still have XP on a lap top. It costs to upgrade to Windows 7, 8 or 10. My wife uses it occasionally to order library books and look at her email. Works fine with Mozilla and Avast (free) virus checker. I personally do not see Windows 10 being any better than XP in fact it seems more difficult to make adjustments in the control panel, the register etc but then I suppose I am
innot an expert. I remember the Apple 11 with 64kb memory and a Tandy tape recorder for programs such as a spreadsheet I wrote in basic using the “red book” roneoed instructions. Heck, that gives away my age.Meant to put “not an expert”
Meanwhile I await Roger’s conference report.
oldbrew, a number of governments including the British government paid millions of pounds to Microsoft for continuing support. XP systems are also for example in use in the NHS. (I’ve spotted them in supermarkets too)
Very likely these systems are never used on the open Internet, no web browser nor email usage. Only professional support alter the system. This typically means do the sensible, updates done rarely, churn for whimsical sake, no way.
[click] a timeswitch just powered up an XP Pro box behind me. This is archiving Met Office and other data on a daily basis. I get emailed a copy. [unclick]
cementafriend says: September 9, 2016 at 6:06 am
“…”
Hi cementafriend! As oldbrew intimates above, its corporate positioning and marketing that got you that free upgrade to Win 10! Microsoft is trying to make inroads into the ‘mobile market’ with a ‘slimmed down’ O/S. Thus, Win 8, Win 8.1 and Win 10 (whatever happened to the Win 9 O/S?).
IMHO, and I’m no expert either, the ‘slimmed’ O/S versions from Microsoft aimed at the ‘mobile market’ are too ‘lite’ on content and adaptability for PC and laptop hardware. Why accept a slimmed down ‘App’ when your machine can comfortably accommodate the full blown ‘Application’! 😉
So you think you gave away your age? I was disappointed to finally realise/accept that my ZX 80 couldn’t be programmed to display a ‘moving graphic’! Animation was an impossible capability for the machine. 🙂
My main ‘beef’ with the ‘free Win 10 upgrade’ is that the installation ‘deletes’ the ‘system old’ files a month after the upgrade. This makes it impossible to go back to your ‘old system’ a month after the installation of Win 10. I upgraded my ‘HP Pavilion g7’ many months ago to Win 10, but I’m still not confident of the O/S. However, I’ve an ‘image’ of my hard drive from a time ‘before the upgrade’, so I can still ‘revert’ to my ‘old system’ and retain recent activity with a skilful use of ‘data copying’.
I guess I’m lazy. I’ve not reverted back to Win 7 yet, but its still under consideration. 😉
Best regards, Ray.
suricat says on Win 10 “— ‘slimmed’ O/S versions from Microsoft aimed at the ‘mobile market’ are too ‘lite’ —“. So that explains why changing windows -say from photoshop to firefox -leaves remnants of photoshop visible. It has to be minimised to clear the screen. XP never did that. However speed is far better such as loading Scribus dtp.
The 11 year solar cycle signature on wave-driven dynamics in WACCM
NASA Astrophysics Data System (ADS)
Cullens, Chihoko Y.; England, Scott L.; Garcia, Rolando R.
2016-04-01
This study describes the influence of the 11 year solar cycle on gravity waves and the wave-driven circulation, using an ensemble of six simulations of the period from 1955 to 2005 along with fixed solar maximum and minimum simulations of the Whole Atmospheric Community Climate Model (WACCM). Solar cycle signals are estimated by calculating the difference between solar maximum and minimum conditions. Simulations under both time-varying and fixed solar inputs show statistically significant responses in temperatures and winds in the Southern Hemisphere (SH) during austral winter and spring. At solar maximum, the monthly mean, zonal mean temperature in the SH from July to October is cooler (~1-3 K) in the stratosphere and warmer (~1-4 K) in the mesosphere and the lower thermosphere (MLT). In solar maximum years, the SH polar vortex is more stable and its eastward speed is about 5-8 m s-1 greater than during solar minimum. The increase in the eastward wind propagates downward and poleward from July to October in the SH. Because of increase in the eastward wind, the propagation of eastward gravity waves to the MLT is reduced. This results in a net westward response in gravity wave drag, peaking at ~10 m s-1 d-1 in the SH high-latitude MLT. These changes in gravity wave drag modify the wave-induced residual circulation, and this contributes to the warming of ~1-4 K in the MLT.
http://www.science.gov/topicpages/y/year+solar+cycle.html
Tallbloke:
“El Niño refers to anomalous warming in the eastern equatorial Pacific, and has been studied
for nearly five decades (Bierknes 1969). Owing to its teleconnection, El Niño has global
effects, especially for atmospheric circulation anomalies in the tropics and extra-tropics.
However, another type of El Niño has also been recognized in recent studies, whose
maximum warming arises in the central Pacific and then extends eastward over time (Ashok
and Yamagata 2009). This new type of El Niño has its own spatial pattern, teleconnection,
and climate effect, and, in particular, has a strong decadal period (Ashok, Behera, and Rao
2007; Kug, Jin, and An 2009). However, its mechanism is not as clear as that of traditional El
Niño events. Generally speaking, the new type of El Niño is referred to as El Niño Modoki
and the traditional El Niño as eastern Pacific El Niño (EP El Niño) (Ashok, Behera, and Rao
2007; Kao and Yu 2009).
In early May 2014, a positive SST anomaly appeared in the equatorial central-eastern
Pacific, and was at the time thought to possibly be a very strong El Niño, like the one seen in
1997/98 (NASA 2014). However, in the subsequent months of 2014, the SST anomaly
unexpectedly fell back to a neutral state (Australian Government Bureau of Meteorology
2014). The role of off-equatorial surface temperature anomalies has been noted (Zhu et al.
2016). The arrival of weak El Niño conditions was then confirmed in May 2015 (NOAA
2015b), and it eventually developed into one of the strongest El Niño events on record. Some
studies and reports have suggested that this 2015/16 El Niño event will return to a neutral
state by late spring or early summer 2016, with a chance for La Niña development by fall
(International Research Institute for Climate and Society 2016). Alongside these events, in
2014, solar activity reached its 24th solar cycle peak.
Considering the influence of solar activity, we analyzed the characteristics of the 2015/16
El Niño’s evolution in this study. It is known that the positive SST anomaly first arose in the
central equatorial Pacific and northeastern Pacific near the west coast of North America
before the onset of the 2015/16 El Niño event, which looked like the onset of an El Niño
Modoki event (NOAA 2015a). However, it changed into an EP El Niño at a later time. Based
on our previous work, it is possible that solar activity modulates El Niño Modoki events on
decadal timescales. Thus, here, we investigated whether or not there was any influence of
solar activity on the 2015/2016 El Niño event, and, if so, how it worked. Specifically, based
on statistical analysis of historical data, we studied the evolutionary features of the 2015/16
El Niño event, in the hope of gaining greater insights into the possible impact of solar
activity.”
ABSTRACT
Recent SST and atmospheric circulation anomaly data suggest that the 2015/16 El Niño event
is quickly decaying. Some researchers have predicted a forthcoming La Niña event in late
summer or early fall 2016. From the perspective of the modulation of tropical SST by solar
activity, the authors studied the evolution of the 2015/16 El Niño event, which occurred right
after the 2014 solar peak year. Based on statistical and composite analysis, a significant
positive correlation was found between sunspot number index and El Niño Modoki index,
with a lag of two years. A clear evolution of El Niño Modoki events was found within 1–3
years following each solar peak year during the past 126 years, suggesting that anomalously
strong solar activity during solar peak periods favors the triggering of an El Niño Modoki
event. The patterns of seasonal mean SST and wind anomalies since 2014 are more like a
mixture of two types of El Niño (i.e., eastern Pacific El Niño and El Niño Modoki), which is
similar to the pattern modulated by solar activity during the years following a solar peak.
Therefore, the El Niño Modoki component in the 2015/16 El Niño event may be a
consequence of solar activity, which probably will not decay as quickly as the eastern Pacific
El Niño component. The positive SST anomaly will probably sustain in the central equatorial
Pacific (around the dateline) and the northeastern Pacific along the coast of North America,
with a low-intensity level, during the second half of 2016.
http://www.tandfonline.com/doi/pdf/10.1080/16742834.2016.1231567?needAccess=true
The El Niño Modoki
El Niño Modoki is a coupled ocean-atmosphere phenomenon in the tropical Pacific. It is different from another coupled phenomenon in the tropical Pacific namely, El Niño. Conventional El Niño is characterized by strong anomalous warming in the eastern equatorial Pacific (see figure below [in link]). Whereas, El Niño Modoki is associated with strong anomalous warming in the central tropical Pacific and cooling in the eastern and western tropical Pacific (see figure below). Associated with this distinct warming and cooling patterns the teleconnections are very different from teleconnection patterns of the conventional El Niño. Hence, the new phenomenon is of interest to the climate community.
http://www.jamstec.go.jp/frcgc/research/d1/iod/enmodoki_home_s.html.en
Well, that went well. The London conference was a huge success and I’ll write up a post about it tomorrow.
For now, a brief interview I did with Energy Live News.
It seems that El Niño was waiting at the top of geomagnetic activity.

Let’s see the actual heat content of the Pacific.
http://www.ospo.noaa.gov/Products/ocean/ohc_spac.html
Current circulation in the Pacific is not favorable for La Nina.

Katla does not sleeps.
http://www.vedur.is/skjalftar-og-eldgos/jardskjalftar/myrdalsjokull/
Something from WUWT I found interesting: https://wattsupwiththat.com/2016/09/04/chaos-climate-part-3-chaos-models/
It is a looong read and I have not gone thru it all yet, but I sense something that was being missed – by myself for sure.
oldmanK, gullible suckers — mistaking TEMPORAL chaos for SPATIOtemporal chaos — get hooked on a bubble. Elaboration:
(I won’t be following or commenting any further on this thread as the page-loading delays are too problematic.)
ren says: September 11, 2016 at 7:36 am
Hi ren, I’m a bit puzzled as to why the horizontal axis of the graph you link to is graduated in Earth calendar months. Surely this confuses ‘solar wind anomalies’ with the ‘seasonally changing azimuth of insolation to Earth’.
I mention this because the ‘Luna cycle’ iterates 13 times ‘par annus’, whilst the ‘seasonal Earth month’ iterates 12 times ‘par annus’. This would take/initiate a 12:13 ratio for the year before a ‘coincidence of true data’ could show. That’s a 12-13 year period before a ‘true data point’ can be harvested. Small wonder that the ‘Monthly Values’ are chaotic.
Let’s look at this more closely. Magnetohydrodynamics predicts that a constant ‘flux’ produces a ‘constant reactance/outcome’. However, in the Sol, Earth, Lunar model the reactance and outcome varies with the lunar position WRT Sol and Earth.
The scenario where Earth observes a ‘full moon’ the ‘moon’ is affected by Earth’s disturbance/turbulence to Sol’s ‘wind’. OTOH, the Earth is also affected by Luna’s disturbance/turbulence to Sol’s ‘wind’ when/during a ‘new moon’ phase.
IMHO your presentation shows a chaotic response that I don’t want to pursue. 😦
A ‘graph’ showing Ap against lunar periodicity would be more welcome to me, and, perhaps, ‘others’.
Best regards, Ray.
Suricat, If you want, give me exact spec and I may be able to knock something together for you.
suricat
Magnetic activity on the sun affects JETSTREAM. That is why El Niño in 2015, has not developed quickly since circulation was unfavorable. Similarly it is now with La Niña. Low solar activity (JETSTREAM) inhibit its development.
suricat
It is better to understand it owing to animation.
http://www.goes.noaa.gov/sohemi/sohemiloops/shirgoescol.html
In mid-September JETSTREAM will move back more to the south.

Seen on the chart above the waves arise from the waves in the south.
Tiny Solar Activity Changes Affect Earth’s Climate (2013 report)
“the light reaching the top of the Earth’s atmosphere provides about 2,500 times as much energy as the total of all other sources combined,” solar physicist Greg Kopp at the University of Colorado told SPACE.com. As such, even 0.1 percent of the amount of light the sun emits exceeds all other energy sources the Earth’s atmosphere sees combined
http://www.space.com/19280-solar-activity-earth-climate.html
Excess ozone means high-pressure area, underflow low.

Next cold fronts will attack the United States from the northwest.
” Atmospheric anomalies over the tropical Pacific Ocean largely indicated ENSO-Neutral conditions. The traditional Southern Oscillation index and the equatorial Southern Oscillation index were weakly positive during August. The lower-level winds were near average, while the upper-level winds were anomalously westerly in a small region to the east of the International Date Line. Convection was suppressed over the western and central tropical Pacific, although less suppressed compared to last month (Fig. 5).”
http://www.cpc.ncep.noaa.gov/products/analysis_monitoring/enso_disc_sep2016/ensodisc.shtml
“But what needs to happen to really get La Niña conditions underway is for those stronger-than-average winds to blow across the surface of the equatorial Pacific, cooling the surface and helping to keep warm waters piled up in the far western Pacific. We’ve seen some weak bursts of this activity over the past few months, but nothing has settled in for the long haul.
Without this atmospheric feedback, the large area of cooler subsurface waters that we saw back in the late spring has decreased substantially. Yes, the surface has cooled, but there’s not much cool subsurface water left to extend or intensify the conditions. For fun, have a look at the subsurface during August of 1983, 1998—other years following a strong El Niño—and 2016.”
Let’s see what is the difference of solar activity in 1998 and in 2016. Therefore, the upper winds hinder the development of La Niña.
It is better to compare geomagnetic activity in 1998 and 2016.


Bamse says: September 12, 2016 at 4:19 am
“Suricat, If you want, give me exact spec and I may be able to knock something together for you.”
First of all, if you think my post has some impact/influence to the science knowledge base I’m flattered, but if you do want to “knock something together” the credit is all yours. 🙂
Secondly, my main concern is that the ‘Ap index’ is monitored without a value for ‘solar wind shadow’ by the Moon (other inferior planets also generate a ‘shadow’ [turbulent disruption to the solar wind], but to a much lesser degree for Earth).
IMHO the most expedient way to show any ‘Lunar shadow’ is to ‘data mine’ the source of ren’s graphic presentation and exclude data from ‘CME’ events (this would exclude any ‘major’ Sol behavioural aberration). Now produce graphs of ‘Ap’ for periods either side of 1/8 of Lunar transition to ‘full moon’ and ‘new moon’ (this gives the maximum disparity between a ‘free flow’ and a ‘turbulent flow’ environment for solar wind to Earth) then compare them for anomalies. This should ~disclose the MHD peak anomaly generated by Earth’s moon.
If I’m wrong, I apologise in advance.
ren says: September 12, 2016 at 7:14 am
“…”
This may be true, but ‘the mechanism’ for the/this teleconnection is unknown AFAIK.
ren says: September 12, 2016 at 7:23 am
“…”
Again, what produces this effect?
ren says: September 12, 2016 at 7:30 am
“In mid-September JETSTREAM will move back more to the south.”
More accurately, its current Northerly mid Atlantic track will take a more Easterly direction, but ‘why’? An ‘MPH’ (Mobile Polar High) is well documented.
Unless/until you provide a more complete description to your postings I’ll refrain from a reply.
oldbrew says: September 12, 2016 at 10:14 am
“Tiny Solar Activity Changes Affect Earth’s Climate (2013 report)”
OB, this relates to ‘EMR’ (Electro Magnetic Radiation) and ‘not’ ‘magnetic activity’! What do you want to discuss here?
Bamse says: September 12, 2016 at 4:19 am
“…”
Please interject Bamse!
Best regards, Ray.
suricat
It seems that this circulation will accelerate the development of La Niña. We shall soon see.
https://earth.nullschool.net/#current/wind/isobaric/250hPa/orthographic=-242.63,-7.76,452
Will be more rain in Australia.
ren says: September 14, 2016 at 7:16 am
“…”
That’s a great graphic for ‘Global Circulation’ ren, but is its construction from ‘observed data’, or ‘modeled data’?
Whatever, it shows ‘wind direction’ with an indicator for its speed at ‘altitude ?’ for a pressure of ~250 hPa. This doesn’t disclose the ‘actual’ altitude for the model/observation, only the pressure at which the ‘flow’ is in evidence. See here:
https://en.wikipedia.org/wiki/Atmospheric_pressure
Moreover, ‘insight’ into the ‘Global Circulation flow’ would be better understood if we refer to East – West peramerterisation/distinction. A region of atmosphere with a ‘positive altitude increase’ (rising) falls ‘retrograde’ to Earths rotation (to the west) due to its ‘inertia’ not receiving rotational energy following its departure from the ‘boundary region’ of altitude (the green arrows). However, atmosphere that traversed to ‘higher latitudes’ that/which is physically forced by a ‘pressure/flow dynamic’ to ‘fall’ to ‘lower altitudes’ posesses a greater rotational inertia/energy than the Earth’s surface speed, thus, ‘the red arrows’ which denote ‘over-spin’, or a region of atmosphere that travels around the Earth ‘faster’ than the local region of Earth’s surface.
Green ‘East to West’ arrows in your link represent H2O rich ascending regions of atmosphere, whereas ‘red/purple’ arrows represent ‘dry’ and ‘descending’ regions where ‘water’ has already ‘rained out’ during the ‘green rising phase/direction’.
Please explain how your link shows that there “Will be more rain in Australia.” when the link shows that only the most ‘northern’ and southern’ latitudes of the continent can expect ‘rain’!
Also. Please explain how an ‘atmospheric configuration’ can alter a ‘sea surface’ phenomenon (I’d like a try at this myself, but I doubt it would be convincing/accurate enough) 🙂
Best regards, Ray.