


Solar maximum part two on the way.
Archive for the ‘Solar physics’ Category
X-class flare as two sunspots explode in tandem
Posted: March 26, 2024 by oldbrew in News, Solar physicsTags: sunspots
1
Record-Breaking Detection of Solar Photons
Posted: August 4, 2023 by oldbrew in cosmic rays, data, Energy, modelling, research, Solar physicsTags: baffled scientists, solar

The HAWC detector (2014) [image credit: Jordanagoodman @ Wikipedia]
In a related Phys.org article a researcher says: “The sun is more surprising than we knew. We thought we had this star figured out, but that’s not the case.” But it has long been known that cosmic rays go up when solar activity goes down, and vice versa.
– – –
Observations over the past decade or so have shown that the Sun emits many more gamma rays at GeV energies than is expected from modeling, says APS Physics.
Now a collaboration operating the High-Altitude Water Cherenkov (HAWC) Observatory in Mexico show that this gamma-ray excess extends up to TeV energies [1].
This finding has implications for our understanding of both stellar atmospheres and astroparticle physics.
Sunspot Counts Hit 21-Year High
Posted: July 6, 2023 by oldbrew in predictions, Solar physicsTags: solar, sunspots
.
.
Another busy month for cycle 25.
July 2, 2023: The sun is partying like it’s 2002. That’s the last time sunspot counts were as high as they are now. The monthly average sunspot number for June 2023 was 163, according to the Royal Observatory of Belgium’s Solar Influences Data Analysis Center. This eclipses every month since Sept. 2002:

Solar Cycle 25 wasn’t expected to be this strong. When it began in Dec. 2019, forecasters believed it would be a weak cycle akin to its immediate predecessor Solar Cycle 24. If that forecast had panned out, Solar Cycle 25 would be one of the weakest solar cycles in a century.
Instead, Solar Cycle 25 has shot past Solar Cycle 24 and may be on pace to rival some of the stronger cycles of the 20th century. The last time sunspot numbers were this high, the sun was on the verge of launching the Great Halloween Storms
View original post 55 more words
Geomagnetic Storms Pump Terawatts into the Thermosphere
Posted: June 4, 2023 by oldbrew in Geomagnetism, Solar physics, TemperatureTags: sunspots
.
.
Solar activity remained high throughout May.
June 2, 2023: If you’re a satellite, this story is important.
A series of geomagnetic storms in 2023 has pumped terawatts of energy into Earth’s upper atmosphere, helping to push its temperature and height to a 20-year high. Air surrounding our planet is touching satellites in low Earth orbit and dragging them down.
“Blame the sun,” says Martin Mlynczak of NASA Langley. “Increasing solar activity is heating the top of the atmosphere. The extra heat has no effect on weather or climate at Earth’s surface, but it’s a big deal for satellites in low Earth orbit.”

Above: A severe geomagnetic storm on March 24, 2023, injected more than a terawatt of infrared energy into the thermosphere. Image credit: Michael Underwood in Yellowstone National Park
Mlynczak is an expert on the temperature up there. For 20 years he has been using the SABER instrument on NASA’s TIMED satellite to monitor infrared…
View original post 386 more words
Jupiter, Earth and Venus’ tropical alignments point to the mean solar cycle length
Posted: April 22, 2023 by tallbloke in Astronomy, Astrophysics, Celestial Mechanics, climate, Cycles, research, Solar physics, solar system dynamicsTags: planetary, solar

Precession of Earth’s axis [image credit: NASA, Mysid @ Wikipedia]
A number of researchers have hypothesised that the relative motions of Jupiter, Earth and Venus are connected to the length of solar cycles. In this post we will show that cyclic periods of 83 years (Gleissberg), 166 years (Landscheidt, Wilson), and 996 years (Eddy, Stefani et al) are found not just in the syzygies and synodic periods between these planets, but also in their heliocentric orientations with respect to a frame of reference rotating at the rate of Earth’s axial precession. This discovery has implications for our understanding of the forces driving that axial precession, and opens some new avenues for hypothesising about the links between planetary motion and solar activity variations.
– – –
We propose that not only amplitude, but the mean period of the solar cycle itself derives from planetary influence in a specific manner.
Solar cycle 25 ‘is exceeding expectations in terms of activity’
Posted: March 4, 2023 by oldbrew in Cycles, Geomagnetism, Solar physicsTags: solar, sunspots

Variation in solar activity during a recent sunspot cycle [credit: Wikipedia]
The article says ‘The average sunspot numbers for January and February 2023 were some of the highest for around 10 years’. Rarely mentioned, but Jupiter’s perihelion, i.e. its closest orbital approach to the Sun, occurred in late January.
– – –
With several solar flares and coronal mass ejections soaring out into space, the sun has had an active few months as the current solar cycle gathers momentum, says Newsweek.
This solar cycle, Solar Cycle 25, is exceeding expectations in terms of activity, as it was initially forecast in 2019 that it would have a similar activity level to that of the previous cycle.
However, Solar Cycle 25 has now outperformed the official forecast for over 24 consecutive months, with sunspot numbers already approaching those seen during the maximum of the previous cycle.
The average sunspot numbers for January and February 2023 were some of the highest for around 10 years, according to NOAA data, with January seeing 143 sunspots, while February had 110. The previous highest-scoring month was during the peak of the previous cycle, Solar Cycle 24, with 146 sunspots occurring in February 2014.
The solar cycle follows 11-year fluctuations of activity, increasing towards the solar maximum in the middle of each cycle. The last solar minimum was in 2019, with the next solar maximum forecast for 2025. Solar Cycle 25 is so-called because it is the 25th cycle since records began in 1755.
These increased sunspot levels have led to higher frequencies of solar activity, such as solar flares and coronal mass ejections (CMEs), which have lit up the night sky with spectacular aurora as far south as France, and caused several geomagnetic storm-triggered radio blackouts in the past week alone.
When the twisted magnetic fields of sunspots suddenly realign, this can cause the sun to release huge amounts of electromagnetic radiation in the form of solar flares, and also spew out vast clouds of solar plasma as CMEs.
These solar phenomena then react with the chemicals in our atmosphere, leading to a kaleidoscope of colors being seen in the night sky in the form of the Northern and Southern lights, as were seen across the world on Tuesday as a result of two massive CMEs released on February 24 and 25.
Full article here.
– – –
NASA’s Solar Cycle 25 blog is here.
Sunspot Counts Hit a 7-Year High
Posted: January 4, 2023 by oldbrew in News, Solar physicsTags: sunspots
.
.
What happens next?
Jan. 2, 2022: December was a busy month on the sun. How busy? Senol Sanli of Bursa, Turkey, answered the question by stacking 26 days of sun photos (Dec. 2nd – 27th) from NASA’s Solar Dynamics Observatory:
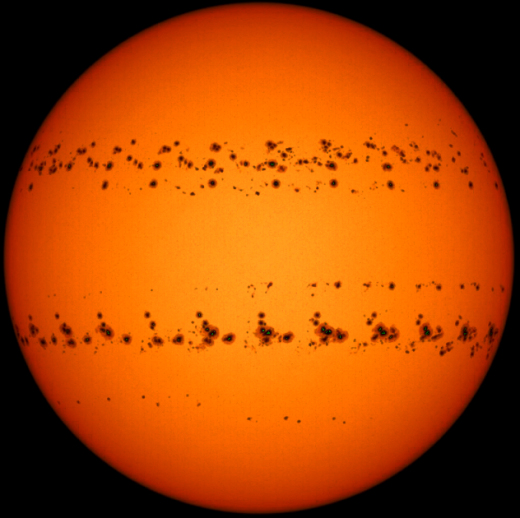
“There were more than 24 sunspot groups, some of them quite large, congested in two bands on opposite sides of the sun’s equator,” says Sanli.
The congestion of dark cores catapulted the monthly sunspot number to its highest value in 7 years:
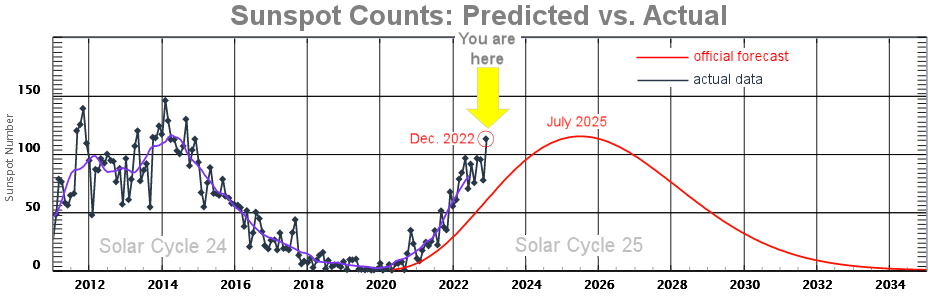
This plot from NOAA shows the ascending progression of Solar Cycle 25. It has outperformed the official forecast for 35 months in a row. If the trend continues, Solar Maximum will either happen sooner or be stronger than originally expected–possibly both. Stay tuned for lots more sunspots.
This story was brought to you by Spaceweather.com
A New Form of Space Weather on Betelgeuse
Posted: August 18, 2022 by oldbrew in Astrophysics, Solar physicsTags: solar
.
.
“We’re watching stellar evolution in real time.”
August 12, 2022: You’ve heard of a CME, a “coronal mass ejection.” They happen all the time. A piece of the sun’s tenuous outer atmosphere (corona) blows off and sometimes hits Earth. Something far more terrible has happened to Betegeuse. The red giant star produced an SME, or “surface mass ejection.”

Astronomers believe that in 2019 a colossal piece of Betelgeuse’s surface blew off the star. The mass of the SME was 400 billion times greater than a CME or several times the mass of Earth’s Moon. Data from multiple telescopes, especially Hubble, suggest that a convective plume more than a million miles across bubbled up from deep inside the star, producing shocks and pulsations that blasted a chunk off the surface.
“We’ve never before seen such a huge mass ejection from the surface of a…
View original post 266 more words
The Bastille Day Event
Posted: July 14, 2022 by oldbrew in atmosphere, Solar physics, solar system dynamicsTags: solar
.
Some interesting solar physics here.
July 14, 2022: When a solar storm is so strong that the Voyager spacecraft feel it at the edge of the solar system, you know it must be special. Twenty-two years ago today, July 14, 2000, the lonely travelers were on the verge of escaping space weather altogether when giant sunspot AR9077 exploded. The flare was so intense, it sent shockwaves to the very edge of the solar system.
 |  |
Earth was on the doorstep of the blast, dubbed The “Bastille Day Event” because it coincided with the national day of France. Subatomic particles, especially protons, arrived in a ferocious wave, peppering satellites and penetrating deep into Earth’s atmosphere. Sensors on Earth’s surface registered a rare GLE–a “ground-level event.”
“People flying in commercial…
View original post 498 more words
The Termination Event has Arrived
Posted: February 26, 2022 by oldbrew in Cycles, Solar physics, solar system dynamicsTags: solar
.
.
According to a new theory of solar cycles, that is.
Feb. 25, 2022: Something big just happened on the sun. Solar physicists Scott McIntosh (NCAR) and Bob Leamon (U. Maryland-Baltimore) call it “The Termination Event.”
“Old Solar Cycle 24 has finally died–it was terminated!” says McIntosh. “Now the new solar cycle, Solar Cycle 25, can really take off.”
The “Termination Event” is a new idea in solar physics, outlined by McIntosh and Leamon in a December 2020 paper in the journal Solar Physics. Not everyone accepts it–yet. If Solar Cycle 25 unfolds as McIntosh and Leamon predict, the Termination Event will have to be taken seriously.

The basic idea is this: Solar Cycle 25 (SC25) started in Dec. 2019. However, old Solar Cycle 24 (SC24) refused to go away. It…
View original post 345 more words
Huge Explosion on the Farside of the Sun
Posted: February 20, 2022 by oldbrew in Solar physicsTags: sunspots
.
.
The culprit could be coming into view in the next day or so.
Feb. 17, 2022: New images from the Solar and Heliospheric Observatory (SOHO) are giving us a better look at yesterday’s farside explosion. SOHO coronagraphs recorded the most dramatic CME in years:
No, there won’t be a geomagnetic storm. The explosion happened on the farside of the sun, so the CME is heading away from Earth. We dodged a bullet.
Some readers have asked “How strong was the underlying solar flare?” We don’t know. Solar flares are classified by their X-ray output, but there are no spacecraft on the farside of the sun with X-ray sensors. Best guess: It was an X-flare.
You might suppose that the farside of the sun is hidden from view. However, researchers using a technique called “helioseismology” can make crude maps of the sun’s hidden hemisphere. Their latest map reveals a huge farside active region:
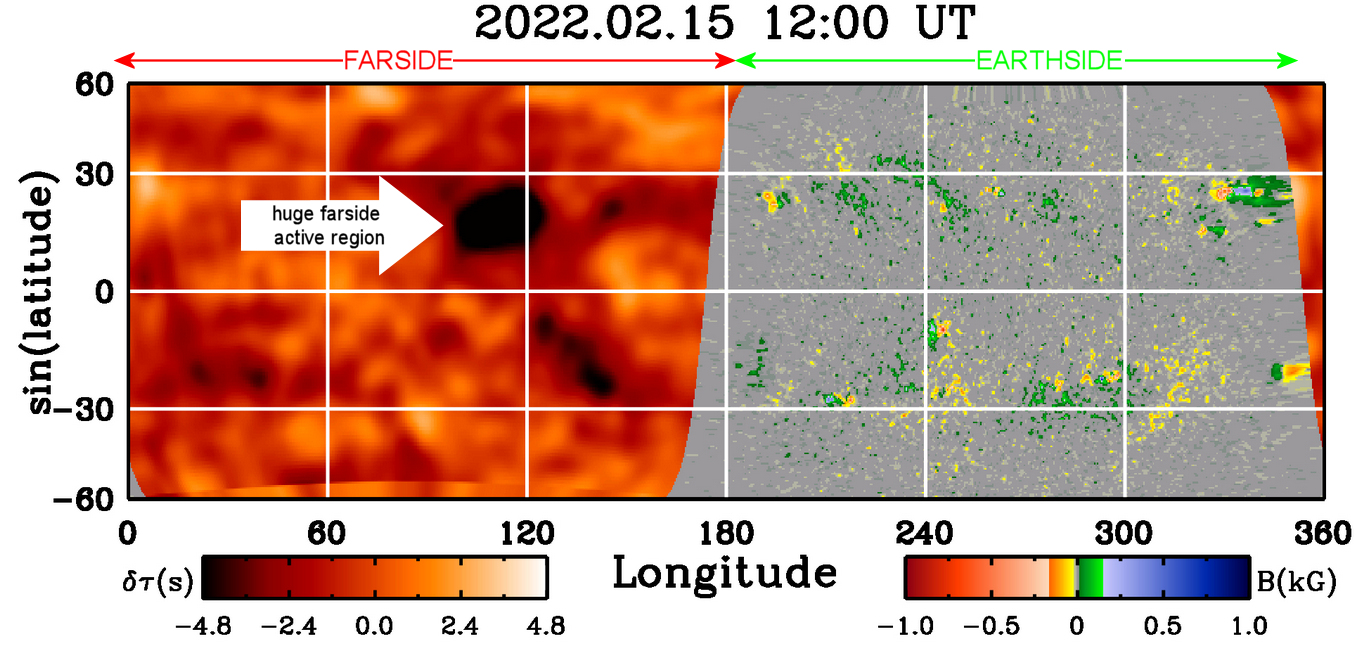
The black blob is a sunspot group–a big one–and…
View original post 138 more words
Reply to Eschenbach’s Meander Through Sun and Wind
Posted: December 28, 2021 by tallbloke in Astrophysics, climate, cosmic rays, Critique, Cycles, Natural Variation, propaganda, Solar physics, solar system dynamics, TidesTags: WAnkers, Willis, WUWT
Over at WUWT, Willis has been up to his usual trick of mangling data in a vain attempt to discredit scientists who find strong links between the Sun’s variation and Earth’s weather and climatic patterns. This time it’s Le Mouel et al who get the treatment in his ‘analysis’ of their 2010 paper “Solar forcing of the semi‐annual variation of length‐of‐day”
As usual, Willis gets things upside down and then sets up a straw-man argument. He asks: “So … is there a correlation between sunspots and zonal wind speeds?” The answer to which is no, and the paper’s authors never claimed there was. However, as Fig 1 of Le Mouel et al’s paper shows, there is a strong anti-correlation between solar variation and the semi-annual variation of Length of Day (LOD) which is itself well correlated with changes in zonal wind speeds. For obvious reasons, Willis doesn’t show his readers Fig 1, reproduced here for your academic study.

window is used. (a) Comparison of the semiannual amplitude of lod with the sunspot number WN (red); WN is both
reversed in sign and offset by one year (see text). (b) Comparison of the detrended semiannual amplitude of lod (blue) with
the sunspot number WN (red); WN is reversed in sign and offset by one year. (c) Comparison of the semiannual amplitude
of lod (blue) with galactic cosmic ray flux GCR (red); GCR is neither reversed in sign nor offset (see text).
Orbital resonance and the celestial origins of Earth’s climatic changes – Why Phi?
Posted: October 30, 2021 by tallbloke in Analysis, Astrophysics, Celestial Mechanics, climate, COP26, Cycles, Ice ages, modelling, moon, Natural Variation, Phi, research, Solar physics, solar system dynamicsTags: Fibonacci series, Lucas series

A year after I wrote the original ‘Why Phi’ post explaining my discovery of the Fibonacci sequence links between solar system orbits and planetary synodic periods here at the Talkshop in 2013, my time and effort got diverted into politics. The majority of ongoing research into this important topic has been furthered by my co-blogger Stuart ‘Oldbrew’ Graham. Over the last eight years he has published many articles here using the ‘Why Phi’ tag looking at various subsystems of planetary and solar interaction periodicities, resonances, and their relationships with well known climatic periodicities such as the De Vries, Hallstatt, Hale and Jose cycles, as well as exoplanetary systems exhibiting the same Fibonacci-resonant arrangements.
Recently, Stuart contacted me with news of a major breakthrough in his investigations. In the space of a few hours spent making his calculator hot, major pieces of the giant jigsaw had all come together and brought ‘the big picture’ into focus. In fact, so much progress has been made that we’re not going to try to put it all into a single post. Instead, we’ll provide an overview here, and follow it up with further articles getting into greater detail.
(more…).
Sunspot AR 2860 is a ‘monster’.
Aug. 27, 2021: Sunspot AR2859 erupted on Aug. 26th, producing a C3-class solar flare: movie. The flare, however, was not the main attraction. The eruption also caused a massive “solar tsunami.” Watch the shadowy wave ripple across the sun in this false-color ultraviolet movie from NASA’s Solar Dynamics Observatory:
The expanding circular shadow is a wave of hot plasma and magnetism. Based on the time it took to reach the next sunspot, halfway around the sun, the tsunami was traveling faster than 110,000 mph.
Solar tsumanis always herald a CME, and this one was no exception. Soon after the tsunami broke, SOHO coronagraphs detected a plasma cloud leaving the sun: movie.
Update: NOAA analysts have modeled the CME’s trajectory. They predict an Earth impact during the late hours of Aug. 29th, possibly sparking G1-class geomagnetic storms through midday on Aug. 30th. Aurora alerts:SMS Text.
SOLAR…
View original post 134 more words
Solar Cycle 25 Predictions Update: Talkshop vs Svalgaard
Posted: May 18, 2021 by tallbloke in Forecasting, Solar physics, solar system dynamicsThe last time we took a look at Leif Svalgaard’s SC25 prediction in 2018, he was predicting a peak amplitude of around 140SSN in 2024 according to the plot or (giving himself more latitude) “SC25 will be somewhere between SC24 and SC20, provided the Polar Field Precursor Relationship holds.”
This has been modified in his latest presentation on the subject. The peak amplitude has been revised downwards to 128+/-10SSN.

Ned Nikolov: What Can NASA Planetary Data Tell Us about Drivers of Earth’s Climate?
Posted: February 8, 2021 by tallbloke in Analysis, Astrophysics, atmosphere, climate, Clouds, Maths, Measurement, methodology, modelling, pressure, Solar physics, solar system dynamics
Ned Nikolov, Ph.D. Has written to me with news of the presentations he made at this years AMS meeting. It’s vital we get people to understand the implications of the discoveries he and Karl Zeller have made. With our western governments jumping aboard the ‘Green New Deal’ and ‘NetZero’ bandwagons, we will need to work hard to rise awareness of viable alternative hypotheses for ‘climate change’ and ‘global warming’ which better explain the phenomena we can measure around us. Ned and Karl’s work should be given proper attention, because it strives for universality and general application of physics solar system wide, rather then treating Earth as a ‘special case’.
Two studies presented at the American Meteorological Society’s 34th Conference on Climate Variability and Change in January 2021 employed a novel approach to identify the forcing of Earth’s climate at various time scales. The new method, never attempted in climate science before, relies on the fundamental premise that the laws of nature are invariant across spacetime.
(more…)MET Office global temperature prediction falls 0.35C in 5 years.
Posted: February 3, 2021 by tallbloke in Analysis, climate, data, Dataset, ENSO, Forecasting, MET office, methodology, modelling, Natural Variation, Ocean dynamics, Solar physics
Back in 2016, the UK MET Office’s median projection to the start of 2021 forecast a global temperature temperature anomaly of 1.4C above their 1850-1900 “Pre-Industrial” baseline. Their recently published five year model projection (rightmost blue blob on graph), shows a 2021 median anomaly 0.35C lower, at 1.05C.
Their HADcruT 4GL temperature time series (data since 2016 added in red on graph) shows a linear trend of +0.09C/semi-decade for the last 50 years. CO2, by far the biggest forcing in their model, is still rising in lockstep with the 50 year temperature trend. What could have caused this remarkable downward step change in their model output?
(more…)New sunspot cycle could be one of the strongest on record, says NCAR
Posted: December 8, 2020 by oldbrew in Cycles, predictions, Solar physics, solar system dynamicsTags: sunspots

Credit: cherishthescientist.net
‘Scientists use an extended, 22-year solar cycle to make the forecast’ is the sub-heading to the article. In other words the Hale cycle. At the end of last year The Talkshop detailed Plenty of predictions from a wide range of research groups, including our own, made in 2013. A possible (?) early indicator is that the ‘smoothed minimum’ of sunspots at the start of solar cycle 25 is given by Wikipedia as 1.8, the lowest recorded since cycle 7 (0.2) in 1823.
– – –
In direct contradiction to the official forecast, a team of scientists led by the National Center for Atmospheric Research (NCAR) is predicting that the Sunspot Cycle that started this fall could be one of the strongest since record-keeping began, says NCAR News.
In a new article published in Solar Physics, the research team predicts that Sunspot Cycle 25 will peak with a maximum sunspot number somewhere between approximately 210 and 260, which would put the new cycle in the company of the top few ever observed.
Solar linked 2C downturn in Canadian prairie temperatures affecting grain yields.
Posted: October 26, 2020 by tallbloke in Agriculture, climate, Solar physics, solar system dynamics
H/t to Electroverse for the heads up on this paper detailing the effect of reduced solar activity and cyclic oceanic oscillations on Canadian agriculture. Let’s hope the policymakers see through the warming dogma in time.
Is Diminishing Solar Activity Detrimental to Canadian Prairie Agriculture?
Ray Garnett¹*, Madhav Khandekar² and Rupinder Kaur³
Abstract: During the grain growing months of May-July, the mean temperature on the Canadian prairies has cooled down by 2ºC in the last 30 years. The cooling appears to be most certainly linked to diminishing solar activity as the Sun approaches a Grand Solar Minimum in the next decade or so. This cooling has led to a reduction in Growing Degree Days (GDDs) and has also impacted the precipitation pattern. The GDDs in conjunction with mean temperature and precipitation are important parameters for the growth of various grains (wheat, barley, canola etc.) on the prairies.
(more…)Solar orbiter’s first science data shows the sun at its quietest
Posted: October 1, 2020 by oldbrew in Cycles, data, research, Solar physicsTags: sunspots
Quiet sun [image credit: NASA]
They picked an interesting time to study the Sun, as it starts to emerge from an unusually deep and long-lasting solar minimum. What effect this might have on Earth’s weather systems of course remains to be seen, but could be hard to quantify. The researchers have a lot of data to work through, and are hoping for ‘unprecedented insights into the sun’.
– – –
Three of the Solar Orbiter spacecraft’s instruments, including Imperial’s magnetometer, have released their first data, reports Phys.org.
The European Space Agency’s Solar Orbiter spacecraft launched in February 2020 on its mission to study the sun and it began collecting science data in June.
Now, three of its ten instruments have released their first tranche of data, revealing the state of the sun in a ‘quiet’ phase.
The sun is known to follow an 11-year cycle of sunspot activity and is currently almost completely free of sunspots.
